0974
RAFF4, magnetization transfer and diffusion tensor MRI in a mouse model of demyelination and remyelination1A.I. Virtanen Institute for Molecular Sciences, University of Eastern Finland, Kuopio, Finland, 2Roche Pharma Research and Early Development, Neuroscience and Rare Diseases, Roche Innovation Center, Basel, Switzerland
Synopsis
Keywords: Other Neurodegeneration, Relaxometry, Demyelination, remyelination, RAFF4, MT, DTI
Motivation: In vivo assessment of myelin status is important for diagnostic and therapeutic purposes in multiple sclerosis.
Goal(s): The goal of this study was to explore the capability of RAFF4, MT, and DTI metrics to detect changes in the myelin content and integrity during both demyelination and remyelination.
Approach: A genetic mouse model of widespread demyelination and remyelination was imaged with RAFF4, MT, and DTI and the MRI metrics were compared with histological analyses.
Results: Both RAFF4 and MT detected differences between the disease model and control animals in both demyelination and remyelination. DTI differed only in the demyelination phase.
Impact: RAFF4 showed the ability to detect both demyelination and remyelination in the mouse brain. This suggests that RAFF4 has great potential in serving as a translational biomarker in the development of new therapeutic agents for myelin repair.
Introduction
The quantitative assessment of demyelination and remyelination is important for diagnostic and therapeutic purposes of diseases such as multiple sclerosis (MS)1. Recently, the MRI method “Relaxation Along a Fictitious Field in the rotating frame of rank n” (RAFFn) was introduced2, which showed sensitivity to myelin content in a rat model of local de- and remyelination3,4 and detected abnormalities in MS patients5. Here, we utilized a genetic mouse model of demyelination induced by tamoxifen (MyRF-iCKO). The process of demyelination peaks around 10 weeks post-induction and is followed by gradual but incomplete myelin repair6. Since demyelination and remyelination occur in distinct phases, we used this model to explore the ability of RAFF4, magnetization transfer (MT), and diffusion tensor imaging (DTI) metrics to distinguish between the different myelination stages.Methods
19 MyRF-iCKO mice (10 females and 9 males) received 5 daily i.p. injections of tamoxifen and 16 MyRF-iCKO mice (8 females and 8 males) were injected with corn oil. The animals were imaged at baseline and then 7- and 19-weeks post-injections to explore the demyelination and remyelination phases, respectively. We have previously introduced a protocol for TRAFF4, magnetization transfer ratio (MTR), and T1sat quantification in rats3. Here, we used the same RAFF4 and MT preparation pulses on a 7T Bruker MRI scanner equipped with a standard volume transmit and quadrature receive RF-coil pair. The fast spin-echo sequence used for the readout was optimized for mouse imaging: TR=4s, TE=8.3ms, Necho=8, slice thickness=0.25mm, FOV=20x20mm², matrix size=160x160. Additionally, DTI was acquired with spin-echo EPI with TR=1s, TE=33.7ms, FOV=14×14×8mm3, matrix=112×112×64, b=1200s/mm2 with 21 diffusion directions. The mean diffusivity (MD), fractional anisotropy (FA), and radial (RD) and axial (AD) diffusivity maps were calculated. At termination, all animals were perfused and 25µm thick coronal brain sections were stained with either Nissl or gold chloride to assess the cytoarchitecture and myeloarchitecture, respectively. For region of interest (ROI) analysis, an ROI was placed in the corpus callosum, and mean values were calculated. Principal component analysis (PCA) was performed on the normalized myelin and Nissl-intensities to explore a potential clustering of the data.Results
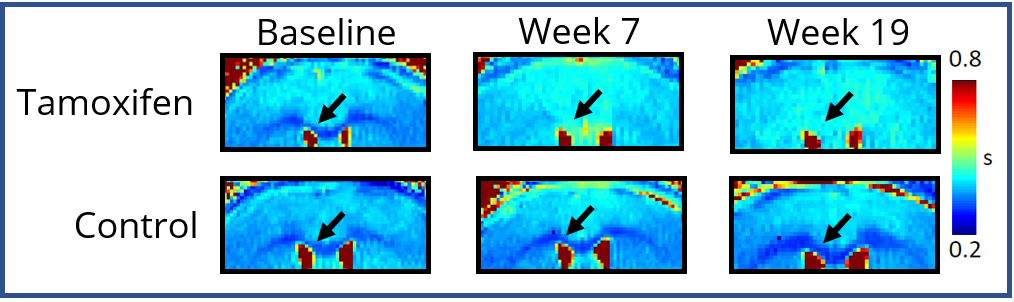
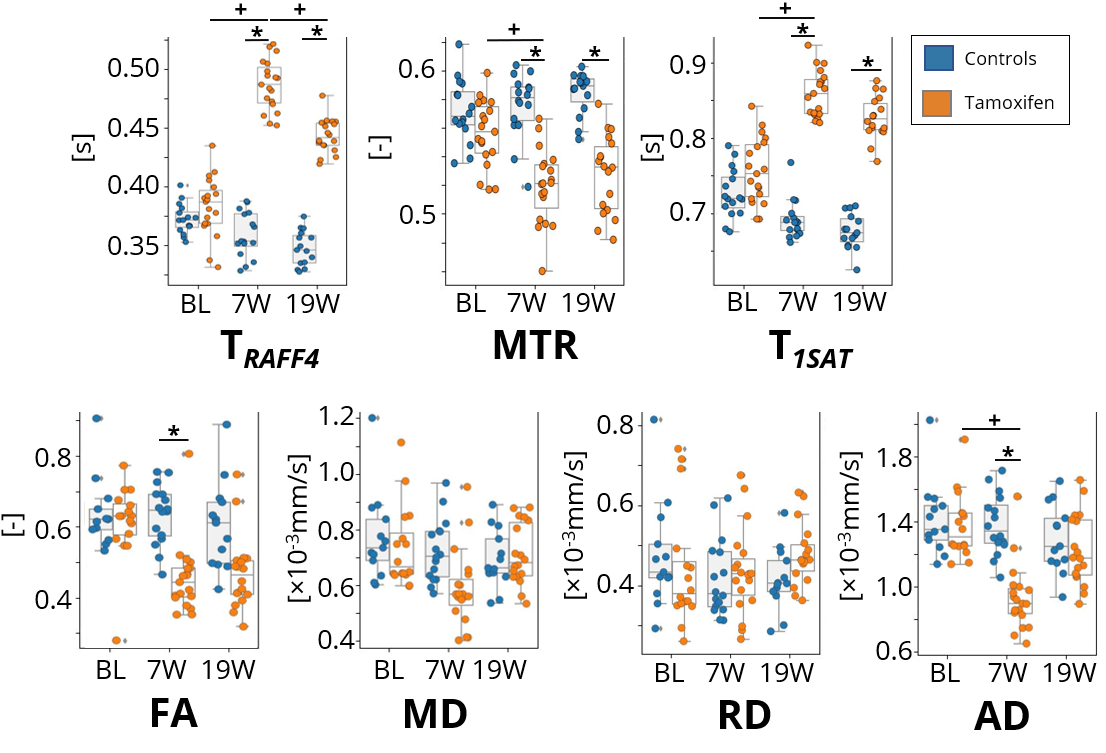
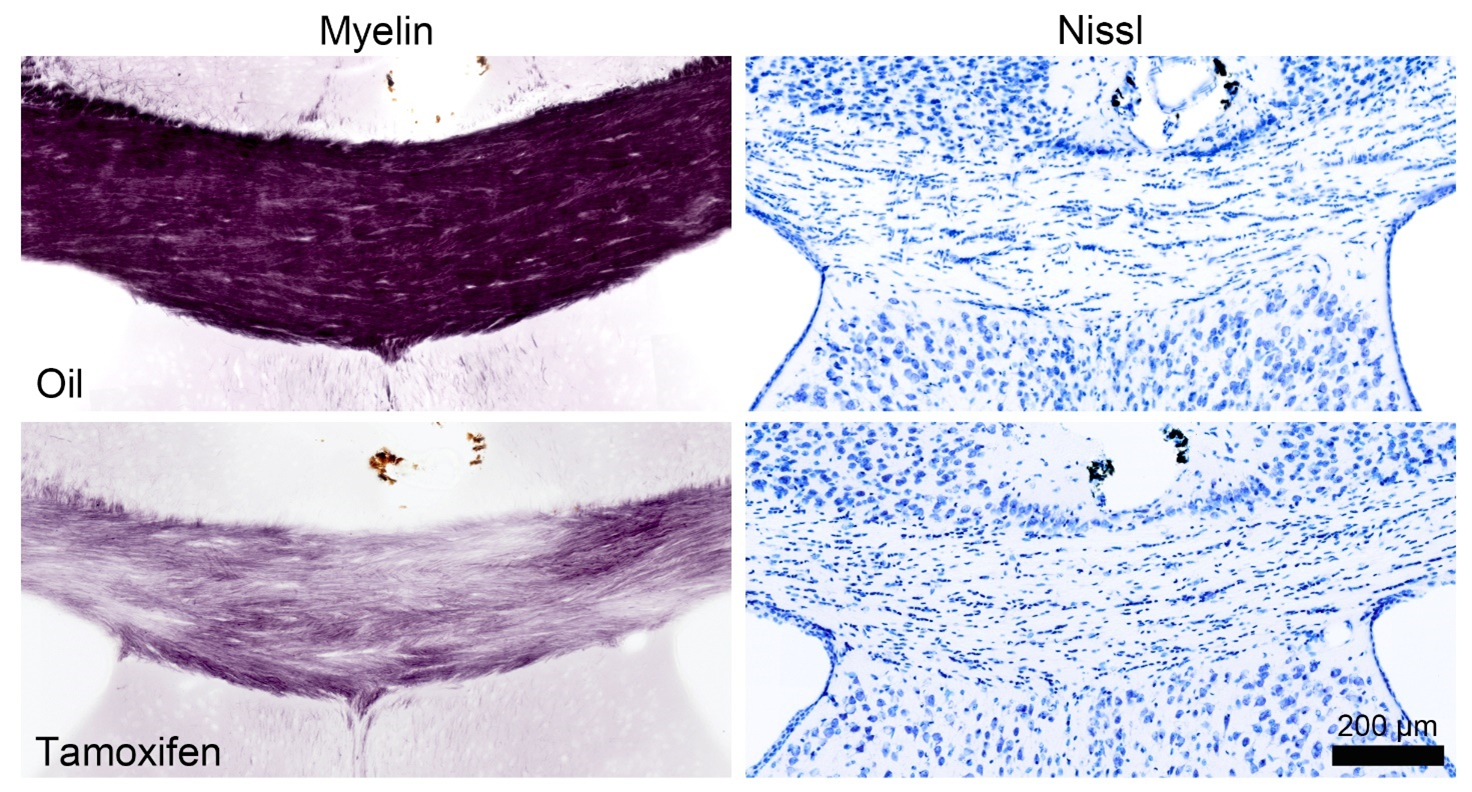
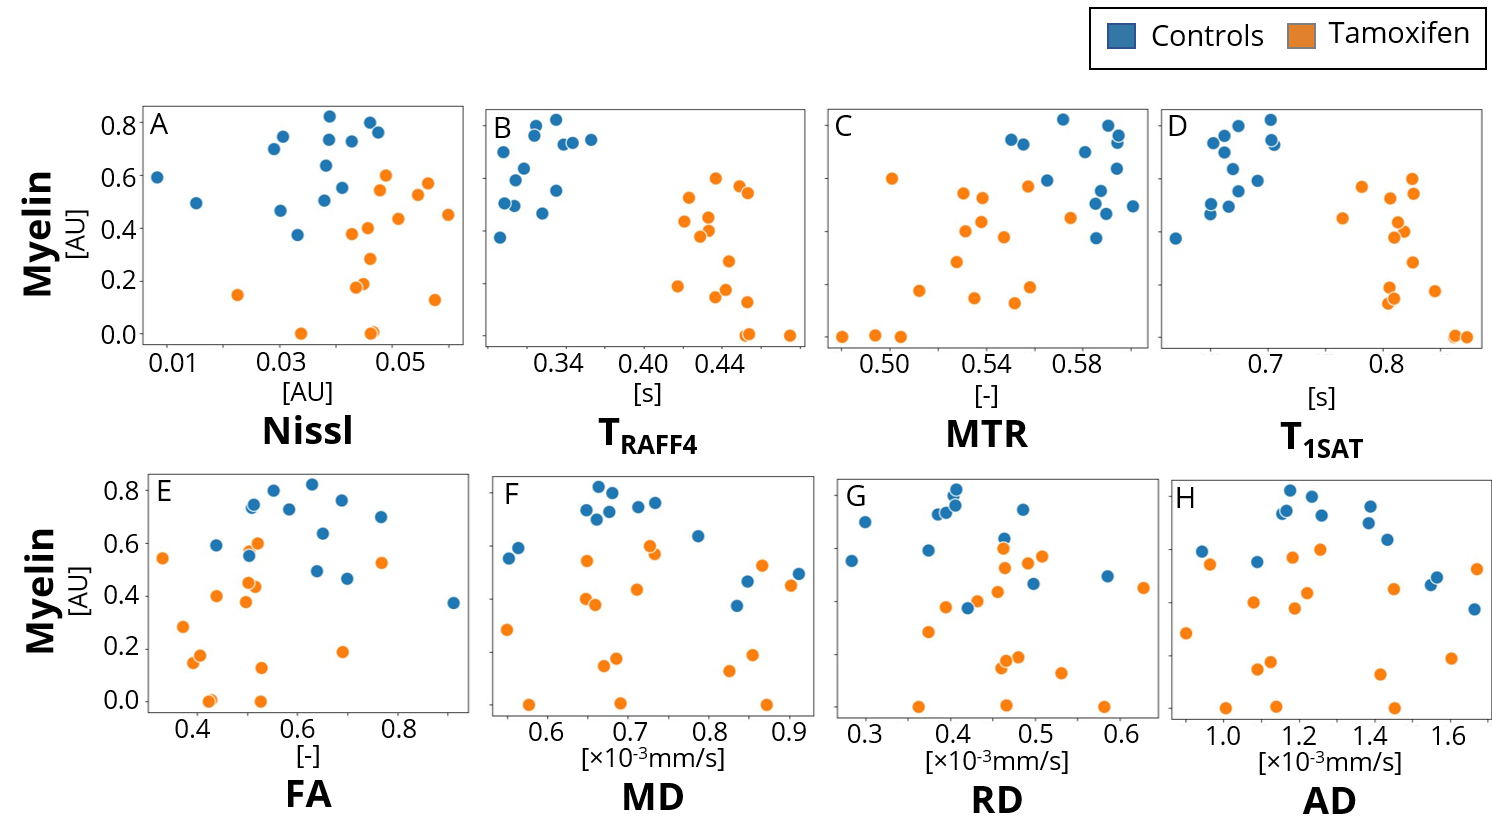
Representative TRAFF4 maps are displayed in Figure 1, which clearly show changes from baseline in the tamoxifen group and differences to the control in the corpus callosum at both post-injection timepoints. The ROI analysis (Figure 2) showed a difference between the control and tamoxifen-injected animals at 7 weeks post-injections in all MRI metrics, except for MD and RD. At the 19-week timepoint, only TRAFF4, MTR, and T1SAT showed significant differences between the groups. When comparing two consecutive timepoints, a significant difference between the baseline and 7-week timepoint was found in TRAFF4, MTR, T1SAT, and AD in the tamoxifen group. However, only TRAFF4 showed a significant difference between the 7- and 19-week timepoints during remyelination phase in the tamoxifen group.The representative histological photomicrographs of the corpus callosum in Figure 3 demonstrate the difference in myelin staining density and cell density between the groups. Although there was an apparent correlation between the histological readouts and MT and RAFF metrics when assessing the data over both groups, there was no correlation in individual groups (Figure 4).
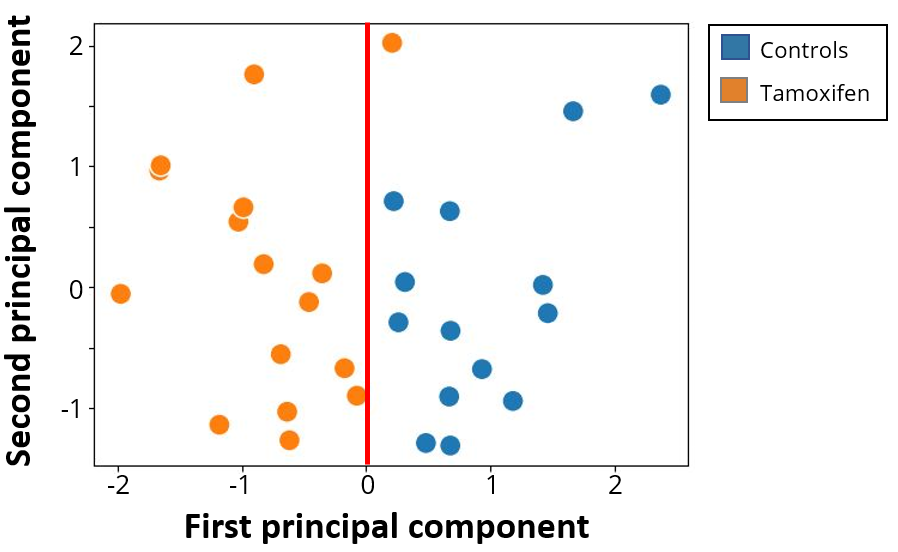
However, both TRAFF4 and T1SAT separated the animals into two groups, which correspond (apart from one outlier) with the clustering based on the PCA analysis on the myelin and Nissl density (Figure 5).
Discussion
The MT and RAFF4 parameters showed differences from the baseline at demyelination and partial recovery at remyelination, however none of the MRI metrics directly related to the myelin content. The myelination changes are accompanied by processes such as microglial activation and gliosis6,7, which have confounding effects on the MRI metrics, including also RAFF and MT under current conditions. Notably, the DTI parameters are sensitive to gliosis8, which is likely affecting our findings in DTI changes. Interestingly, T1SAT and TRAFF4 were able to separate animals into groups during remyelination and the clustering based on the PCA of the myelin and Nissl intensities corresponded to the clustering based on the TRAFF4 and T1SAT.Conclussion
Amongst the MRI metrics used here, RAFF4 showed the highest sensitivity in differentiating both (i) between the control and tamoxifen groups at each timepoint and (ii) between the stages of myelination in the tamoxifen group. Though the MTR and T1SAT showed similar behavior, neither of them detected the recovery in the tamoxifen group. Even though the precise origin of the MT and RAFF4 contrast in pathological tissue is not fully understood, both methods are sensitive to the different stages in this chronic model of widespread demyelination and remyelination.Acknowledgements
This work was supported by F. Hoffmann-La Roche Ltd and The Finnish Cultural Foundation (grant no. 00230292).References
1. Noseworthy, J. H., Lucchinetti, C., Rodriguez, M. & Weinshenker, B. G. Multiple sclerosis. N Engl J Med 343, 938–952 (2000).
2. Liimatainen, T. et al. MRI contrasts in high rank rotating frames. Magn Reson Med 73, 254–262 (2015).
3. Holikova, K. et al. RAFF-4, Magnetization Transfer and Diffusion Tensor MRI of Lysophosphatidylcholine Induced Demyelination and Remyelination in Rats. Front Neurosci 15, (2021).
4. Hakkarainen, H. et al. MRI relaxation in the presence of fictitious fields correlates with myelin content in normal rat brain. Magn Reson Med 75, 161–168 (2016).
5. Filip, P. et al. Rotating frame MRI relaxations as markers of diffuse white matter abnormalities in multiple sclerosis. Neuroimage Clin 26, (2020).
6. Hartley, M. D. et al. Myelin repair stimulated by CNS-selective thyroid hormone action. JCI Insight 4, (2019).
7. Koenning, M. et al. Myelin gene regulatory factor is required for maintenance of myelin and mature oligodendrocyte identity in the adult CNS. J Neurosci 32, 12528–12542 (2012).
8. Budde, M. D., Janes, L., Gold, E., Turtzo, L. C. & Frank, J. A. The contribution of gliosis to diffusion tensor anisotropy and tractography following traumatic brain injury: validation in the rat using Fourier analysis of stained tissue sections. Brain 134, 2248–2260 (2011).
Figures