0973
Common patterns of gray matter volume reduction and the genetic association in multiple sclerosis and Alzheimer's disease1Department of Radiology and Tianjin Key Laboratory of Functional Imaging, Tianjin Medical University General Hospital, Tianjin, China, Tianjin, China, 2MR Research Collaboration; Siemens Healthcare, Beijing, China, Beijing, China, 3Multimodality Preclinical Molecular Imaging Center, Tianjin Medical University General Hospital, Tianjin, China, Tianjin, China
Synopsis
Keywords: Multiple Sclerosis, fMRI
Motivation: Both Alzheimer’s disease (AD) and multiple sclerosis (MS) patients exhibit brain atrophy driven cognitive impairment.
Goal(s): To identify the specific and common regions in GMV reduction in AD and MS and genetic basis associated with volume changes.
Approach: VBM meta-analyses and conjunction analyses were performed for comparison. GMV associated gene expression data were extracted from Allen Human Brain Atlas by cross-sample partial least squares regression.
Results: MS patients have reduced thalamic volume, while AD have hippocampal atrophy. Both MS and AD patients exhibit medial temporal lobe atrophy patterns, which were associated with 843 genes in functioning at biological processes, neurons, and immune cells.
Impact: MS and AD patients have specific and common patterns of gray matter volume reduction, given a neuroimage clue that the ageing population present with similar symptoms of cognitive impairment.
Introduction
Extensive gray matter volume (GMV) reduction has been reported in Multiple sclerosis (MS) and Alzheimer' s disease (AD) patients, accounting for cognitive decline [1-7], which may offer a good standpoint in understanding the shared mechanisms between these two diseases. Over the past decade, several genetic loci implicated with MS and AD susceptibility have gradually emerged from previous large-scale genome-wide association studies (GWAS) [8, 9], and a possible link between MS and AD has been explored in a single variant [10]. The gene-expression profiles associated with GMV alteration respectively in MS and AD have been successfully identified by transcription-neuroimaging approach, which as a specific biological drivers might underlie more potential clinical and neurobiological mechanisms in MS and AD[11, 12]. Whereas, the genes associated with common patterns of GMV reduction in MS and AD remains largely unknown.Methods
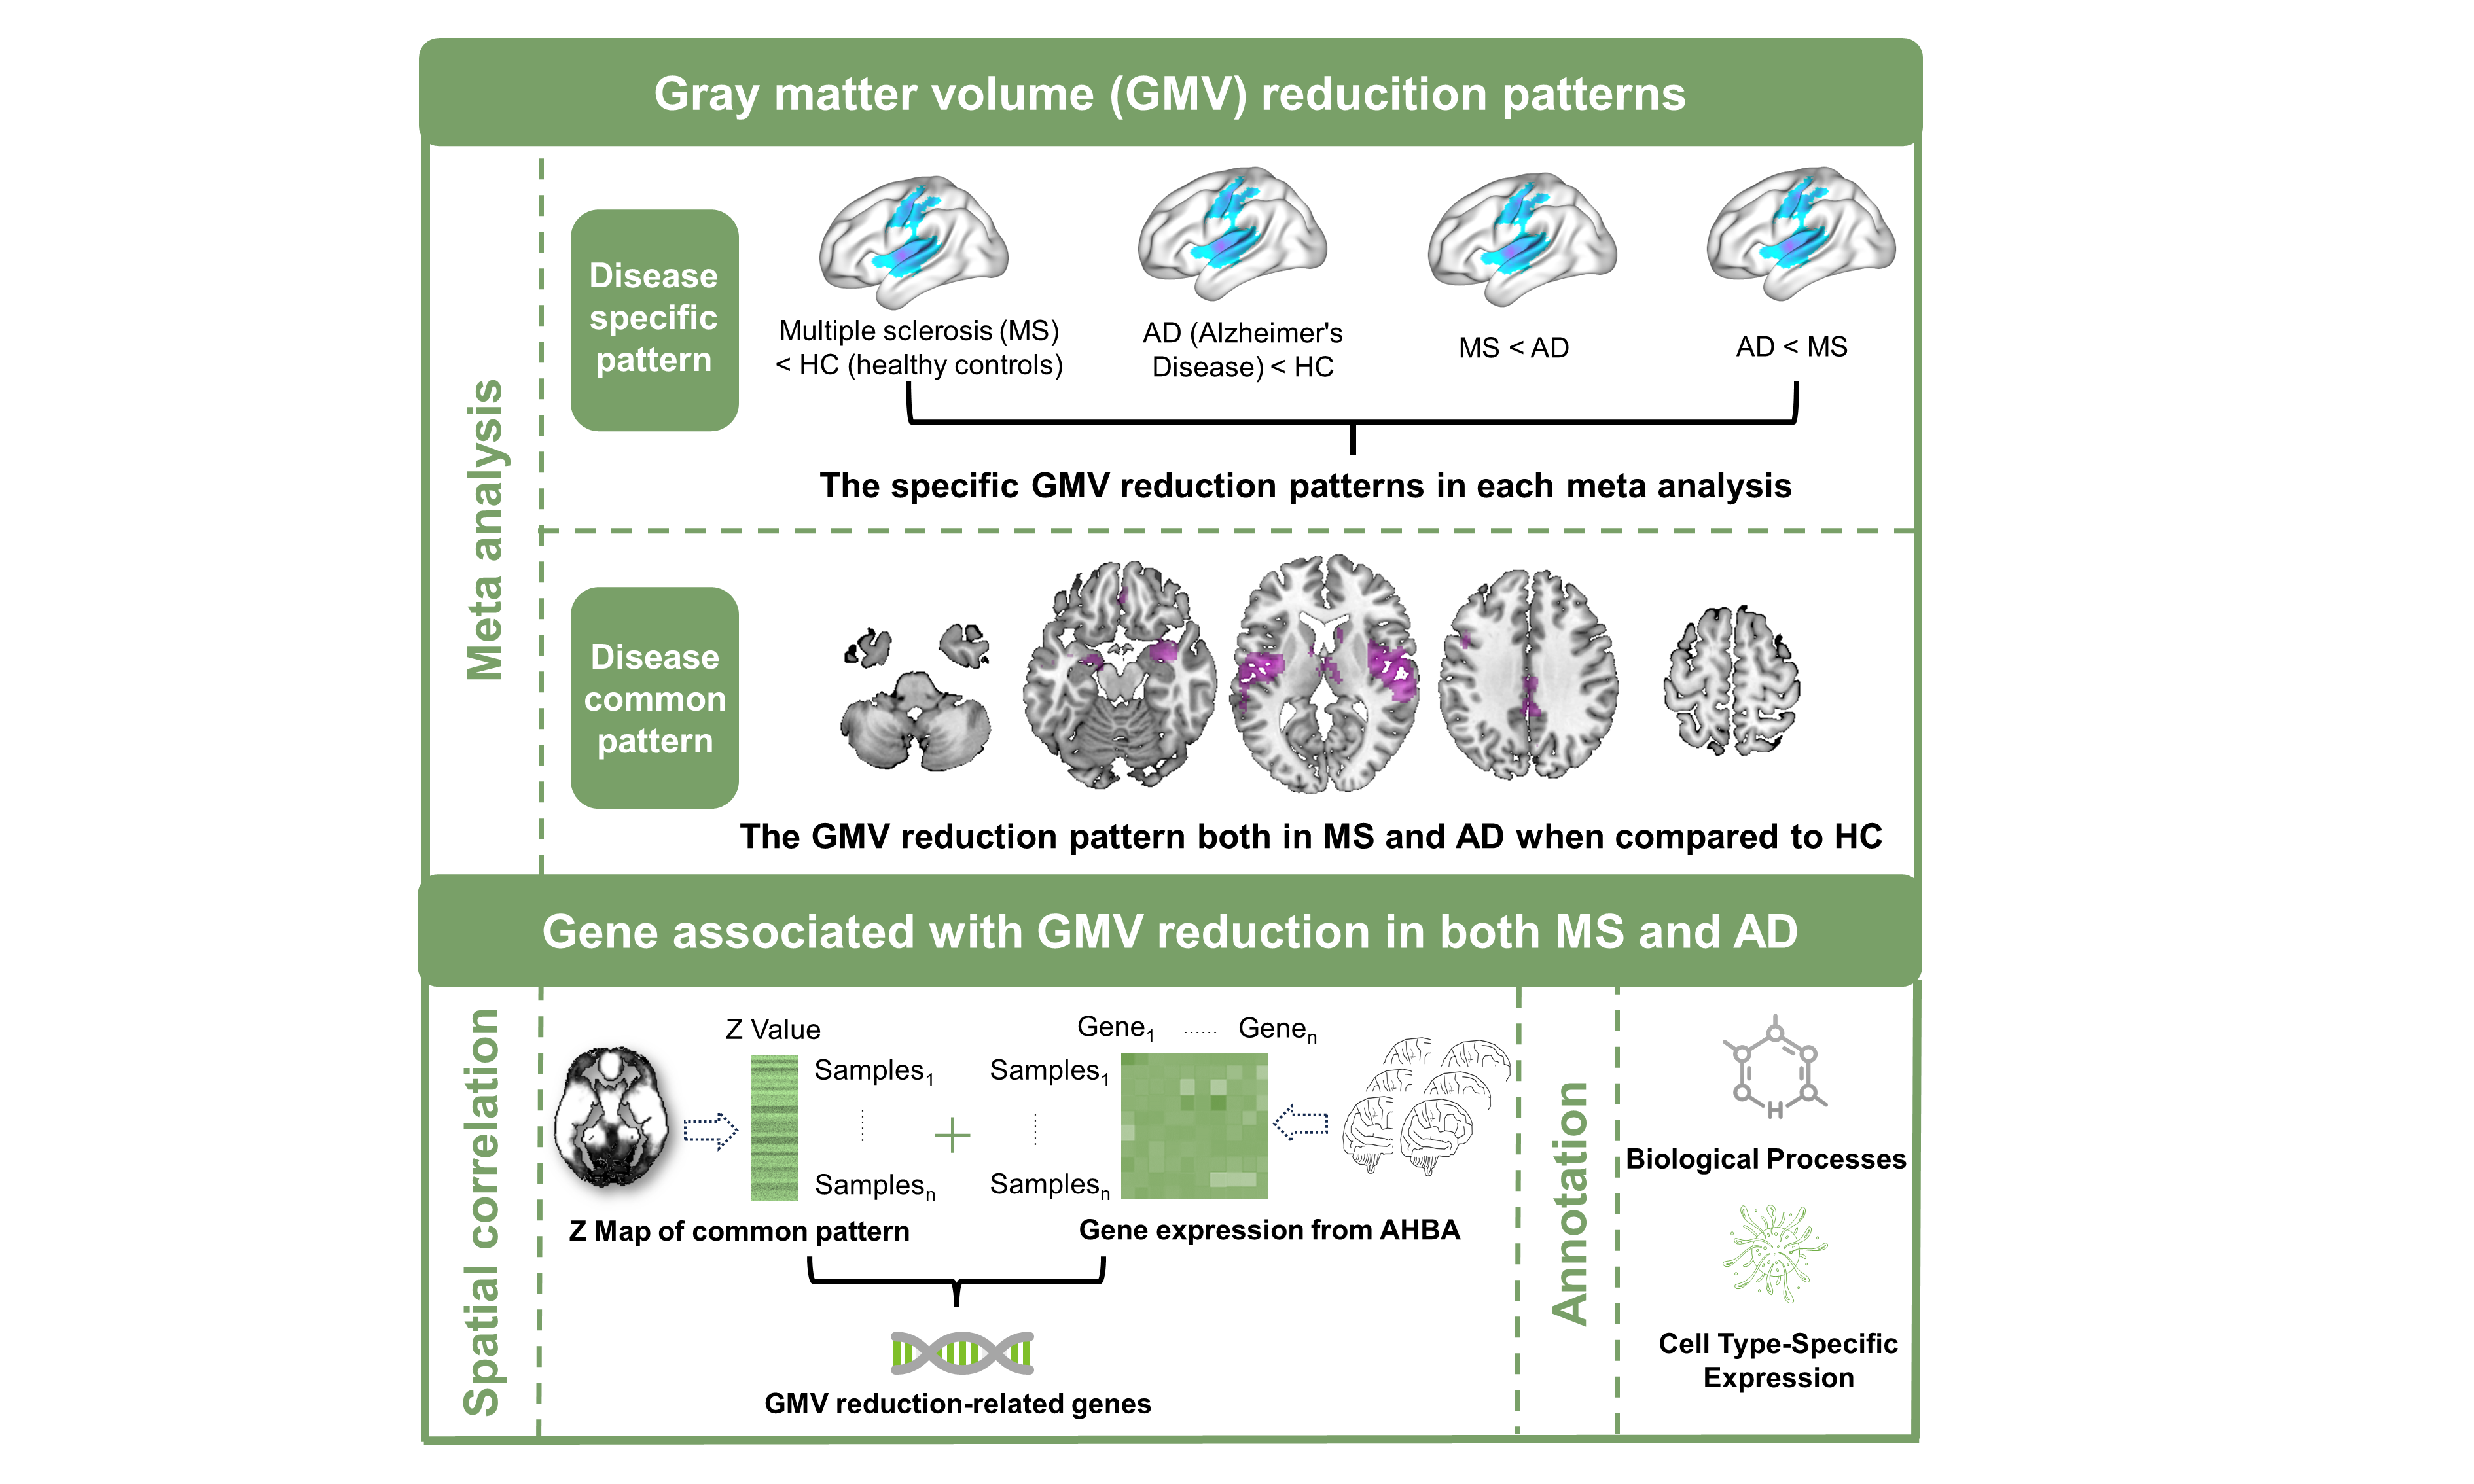
Firstly, the literature search is setup from 2001 to 2023 on PubMed. We performed four major meta-analyses for GMV changes in 1964 MS patients and 1606 healthy controls (HC), and 1508 AD patients and 1903 HCs, by Seed-based d Mapping (SDM) tools, including: 1) MS versus HC, 2) AD versus HC, 3) MS versus AD, 4) conjunction analysis ((MS versus HC) and (AD versus HC)). Secondly, we performed a correlation between the conjunctional Z map of GMV reduction in MS and AD, and brain activation patterns of each neural cognitive term via the Neurosynth, a well-validated and publicly accessible platform for functional neuroimaging literature meta-analysis [13]. Thirdly, we used partial least squares regression (PLSR) to explore the cross-sample spatial correlations between conjunctional Z map and the preprocessed gene expression data extracted from the Allen Human Brain Atlas (AHBA) [14-18]. Then the only significant genes were utilized for the following analyses. Fourthly, we identified the biological processes (BPs) functional annotations of significant genes by gene category enrichment analysis (GCEA) toolbox. Lastly, we conducted cell types and regions specific expression analyses using online cell type-specific expression analysis (CSEA) tools [19]. The workflow of VBM meta-analyses and the genetic association of reduced GMV is shown in Figure 1.Results
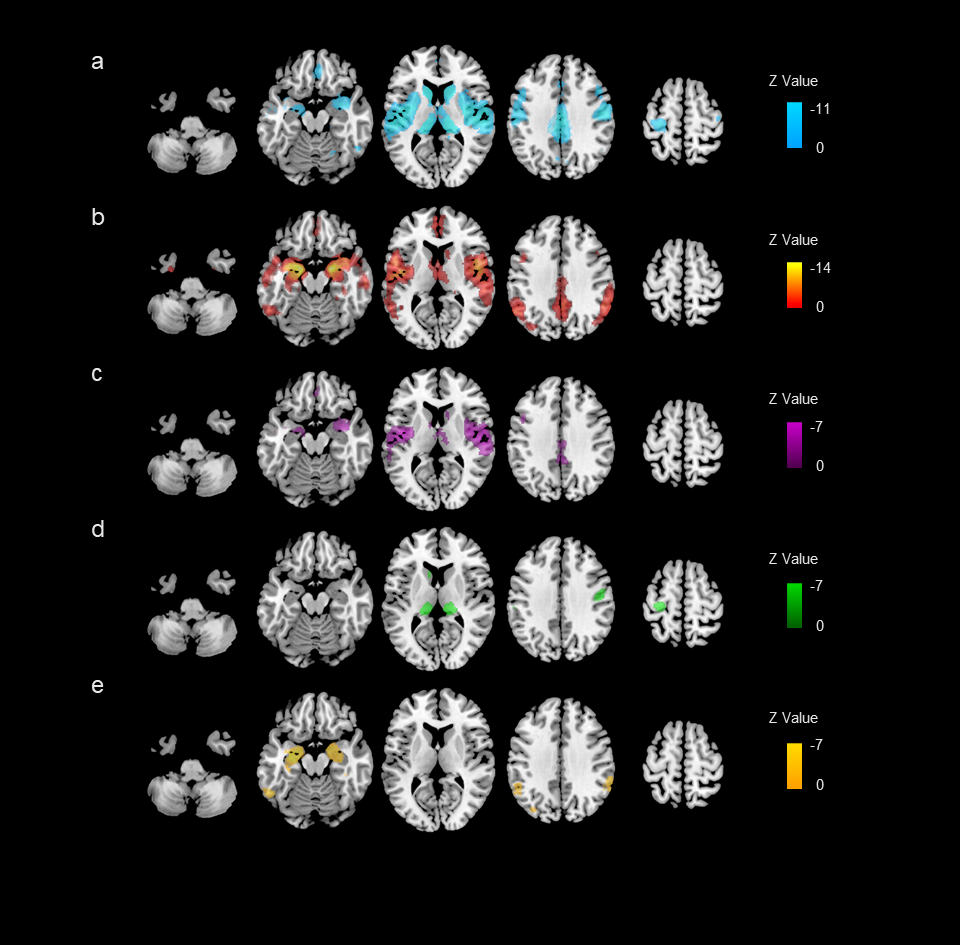
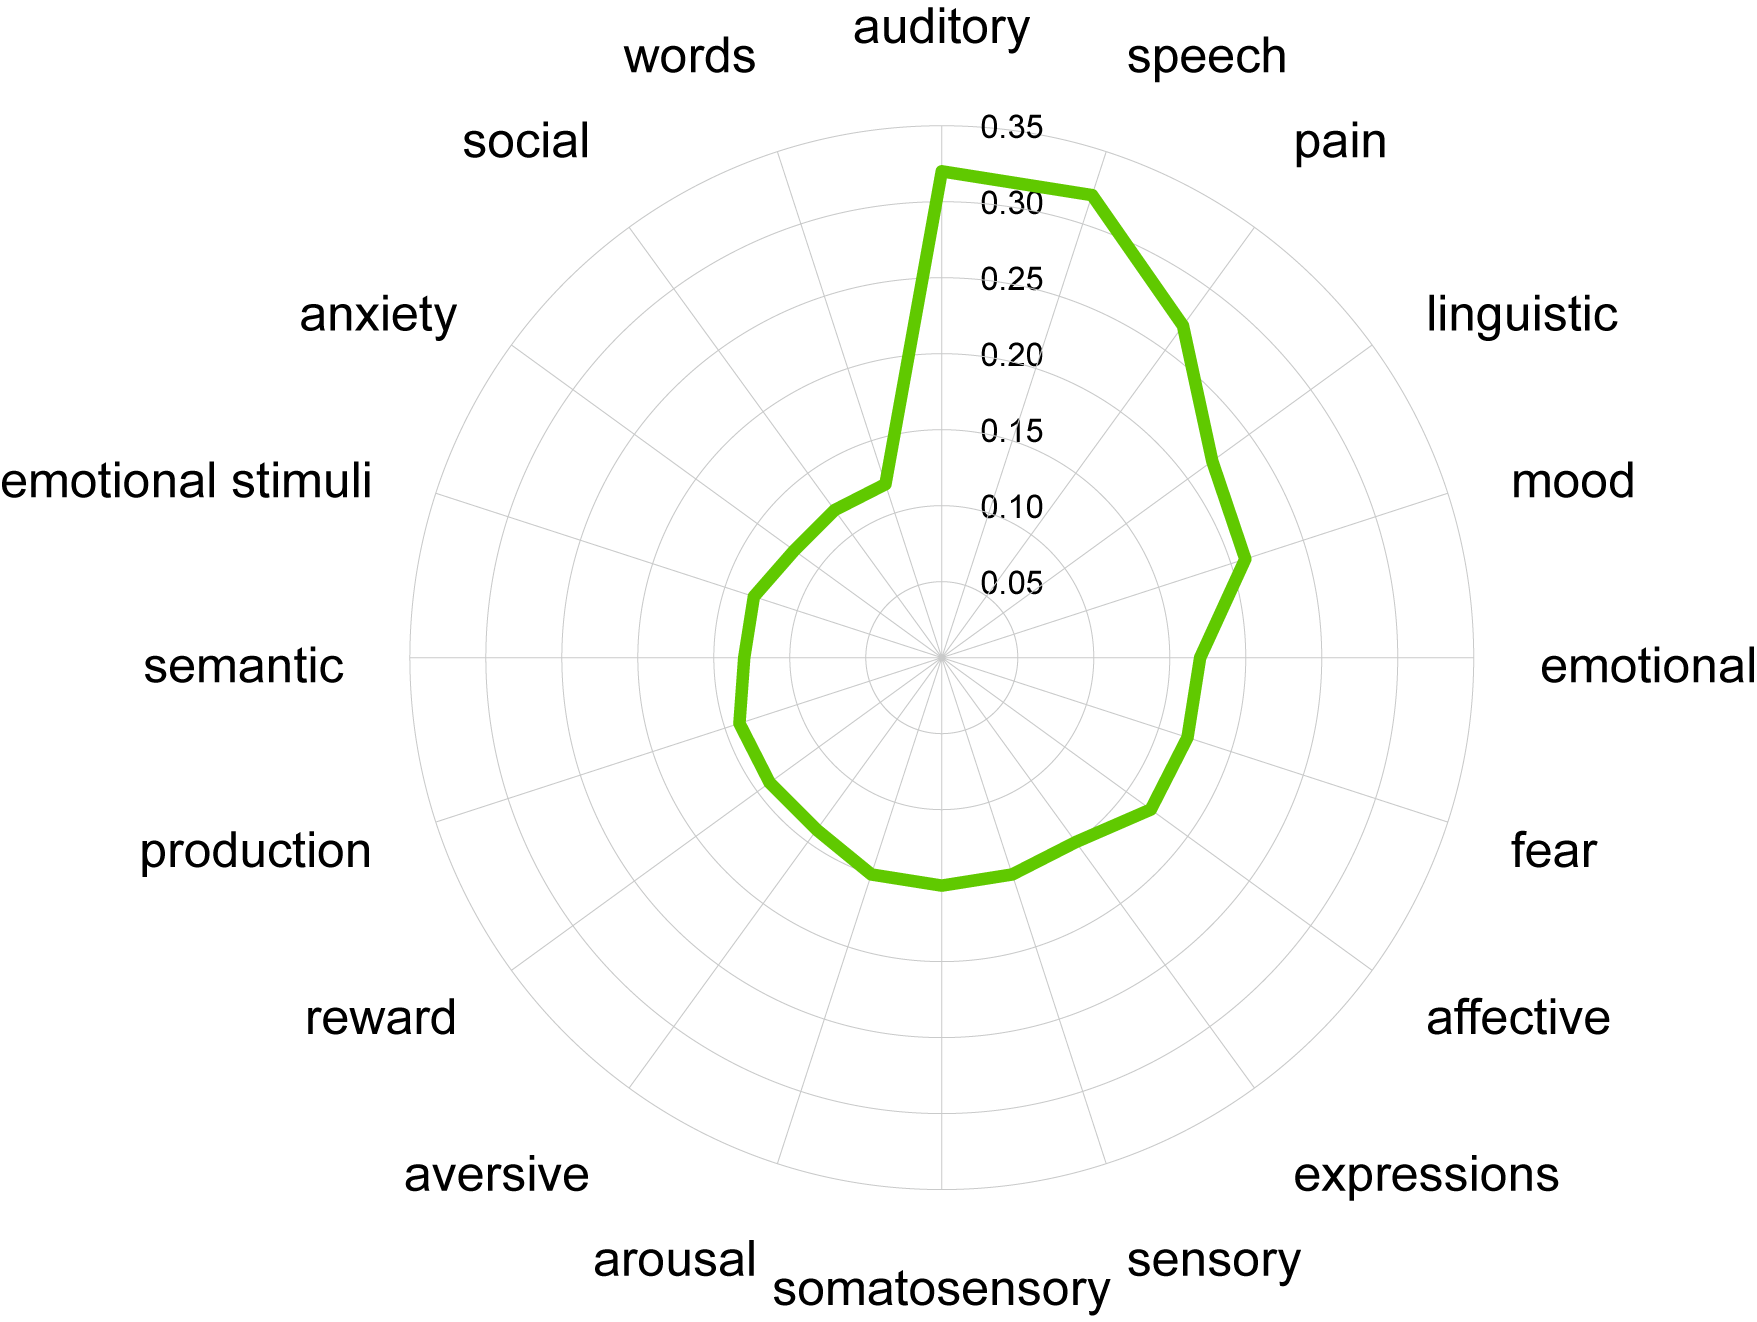
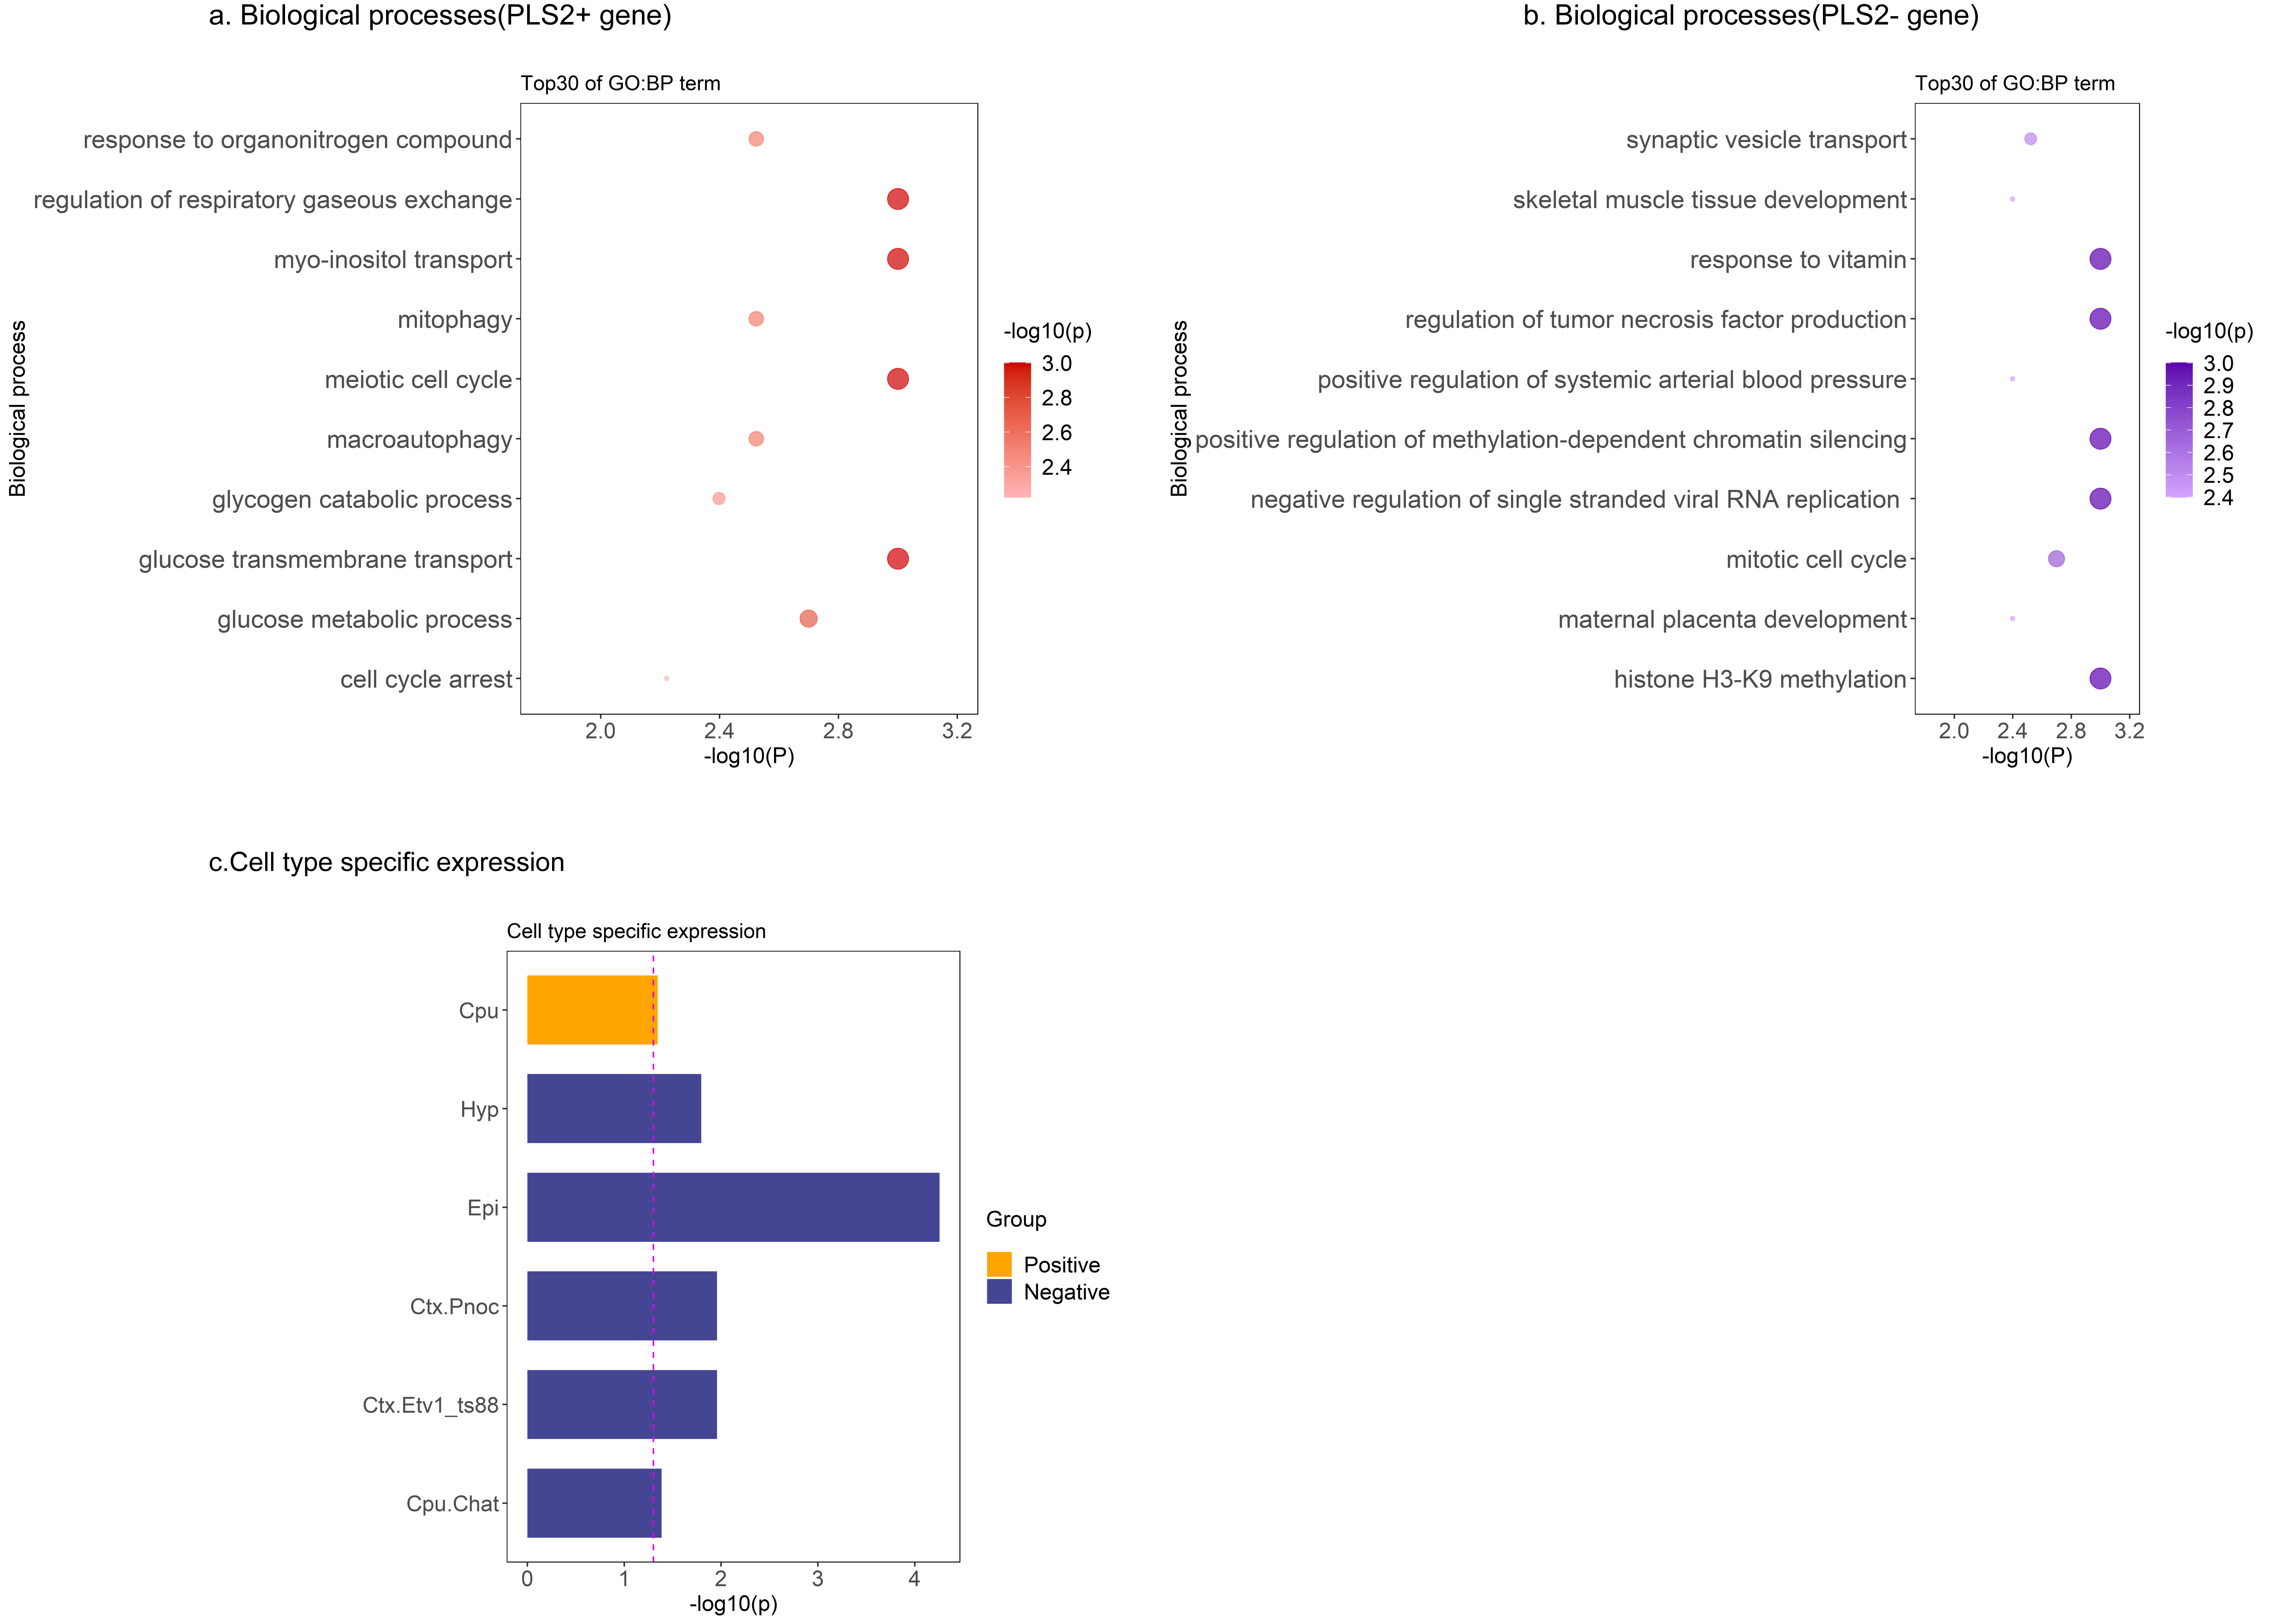
Disease-pattern of GMV reduction have been reported affecting localized brain regions from meta-analyses. The most atrophy region is right precentral gyrus for MS patients, while right parahippocampal gyrus for AD patients. Conjunctional analysis identified several regions where GMV reduced in both MS and AD patients, especially in right superior temporal gyrus (Figure 2). The common GMV reduction patterns were found associated with the brain activation patterns of multiple cognitive terms, especially the auditory- and speech- related function (Figure 3). Then, we identified 843 genes of which brain spatial expression profiles were significantly associated with common patterns of GMV reduction in MS and AD. We ranked the standardized weights of genes in second component (PLS2) identified them into two sets: positive set including 290 genes (PLS2 +; Z-scores > 0); negative set including 544 genes (PLS2 -; Z-scores < 0). For the positive set, genes showed significant functional enrichment in 89 terms of BPs (P < 0.05), mainly in transport of myo-inositol, glucose transmembrane, regulation of acute inflammatory response to antigenic stimulus and DNA damage checkpoint (Figure 4a); and significantly expressed in striatum (Cpu) (Pc < 0.05, Bonferroni corrected; Figure 4c). For the negative set, genes were significantly enriched for 101 terms of BPs, mainly in regulation of tumor necrosis factor production, response to vitamin, negative regulation of single stranded viral RNA replication and synaptic vesicle transport (Figure 4b); and specifically expressed in type of immune cells (Ctx.Etv1_ts88), Pnoc+ neurons of cortex (Ctx.Pnoc), Hypothalamus (Hyp) and Habenula (EPI) (Pc < 0.05; Figure 4c).Discussion and Conclusion
This is a new attempt to identify genes associated with common patterns of GMV reduction in MS and AD by using the transcription-neuroimaging association approach. Our findings might offer insights into the underlying shared neurobiological mechanisms through GMV reduction and cognitive decline in MS and AD.Acknowledgements
This work was supported by the National Natural Science Foundation of China (82071907, 82302139, 81301217, 81301202); Wu Jieping Medical Foundation-Special Fund for Clinical Research (320.6750.2022-3‑5); Tianjin Key Medical Discipline (Specialty) Construction Project (TJYXZDXK‑001A).References
1. Zivadinov R, Jakimovski D, Gandhi S, Ahmed R, Dwyer MG, Horakova D, Weinstock-Guttman B, Benedict RR, Vaneckova M, Barnett M et al: Clinical relevance of brain atrophy assessment in multiple sclerosis. Implications for its use in a clinical routine. Expert review of neurotherapeutics 2016, 16(7):777-793.
2. Mandolesi G, Gentile A, Musella A, Fresegna D, De Vito F, Bullitta S, Sepman H, Marfia GA, Centonze D: Synaptopathy connects inflammation and neurodegeneration in multiple sclerosis. Nature reviews Neurology 2015, 11(12):711-724.
3. Rogalski E, Sridhar J, Rader B, Martersteck A, Chen K, Cobia D, Thompson CK, Weintraub S, Bigio EH, Mesulam MM: Aphasic variant of Alzheimer disease: Clinical, anatomic, and genetic features. Neurology 2016, 87(13):1337-1343.
4. Fisniku LK, Chard DT, Jackson JS, Anderson VM, Altmann DR, Miszkiel KA, Thompson AJ, Miller DH: Gray matter atrophy is related to long-term disability in multiple sclerosis. Annals of neurology 2008, 64(3):247-254.
5. Filippi M, Preziosa P, Copetti M, Riccitelli G, Horsfield MA, Martinelli V, Comi G, Rocca MA: Gray matter damage predicts the accumulation of disability 13 years later in MS. Neurology 2013, 81(20):1759-1767.
6. Reiman EM, Langbaum JB, Tariot PN: Alzheimer's prevention initiative: a proposal to evaluate presymptomatic treatments as quickly as possible. Biomarkers in medicine 2010, 4(1):3-14.
7. Phillips JS, Da Re F, Dratch L, Xie SX, Irwin DJ, McMillan CT, Vaishnavi SN, Ferrarese C, Lee EB, Shaw LM et al: Neocortical origin and progression of gray matter atrophy in nonamnestic Alzheimer's disease. Neurobiol Aging 2018, 63:75-87.
8. Multiple sclerosis genomic map implicates peripheral immune cells and microglia in susceptibility. Science (New York, NY) 2019, 365(6460).
9. Kunkle BW, Grenier-Boley B, Sims R, Bis JC, Damotte V, Naj AC, Boland A, Vronskaya M, van der Lee SJ, Amlie-Wolf A et al: Genetic meta-analysis of diagnosed Alzheimer's disease identifies new risk loci and implicates Aβ, tau, immunity and lipid processing. Nature genetics 2019, 51(3):414-430.
10. Javor J, Bucova M, Durmanova V, Radosinska D, Parnicka Z, Cierny D, Kurca E, Copikova-Cudrakova D, Gmitterova K, Shawkatova I: Alzheimer's Disease Risk Variant rs3865444 in the CD33 Gene: A Possible Role in Susceptibility to Multiple Sclerosis. Life (Basel) 2022, 12(7).
11. Sun J, Xie Y, Wang Q, Shen J, Qin W, Zhang N, Yu C: Genes associated with grey matter volume reduction in multiple sclerosis. J Neurol 2022, 269(4):2004-2015.
12. Groot C, Grothe MJ, Mukherjee S, Jelistratova I, Jansen I, van Loenhoud AC, Risacher SL, Saykin AJ, Mac Donald CL, Mez J et al: Differential patterns of gray matter volumes and associated gene expression profiles in cognitively-defined Alzheimer's disease subgroups. NeuroImage Clinical 2021, 30:102660.
13. Yarkoni T, Poldrack RA, Nichols TE, Van Essen DC, Wager TD: Large-scale automated synthesis of human functional neuroimaging data. Nature methods 2011, 8(8):665-670.
14. Hawrylycz M, Miller JA, Menon V, Feng D, Dolbeare T, Guillozet-Bongaarts AL, Jegga AG, Aronow BJ, Lee CK, Bernard A et al: Canonical genetic signatures of the adult human brain. Nature neuroscience 2015, 18(12):1832-1844.
15. Hawrylycz MJ, Lein ES, Guillozet-Bongaarts AL, Shen EH, Ng L, Miller JA, van de Lagemaat LN, Smith KA, Ebbert A, Riley ZL et al: An anatomically comprehensive atlas of the adult human brain transcriptome. Nature 2012, 489(7416):391-399.
16. Arnatkeviciute A, Fulcher BD, Fornito A: A practical guide to linking brain-wide gene expression and neuroimaging data. NeuroImage 2019, 189:353-367.
17. Abdi H, Williams LJ: Partial least squares methods: partial least squares correlation and partial least square regression. Methods in molecular biology (Clifton, NJ) 2013, 930:549-579.
18. Abdi H: Partial least squares regression and projection on latent structure regression (PLS Regression). WIREs Computational Statistics 2010, 2(1):97-106.
19. Dougherty JD, Schmidt EF, Nakajima M, Heintz N: Analytical approaches to RNA profiling data for the identification of genes enriched in specific cells. Nucleic acids research 2010, 38(13):4218-4230.
Figures