0970
Quantitative chemical exchange saturation transfer MR imaging of the substantia nigra and red nucleus in Parkinson’s disease1Department of Radiology, Beijing Hospital,National Center of Gerontology, Institute of Geriatric Medicine, Chinese Academy of Medical Sciences, Beijing, China, 2Clinical & Technique Support, Philips Healthcare, Beijing, China
Synopsis
Keywords: CEST / APT / NOE, CEST & MT, Z-spectrum fitting
Motivation: Achieving precise quantification of target molecules has been a prominent focus of chemical exchange saturation transfer (CEST) .
Goal(s): To investigate the alteration of CEST-MRI in the bilateral substantia nigra (SN) and red nucleus (RN) in Parkinson’s disease (PD) and to explore its value of clinical application.
Approach: The signal change of CEST imaging was separated using the 4-pool Lorentz fitting model. The amide, nuclear overhauser enhancement (NOE), direct water saturation (DS), and magnetization transfer (MT) value were compared between the PD and NC group.
Results: The results indicated that CEST-MR can reveal the signal alterations the SN and RN in PD patients.
Impact: CEST-MRI, utilizing the 4-pool Lorentz fitting model, was employed to accurately delineate the amide signal alterations within the SN and RN of patients with PD. This approach demonstrates significant promise for enhancing the clinical diagnosis of PD.
Introduction
Parkinson's disease (PD) is a common progressive neurodegenerative disease marked by the degeneration of dopaminergic neurons in the substantia nigra. Detecting PD in its early stages would enable timely intervention, potentially enhancing the prognosis for individuals with PD. Therefore, it is imperative to explore innovative and dependable approaches for diagnosing PD and assessing its severity. Achieving precise quantification of target molecules has been a prominent focus of chemical exchange saturation transfer (CEST)1. The objective of this study was to investigate the alterations of CEST-MRI within the bilateral substantia nigra (SN) and red nucleus (RN) in PD patients, and to assess the value of CEST-MRI for the clinical application of PD.Methods
In this retrospective study, 45 PD patients and 21 gender-, age- and education-level matched normal control (NC) subjects were enrolled from December 2012 to July 20152. All participants signed an informed consent form before the examination. The CEST-MRI examination of the brain and the routine MR sequence were performed in a 3T magnetic resonance imaging scanner (Achieva 3T; Philips Medical Systems, Best, The Netherlands) using an eight-channel sensitivity encoding coil. The slice with the maximum cross-sectional level of SN and RN on the FLAIR images was selected and CEST images of the same slice were acquired. The parameters of CEST imaging sequence were as follows: repetition time = 3,000 ms; turbo-spin-echo factor = 54; field of view = 230 × 221 mm; matrix = 105 × 100; slice thickness = 6 mm. A pseudo-continuous wave RF irradiation (saturation duration = 200 ms × 4; inter-pulse delay, 10 ms; power level = 2 μT) and a multi-offset, multi-acquisition CEST imaging protocol were used. The 31 offsets were 0, ±0.25, ±0.5, ±0.75, ±1 (2), ±1.5 (2), ±2 (2), ±2.5 (2), ±3 (2), ±3.25 (2), ±3.5 (8), ±3.75 (2), ±4 (2), ±4.5, ±5, ±6 ppm (the values in parentheses represented the number of acquisitions, which was 1, if not specified). The acquisition time of the CEST/APT image scan was about 3min 12s. Based on the MATLAB software package, the signal change of CEST imaging was separated using the 4-pool Lorentz fitting model3,4,5. The regions of interest of the SN and RN were delineated by experienced radiologists. Then the mean amplitudes of the 4 pools including amide, nuclear overhauser enhancement (NOE), direct water saturation (DS), and magnetization transfer (MT) were calculated4. The independent samples t-test and Mann-Whitney U-test were used to compare the amplitude of each pool between the PD group and NC group, and the results were controlled by Bonferroni correction. The combined model was constructed by binary logistic regression analysis, and the receiver operating characteristic curve was used to evaluate the diagnostic efficiency of the 4 pool-CEST parameters and the combined model.Results
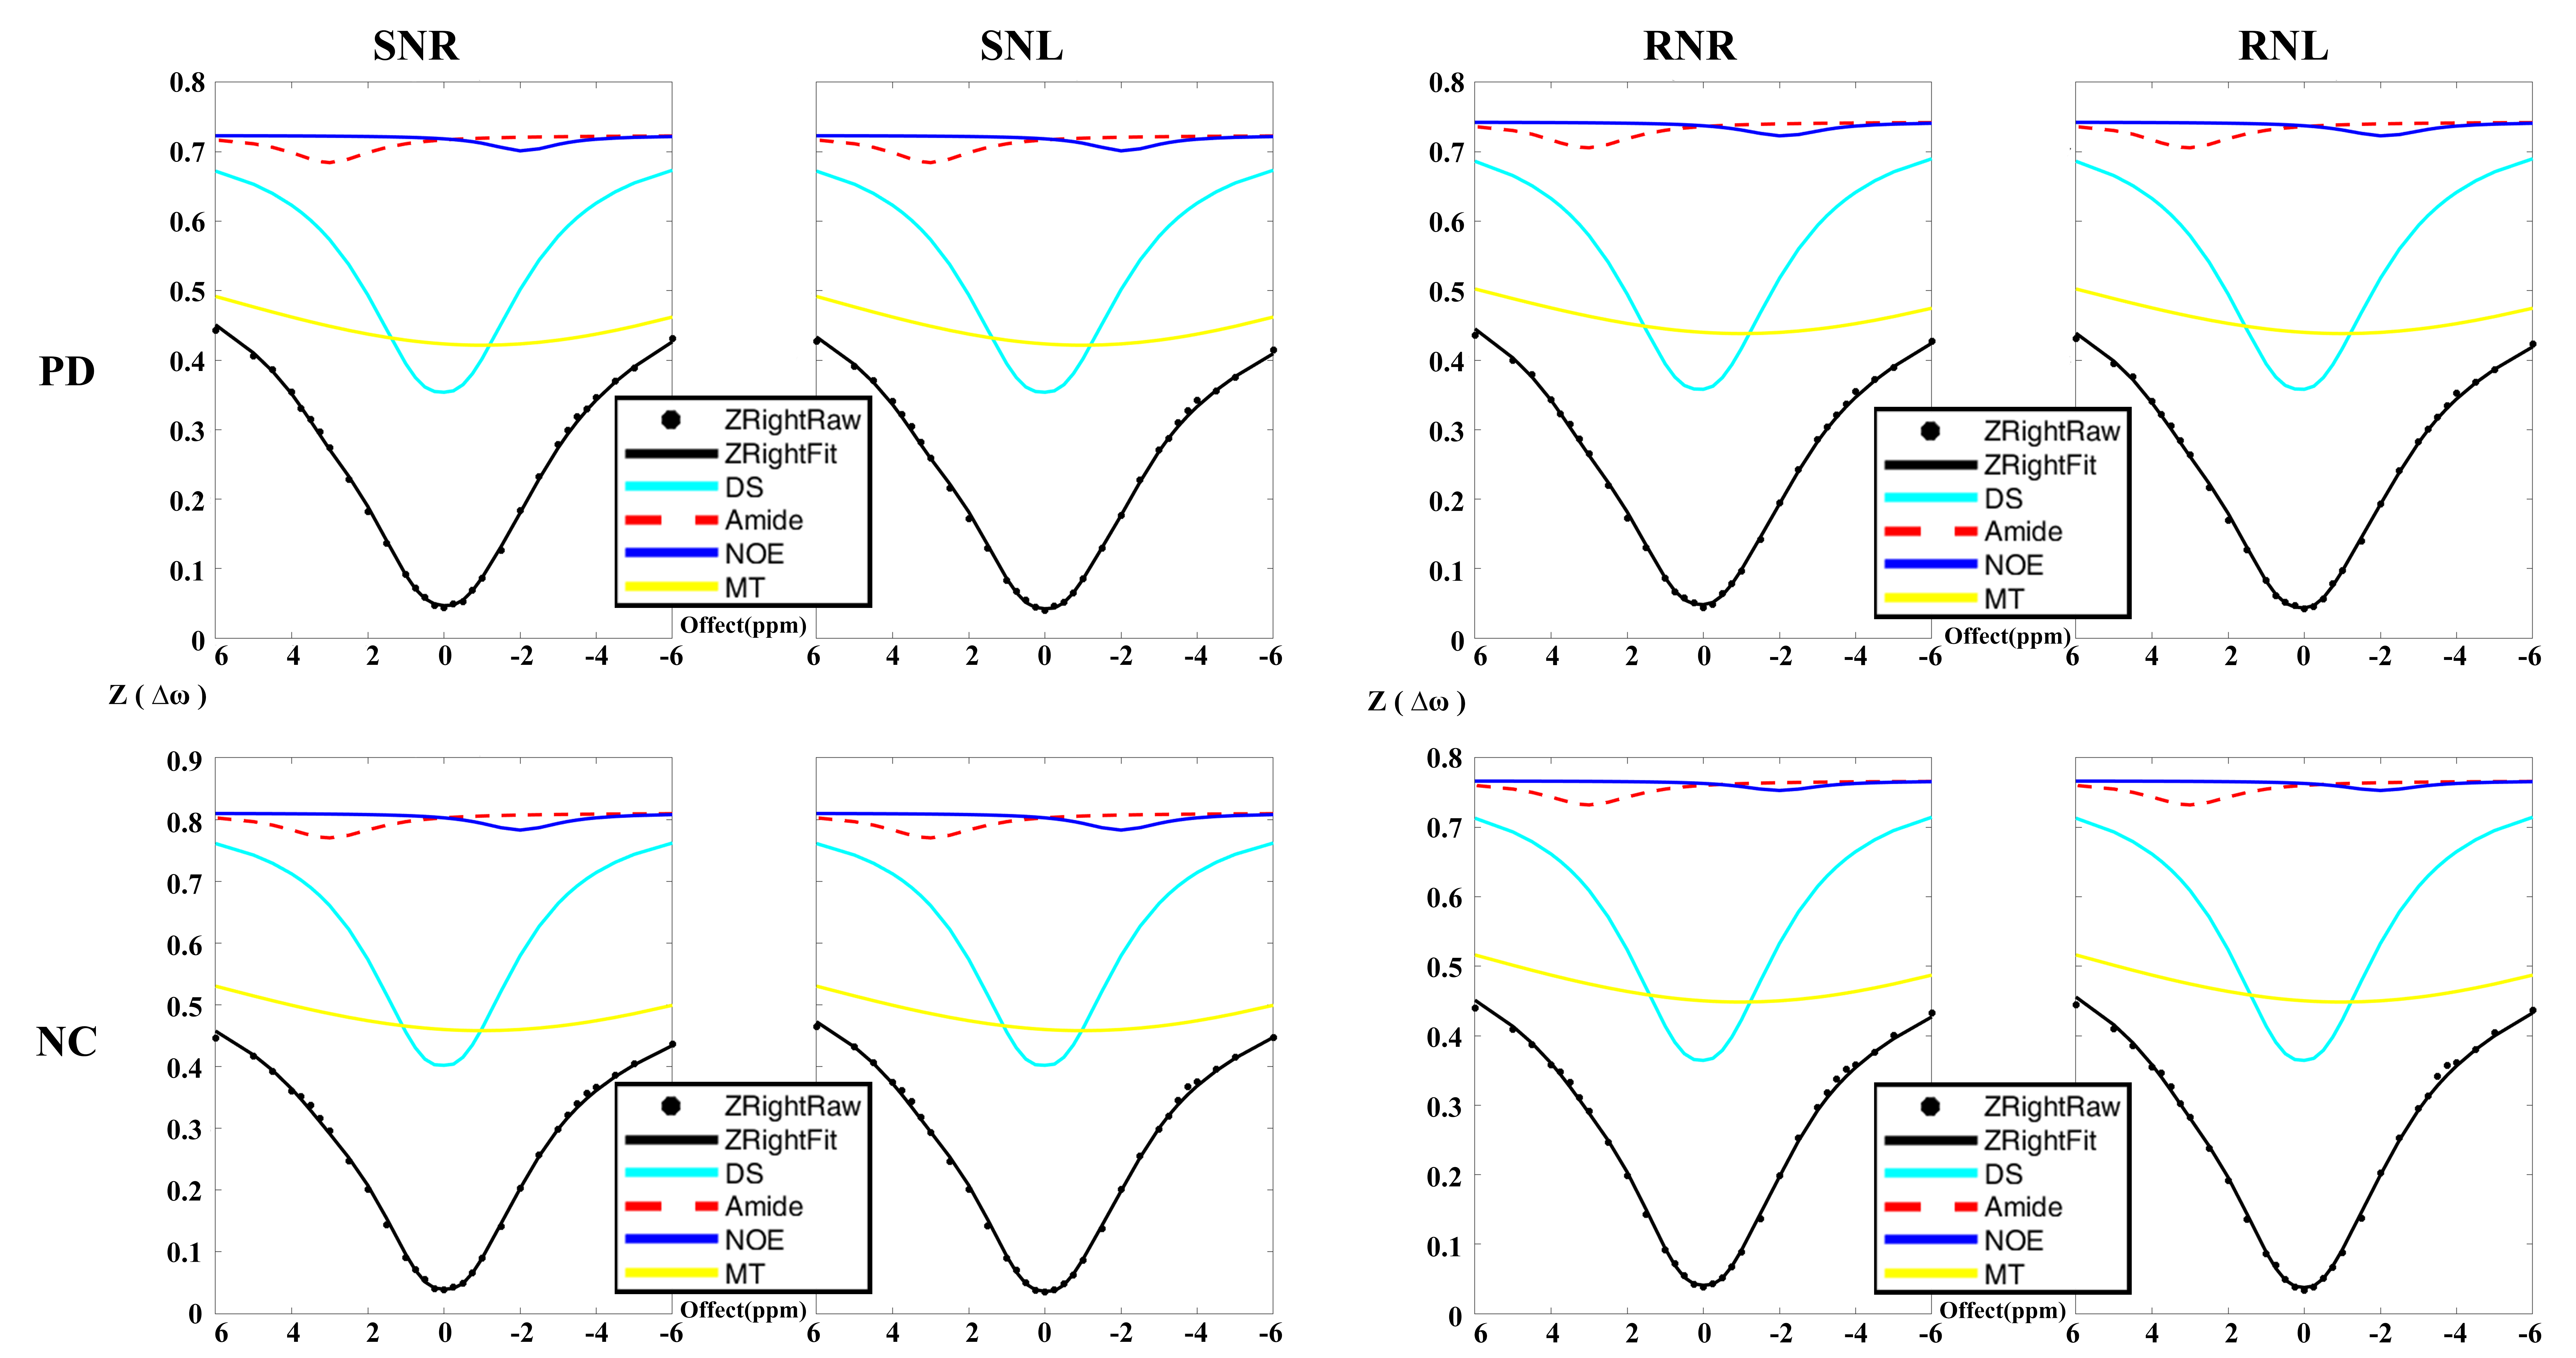
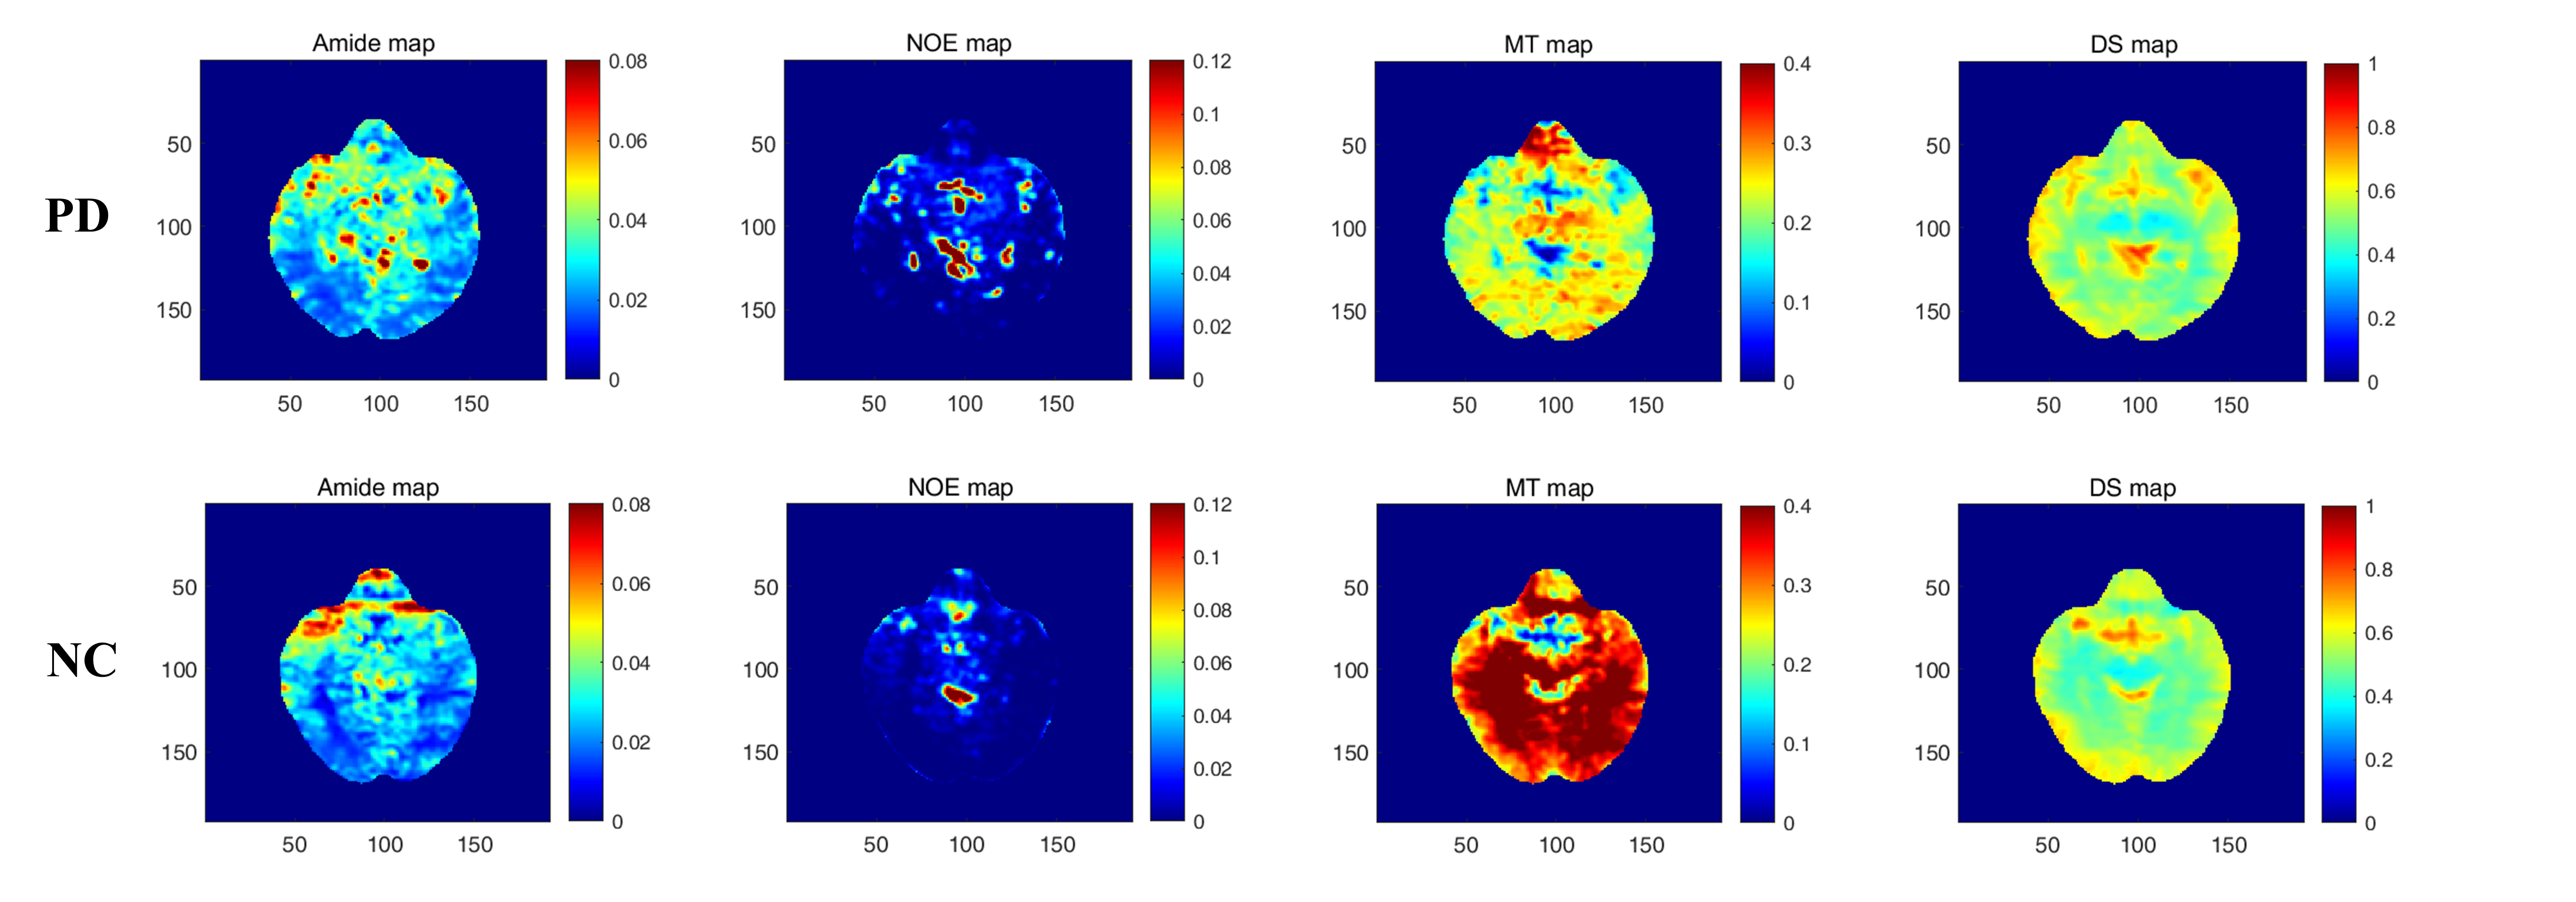
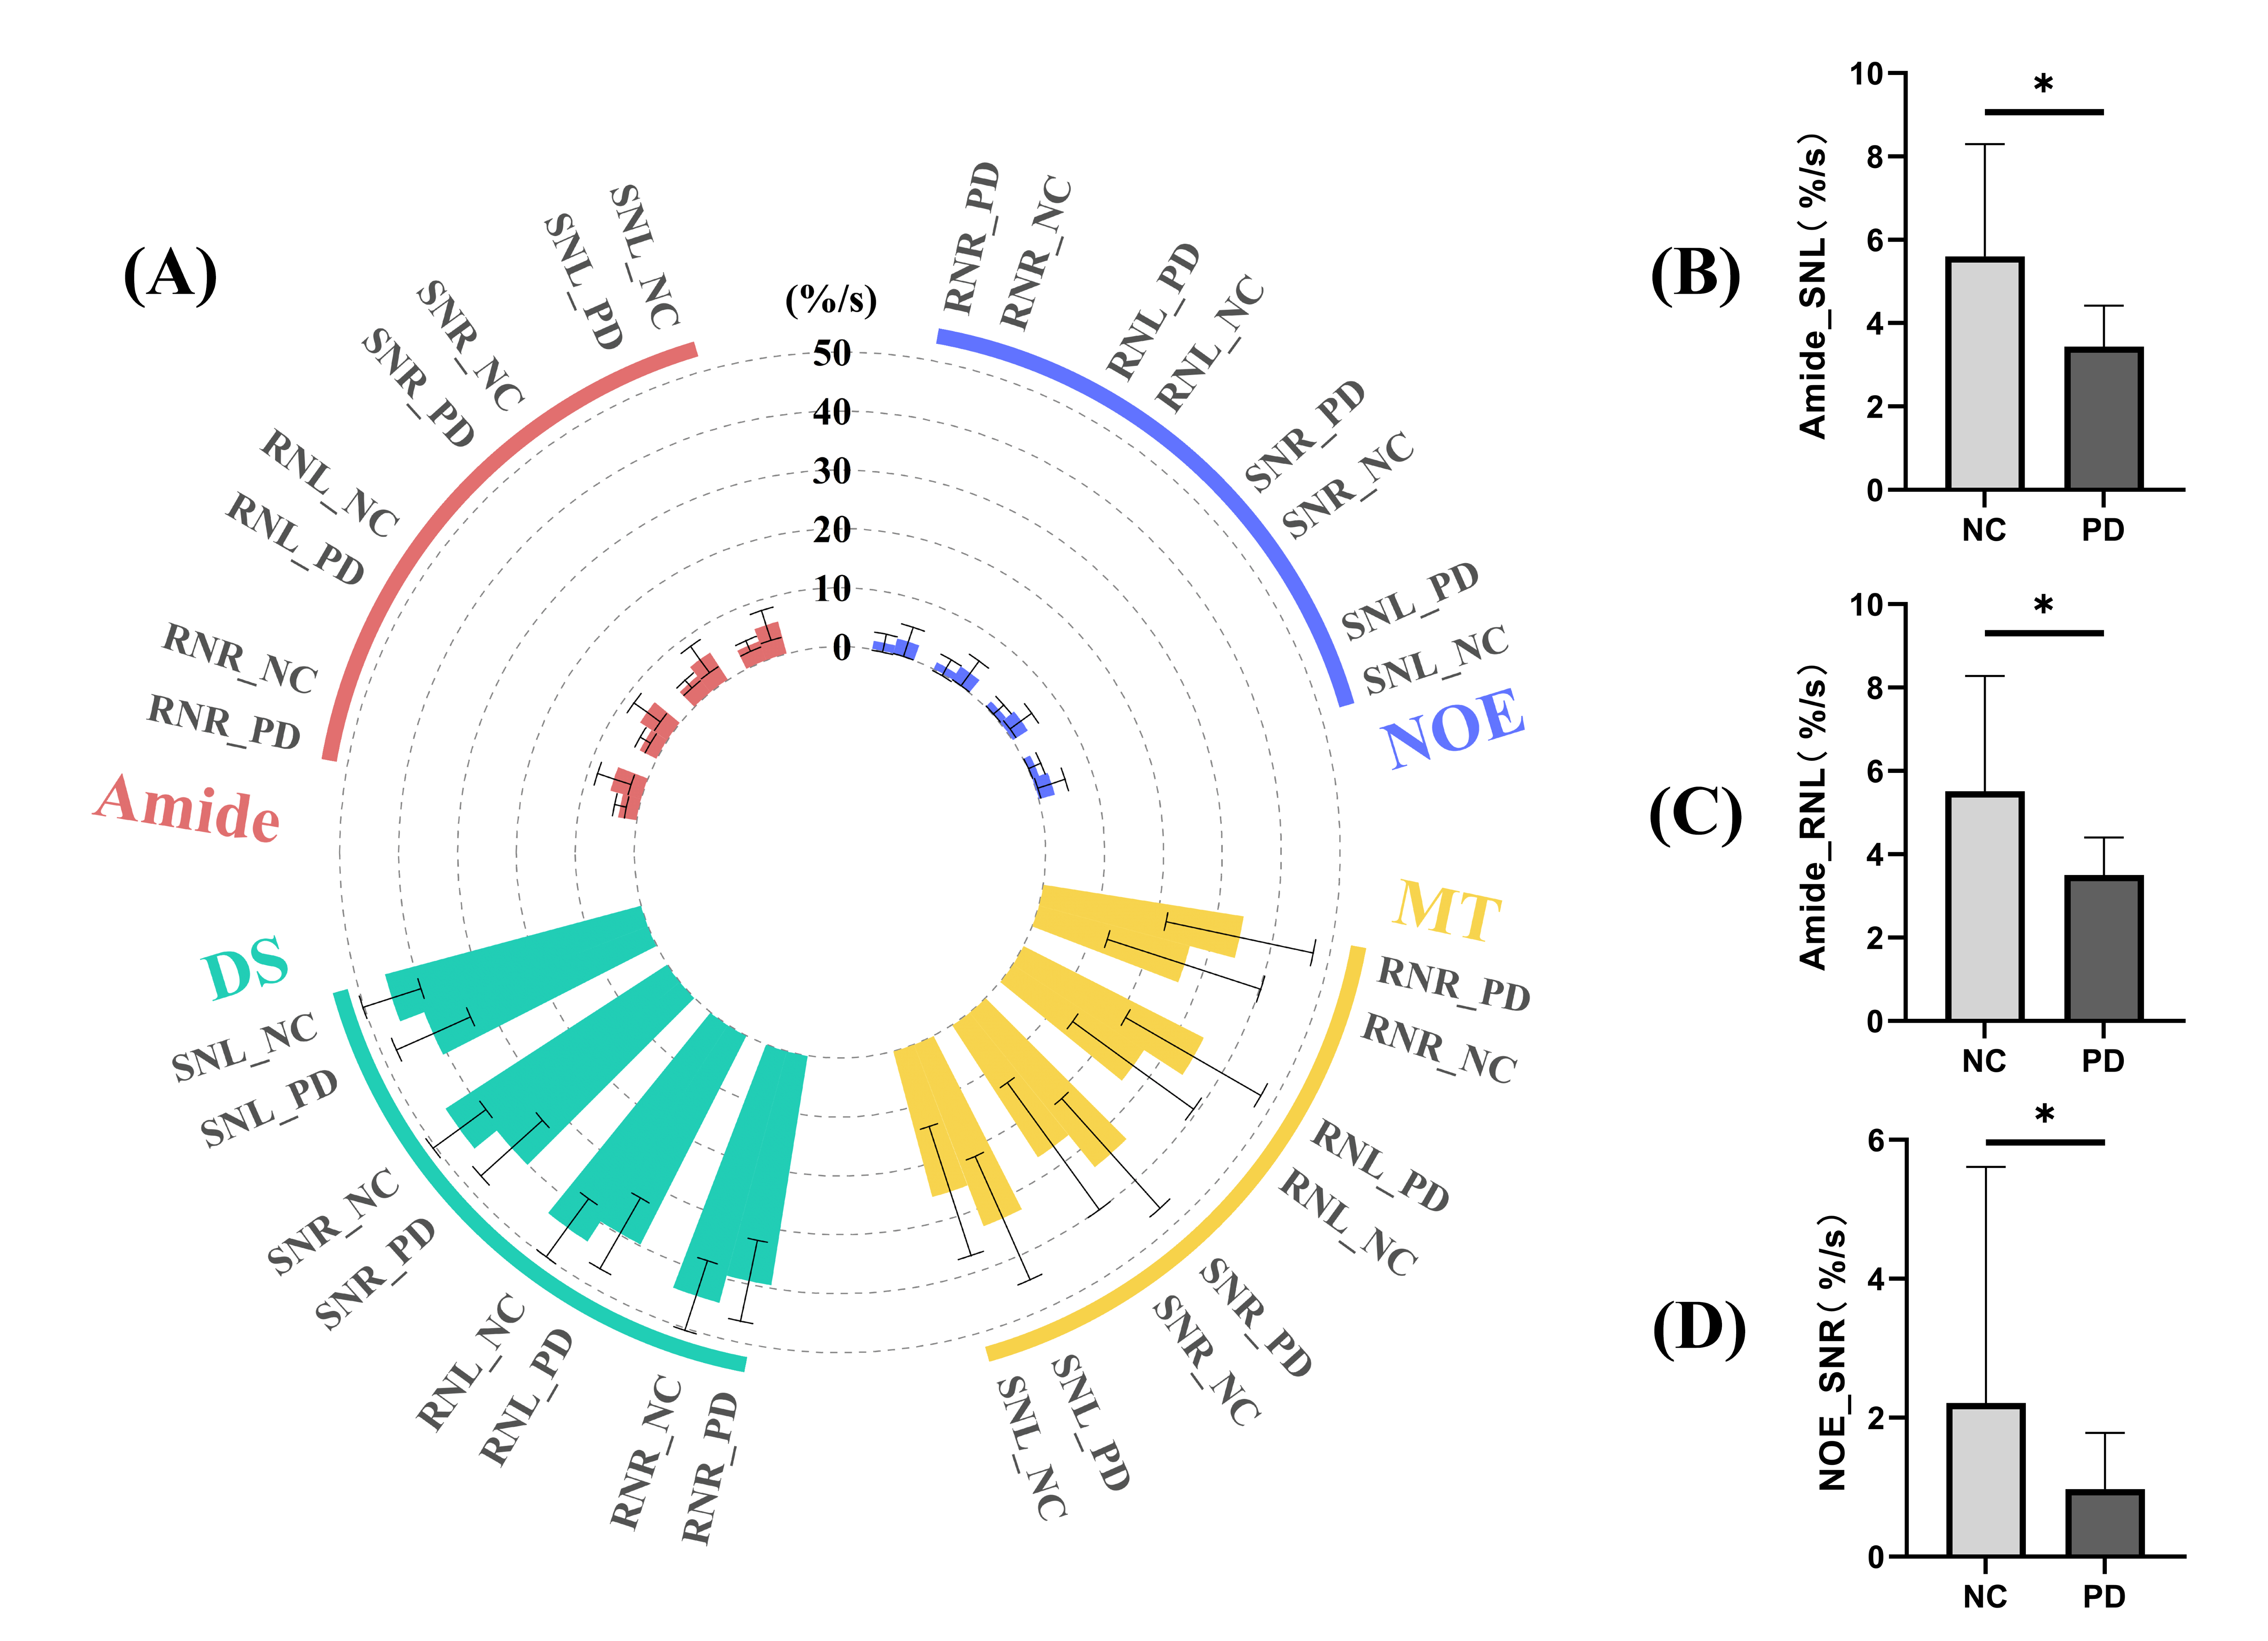
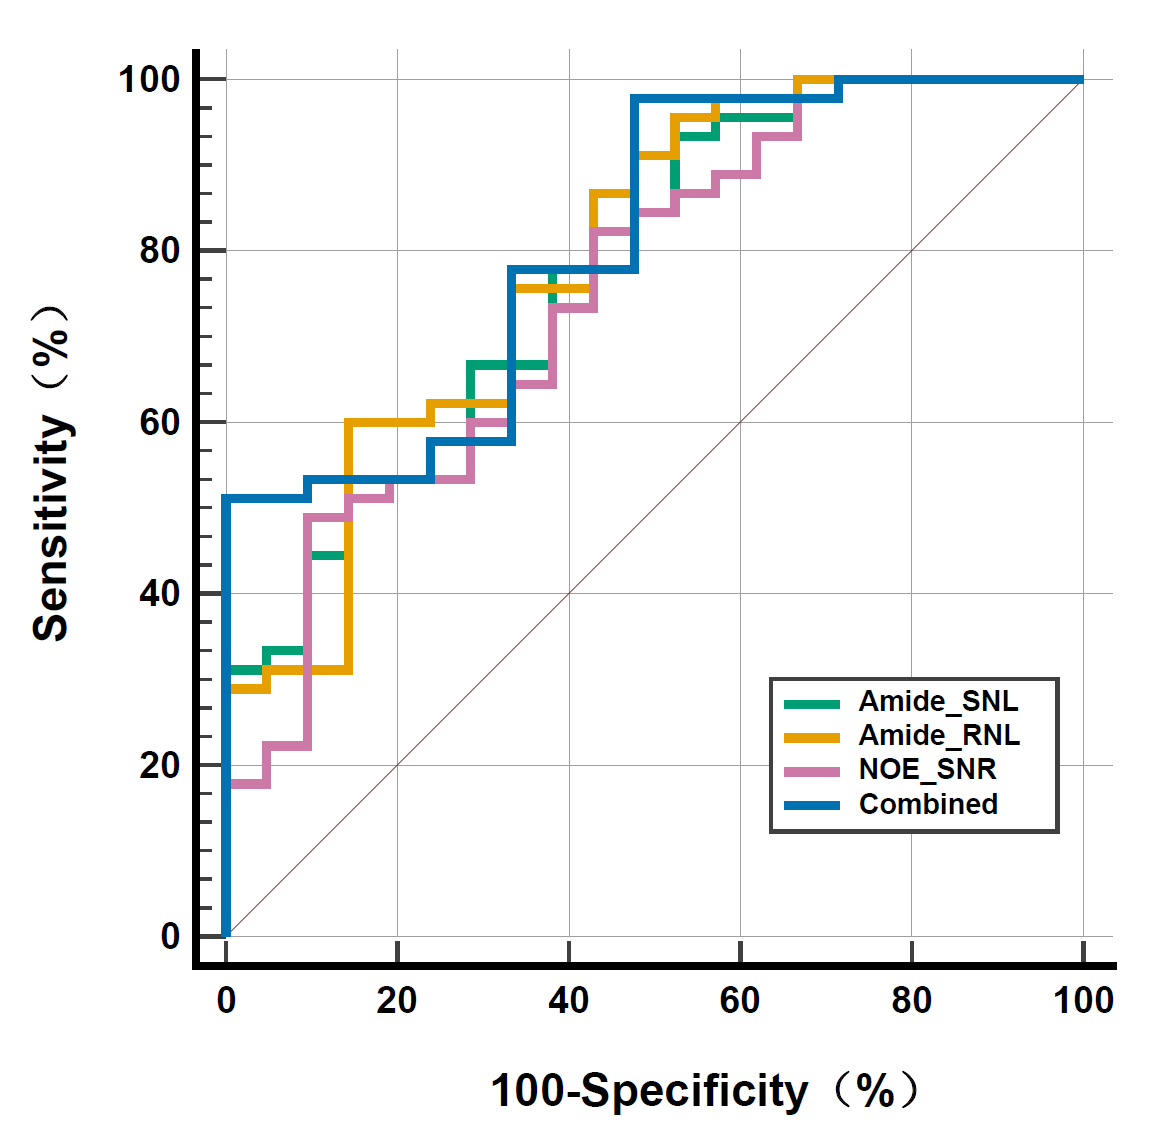
Representative maps of 4-pool Lorentzian fit and the quantitative CEST parameters of a PD subject and a HC subject were shown as figure1 and figure2. Compared with the NC group, statistically significant reductions were observed in the amide value of the left SN, the amide value of the left RN and the NOE value of the right SN of PD group (T=-3.587, P=0.026; T=-3.767, P=0.016; Z=3.270, P=0.017; respectively) , as figure3 show. The associated area under the curve (AUC) of the combined model and the above three CEST parameters had good diagnostic efficacy(AUC>0.7) (figure4). The combined model had the highest AUC value and specificity (AUC=0.81; specificity =97.78%), the amide value of left SN had the highest sensitivity (sensitivity =93.33%).Discussion
In this study, we employed a 4-pool Lorentzian fitting model for quantitative analysis in CEST-MRI to investigate alterations in signal intensity within the bilateral SN and RN regions in PD patients.The onset of PD is potential connected to the depletion of dopaminergic neurons and the development of Lewy bodies, which subsequently resulted in alterations in the amide concentrations within the SN6. The signal reductions of amide-pool amplitude of left SN may provide evidence for this pathological mechanism. Besides, the result of the left RN suggested possible pathological changes might happen in PD patients which was similar to those in the SN.Conclusions
CEST-MRI based on the 4-pool Lorentz fitting model was used to show the signal changes of the amide of the SN and RN in PD patients, and had great potential in PD diagnosis. The results indicated that CEST-MRI can reveal the signal alterations within the SN and RN in PD patients, including amide and NOE, suggesting significant clinical applicability in the diagnosis of PD.Acknowledgements
No acknowledgement found.References
1. WU B, WARNOCK G, ZAISS M, et al. An overview of CEST MRI for non-MR physicists. EJNMMI Phys, 2016, 3(1): 19.
2. Parkinson's Disease and Movement Disorders Study Group, Neurology Branch of Chinese Medical Association, Parkinson's disease and Movement Disorders Professional Committee of neurophysicians branch of Chinese Medical Association. Diagnostic criteria of Parkinson's disease in China. Chin J Urol, 2016, 49(4): 268-271.
3. GUIZAR-SICAIROS M, THURMAN S T, FIENUP J R. Efficient subpixel image registration algorithms J. Opt Lett, 2008, 33(2): 156-158.
4. CHEN L, CAO S, KOEHLER R C, et al. High-sensitivity CEST mapping using a spatiotemporal correlation-enhanced method J. Magnetic resonance in medicine, 2020, 84(6): 3342-3350.
5. WINDSCHUH J, ZAISS M, MEISSNER J E, et al. Correction of B1-inhomogeneities for relaxation-compensated CEST imaging at 7 T J. NMR in biomedicine, 2015, 28(5): 529-537.
6. SCHAPIRA A H, JENNER P. Etiology and pathogenesis of Parkinson's disease J. Mov Disord, 2011, 26(6): 1049-1055.
Figures