0969
Visual deficits in a late-stage Parkinson’s Disease mouse model revealed by functional MRI and validated by C-FOS expression and CBF measurements1Pre clinical MRI, Champalimaud Foundation, Lisboa, Portugal, 2Department of Bioengineering, Instituto Superior Técnico – Universidade de Lisboa, Institute for Systems and Robotics, Lisbon, Portugal, 3Department of Experimental Neurodegeneration, University of Göttingen, Gottingen, Germany
Synopsis
Keywords: Parkinson's Disease, Parkinson's Disease
Motivation: The involvement of the brain’s sensory systems in PD is poorly understood and visual deficits are often a complex and underappreciated aspect of the disease.
Goal(s): The goal of this study is to study the visual deficits in the PD mouse line by using fMRI, C-FOS expression and CBF.
Approach: Here we report aberrations in BOLD-fMRI responses along the visual pathway in mouse model of PD and validate via C-FOS protein expression and ASL.
Results: Our findings revealed decreased activity in the visual areas, decreased C-FOS confirmed the neural origin, and the ASL excluded any vascular differences that could alter the fMRI signals.
Impact: Many individuals with PD experience a decline in visual acuity. Thus, understanding and addressing visual deficits in Parkinson's disease is crucial for improving the overall well-being and daily functioning of individuals living with this condition.
Introduction
Parkinson’s disease(PD) is the second most widespread neurodegenerative disease worldwide1, typically characterized by α-synuclein(αSYN) aggregates, loss of brain volume2, and progressive motor deficits and cognitive decline. Up to 70%3 PD patients experience a decline in visual acuity4 suggesting involvement of sensory systems. The αSYN mouse model is an important model for PD. It has been broadly characterized at a molecular level (histology5,6 and transcriptomics7) and behaviourally8, but the ensuing functional deficits remain unknown. Here, we harness functional Magnetic resonance imaging (fMRI) to investigate potential deficits in the visual pathway in this model. We further validate the neural origin of our findings via C-FOS9 expression and pCASL mapping of cerebral blood flow10.Methodology
All animal experiments were pre-approved by the competent institutional and national authorities and were carried out according to European Directive 2010/63. Animals: The transgenic αSYN mouse model11 (C57BL/6-DBA/2Thy1-αSYN) and their wildtype littermates were used at 39±3 weeks of age and weighing 42g±15g. MRI setup: MRI was performed on a 9.4 T Bruker BioSpec scanner (Karlsruhe,Germany) equipped with an 86mm volume coil for transmittance, a 4-element array cryogenic coil (Bruker, Fallanden, Switzerland)for signal reception, and 660mT/m gradients. Visual stimulation paradigm: Mice (N=12/13 for PD/WT littermates controls, respectively) were sedated using medetomidine (0.4mg/kg bolus and 0.8mg/kg/h s.c. infusion). Two blue LEDs(λ=470nm) were placed above the eyes and used for binocular stimulation (flashes)12. The fMRI design consisted of 40/20seconds of rest/stimulation, respectively, at a frequency of 1Hz. fMRI acquisition: A multislice GE-EPI was used for the fMRI acquisitions, with the following parameters: TR/TE=1250/12msec, FOV=15x12mm^2, in-plane resolution=150×150μm^2, slice thickness=0.45mm (10slices), BW=326kHz, partial Fourier factor=1.3, and 472 repetitions along the visual stimulation paradigm. Data preprocessing and activation mapping: Data preprocessing and activation mapping: Images were outlier, slice-timing and motion corrected, coregistered and normalized to an atlas13 and slightly smoothed (FWHM=0.15mm), in SPM12. The GLM was computed (p<0.001,k>=10) and corrected for cluster false discovery rate (p<0.001). Region of interest (ROI) analysis: ROIs were extracted from the Allen brain atlas13 and mean±sem signals were extracted and detrended. The average cycle was calculated by averaging all stimulation epochs. The areas below the stimulation period were compared between groups. C-FOS: Following identical visual stimulation as in the fMRI experiments, brains were extracted (N=6 per group), kept in PFA for 2h, then sliced at 45μm thickness with a LeicaVT1000S Vibratome. Immunohistochemistry9 quantified the C-FOS protein expression. Briefly, C-FOS primary antibody (Synaptic Systems 226003) was used in combination with a secondary antibody Alexa Fluor 488 Goat anti-Rabbit (Abcam ab150077). A Zeiss Axioscan 7-SlideScanner at 10x was used to map and quantify C-FOS expression. ROIs were selected in VC, SC and LGN according to the Allen atlas13 and the expression levels were compared between groups. pCASL experiments: An unbalanced pCASL sequence was used10 for scanning mice (N=3 PD and N=3 WT littermate controls) from a different cohort in the same range of weight and age. The labelling plane was positioned at the mouse neck (~8mm below the isocenter), labelling duration (LD)=3s, post-labelling delay (PLD)=300ms, FOV=12x12mm^2, slice thickness=0.5mm, spatial resolution=100x100μm2, TR/TE=4000/25ms, 30 repetitions. For cerebral blood flow (CBF) quantification, a T1 map was obtained from an inversion recovery sequence.Results
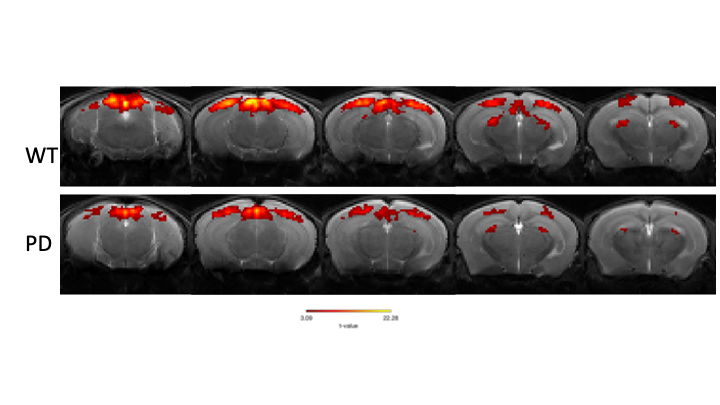
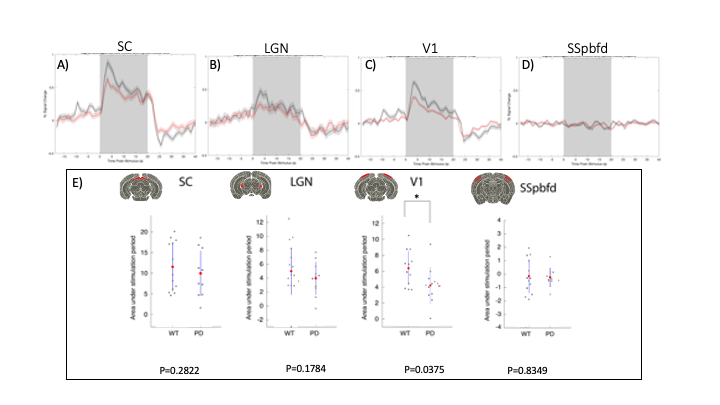
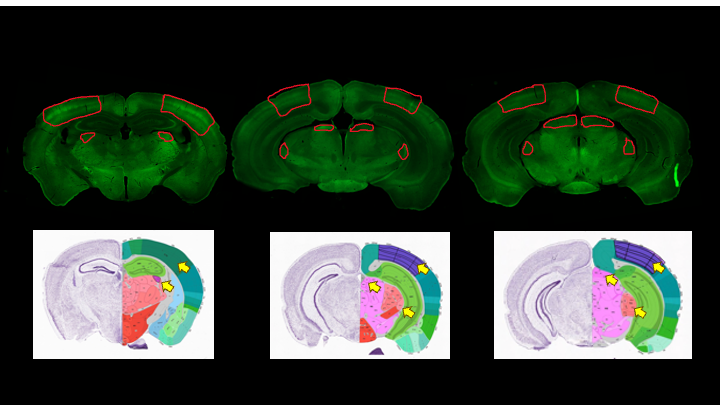
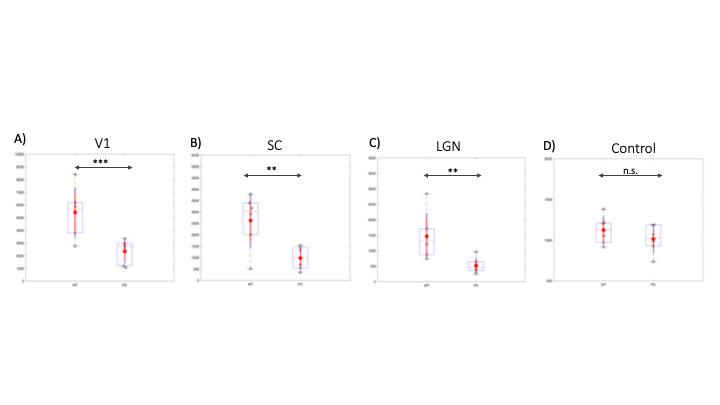
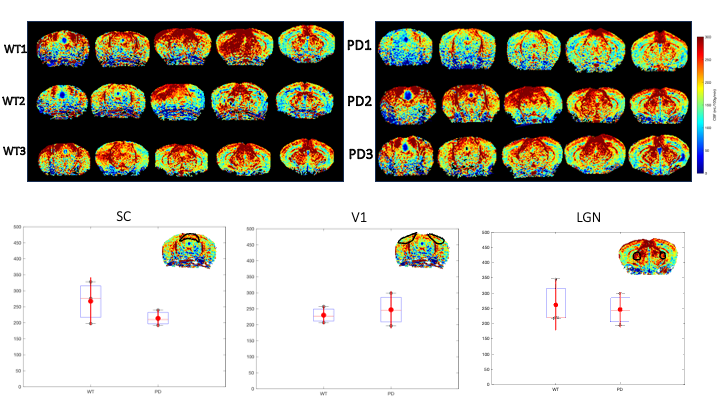
Upon visual stimulation, healthy controls exhibited robust activation in the visual pathway (Fig.1). The PD mice exhibited lower t-statistics, and the extent of activated areas was smaller compared to controls. ROIs placed anatomically in key structures of the visual pathway (Fig.2) confirmed these findings with statistically-significant lower fMRI signals in most areas for the PD mice. A control area showed no such differences. C-FOS protein expression (Fig.3) revealed significant protein expression reductions in all visual areas compared to WT controls (Fig.4A-C). In a control ROI, (entorhinal cortex), no significant differences were found between groups (Fig.4D). We also tested for vascular differences via preliminary CBF measurements and found no significant differences (Fig.5), though we acknowledge that only 3 animals were scanned per group, which do not suffice to show small effect sizes.Discussion
This multimodal study revealed deficits in fMRI signals in the entire visual pathway, which were found to be of neuronal origin via C-FOS experiments. Our preliminarily CBF measurements excluded potential vascular differences between the groups14 as dominant effects in the observed differences in the functional maps. Thus, neuronal activity in the visual areas is weaker in the PD mice at 9 months of disease, likely due to αSyn aggregation and ensuing impairments15. Our findings are promising both for future investigations of sensory deficits and for development of early biomarkers in PD.Acknowledgements
No acknowledgement found.References
1. Calabresi P, Di Filippo M. The changing tree in Parkinson’s disease. Nat Neurosci. Published online 2015. doi:10.1038/nn.40922. Haehner A, Hummel T, Reichmann H. Olfactory loss in parkinson’s disease. Park Dis. Published online 2011. doi:10.4061/2011/4509393. Urwyler P, Nef T, Killen A, et al. Visual complaints and visual hallucinations in Parkinson’s disease. Parkinsonism Relat Disord. 2014;20(3):318-322. doi:10.1016/j.parkreldis.2013.12.0094. Armstrong RA. Visual Symptoms in Parkinson’s Disease. Park Dis. 2011;2011:1-9. doi:10.4061/2011/9083065. Cong L, Muir ER, Chen C, et al. Multimodal MRI evaluation of the mitopark mouse model of Parkinson’s disease. PLoS ONE. Published online 2016. doi:10.1371/journal.pone.01518846. Yao L, Wu J, Koc S, Lu G. Genetic Imaging of Neuroinflammation in Parkinson’s Disease: Recent Advancements. Front Cell Dev Biol. 2021;9. doi:10.3389/fcell.2021.6558197. Hisahara S, Shimohama S. Toxin-Induced and Genetic Animal Models of Parkinson’s Disease. Park Dis. 2011;2011. doi:10.4061/2011/9517098. Campos FL, Carvalho MM, Cristovão AC, et al. Rodent models of Parkinson’s disease: beyond the motor symptomatology. Front Behav Neurosci. 2013;7. doi:10.3389/fnbeh.2013.001759. Perrin-Terrin AS, Jeton F, Pichon A, et al. The c-FOS Protein Immunohistological Detection: A Useful Tool As a Marker of Central Pathways Involved in Specific Physiological Responses In Vivo and Ex Vivo. J Vis Exp. 2016;(110):53613. doi:10.3791/5361310. Hirschler L, Debacker CS, Voiron J, Köhler S, Warnking JM, Barbier EL. Interpulse phase corrections for unbalanced pseudo‐continuous arterial spin labeling at high magnetic field. Magn Reson Med. 2018;79(3):1314-1324. doi:10.1002/mrm.2676711. Hansen C, Angot E, Bergström AL, et al. α-Synuclein propagates from mouse brain to grafted dopaminergic neurons and seeds aggregation in cultured human cells. J Clin Invest. 2011;121(2):715-725. doi:10.1172/JCI4336612. Gil R, Fernandes FF, Shemesh N. Neuroplasticity-driven timing modulations revealed by ultrafast functional magnetic resonance imaging. NeuroImage. Published online 2021. doi:10.1016/j.neuroimage.2020.11744613. ’Keith F, ’George P. Atlas of the Developing Mouse Brain. Vol 1. (Academic Press, ed.). Academic Press; 2019.14. Biju K, Shen Q, Hernandez ET, Mader MJ, Clark RA. Reduced cerebral blood flow in an α -synuclein transgenic mouse model of Parkinson’s disease. J Cereb Blood Flow Metab. 2020;40(12). doi:10.1177/0271678X1989543215. Spinelli KJ, Taylor JK, Osterberg VR, et al. Presynaptic alpha-synuclein aggregation in a mouse model of Parkinson’s disease. J Neurosci. Published online 2014. doi:10.1523/JNEUROSCI.2581-13.2014Figures