0966
Metabolic neuroimaging of ApoE and APP mutational status in mouse models of Alzheimer’s disease1Department of Physical Therapy and Rehabilitation Science, University of California, San Francisco, San Francisco, CA, United States, 2Department of Radiology and Biomedical Imaging, University of California, San Francisco, San Francisco, CA, United States, 3UCSF/UCB Graduate Program in Bioengineering, University of California, San Francisco, San Francisco, CA, United States, 4Gladstone Institute of Neurological Disease, Gladstone Institutes, San Francisco, CA, United States, 5Department of Neurology, University of California, San Francisco, San Francisco, CA, United States, 6Neuroscience Graduate Program, University of California, San Francisco, San Francisco, CA, United States, 7Graduate Program in Biomedical Sciences, University of California, San Francisco, San Francisco, CA, United States
Synopsis
Keywords: Hyperpolarized MR (Non-Gas), Alzheimer's Disease, Metabolism, Hyperpolarized MR, Proton MRS
Motivation: As metabolic impairment is key in AD, metabolic imaging could potentially improve diagnosis and monitoring of AD.
Goal(s): Our goal is to determine which metabolic imaging approach, or combination of approaches, provide the optimal set of biomarkers for AD.
Approach: We combined three metabolic imaging methods, 1H MRS, HP 13C MRSI and 18F-FDG PET, with machine learning to characterize the neurometabolic profiles linked to AD-related risk factors, namely ApoE mutation, APP mutation, and sex in AD mouse models.
Results: Combining metabolic neuroimaging and machine learning can help discriminate between AD-related mutational status (APP and ApoE) and provide information of AD-related sexual dimorphism.
Impact: Knowing which metabolic imaging approach(es) is/are optimal to monitor progression in each subset of AD patients, based on sex and mutational status, would improve patient-centric clinical care and potentially create new avenues for assessment of new metabolism-targeting therapies.
Introduction
As metabolic impairment is a key player in Alzheimer’s disease1,2,3, a metabolism-oriented imaging strategy could potentially detect altered brain metabolic profiles, thus improving diagnosis and monitoring of AD. 18F-FDG Positron Emission Tomography (PET) is the gold standard for metabolic imaging in AD, but radiation exposure and high background limit its use. 1H Magnetic Resonance Spectroscopy (MRS) has been applied to AD, but conclusive outcomes are lacking. Hyperpolarized 13C MRS Imaging (HP 13C MRSI) has been preclinically applied to brain disease models and is expanding clinically, but has yet to be applied to AD.Here, we combined three metabolic imaging methods, 1H MRS, HP 13C MRSI, and 18F-FDG PET, to study the impact of three AD-related risk factors, namely ApoE mutation, APP mutation, and sex in genetically engineered AD mice. Machine learning was used to classify groups and find metabolic feature(s) characterizing each risk factor. Altogether, our results suggest that combining metabolic neuroimaging and machine learning could help discriminate between AD-related mutational status, facilitate biomarker searching, and provide information on AD-related sexual dimorphism.
Methods
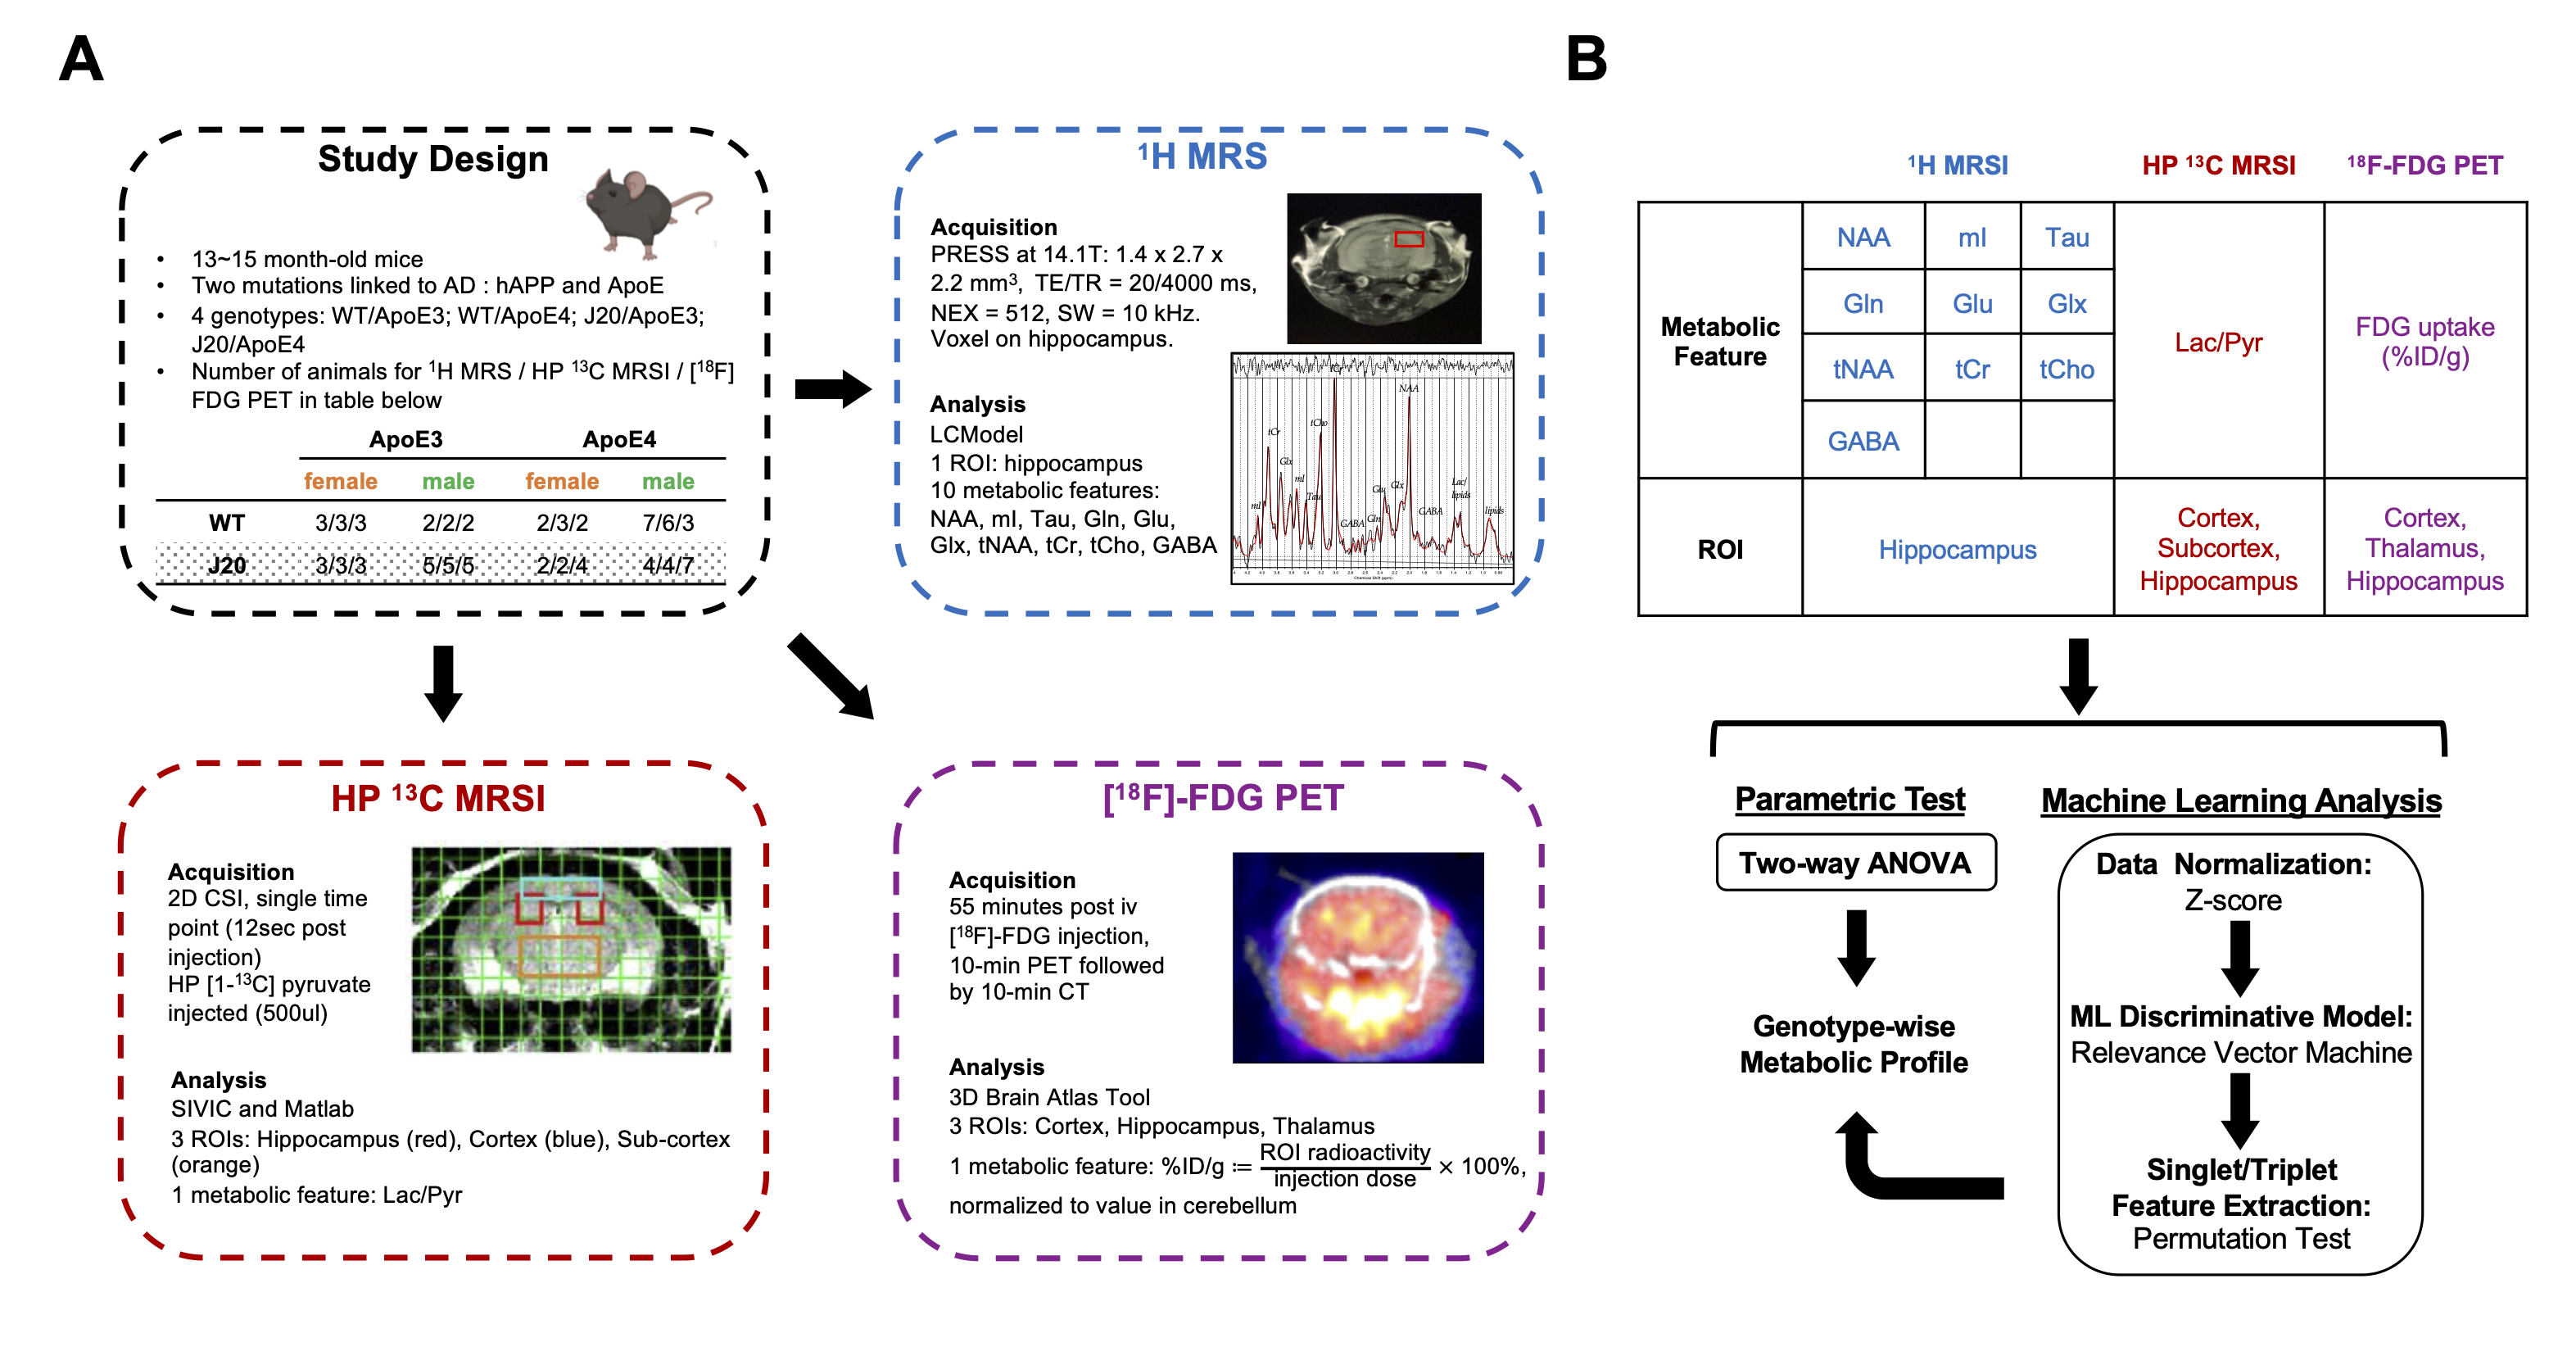
Animals: 27 animals (13~15 months-old) underwent all imaging protocols (Fig.1A). Four groups were used: WT (ApoE3w/o hAPP-KI), ApoE4-Only (ApoE4 w/o hAPP-KI), J20-Only (ApoE3 with hAPP-KI), and Interaction (ApoE4 with hAPP-KI). Animals were imaged under 1.3-1.8% isoflurane on a 14.1Tesla Agilent® system (MR) or a PET/CT scanner (Inveon, Siemens, USA).1H MRS: MRS data from hippocampus was acquired with a 1H Agilent® volume coil using a PRESS sequence: TE/TR=20/4000ms, NEX=512, SW=10kHz, voxel size=1.4x2.7x2.2mm3. Data was processed using LCModel to quantify 10 metabolites.
13C MRSI: 24μL [1-13C]pyruvate [REF] was hyperpolarized using a Hypersense DNP polarizer (Oxford Instruments) for 1h.4 2D MRSI data were acquired 18s after iv injection using: TE/TR=0.56/68ms; SW=4006 Hz; FA=10°; FOV=30×30mm²; 5mm thickness. Lactate/pyruvate ratio was quantified using SIVIC and Matlab for 3 regions: cortex, subcortex, and hippocampus.
18F-FDG PET: Mice received 71±4.5μCi 18F-FDG in 0.1 mL via tail vein. Fifty-five minutes after administration, static PET images were collected (10-minute). Percent-injected dose per grams (%ID/g) at hippocampus, cortex, subcortex and cerebellum were computed using VivoQuant.
Statistics: All metabolic imaging metrics were first analyzed in a conventional way using 2-way ANOVA in Prism.
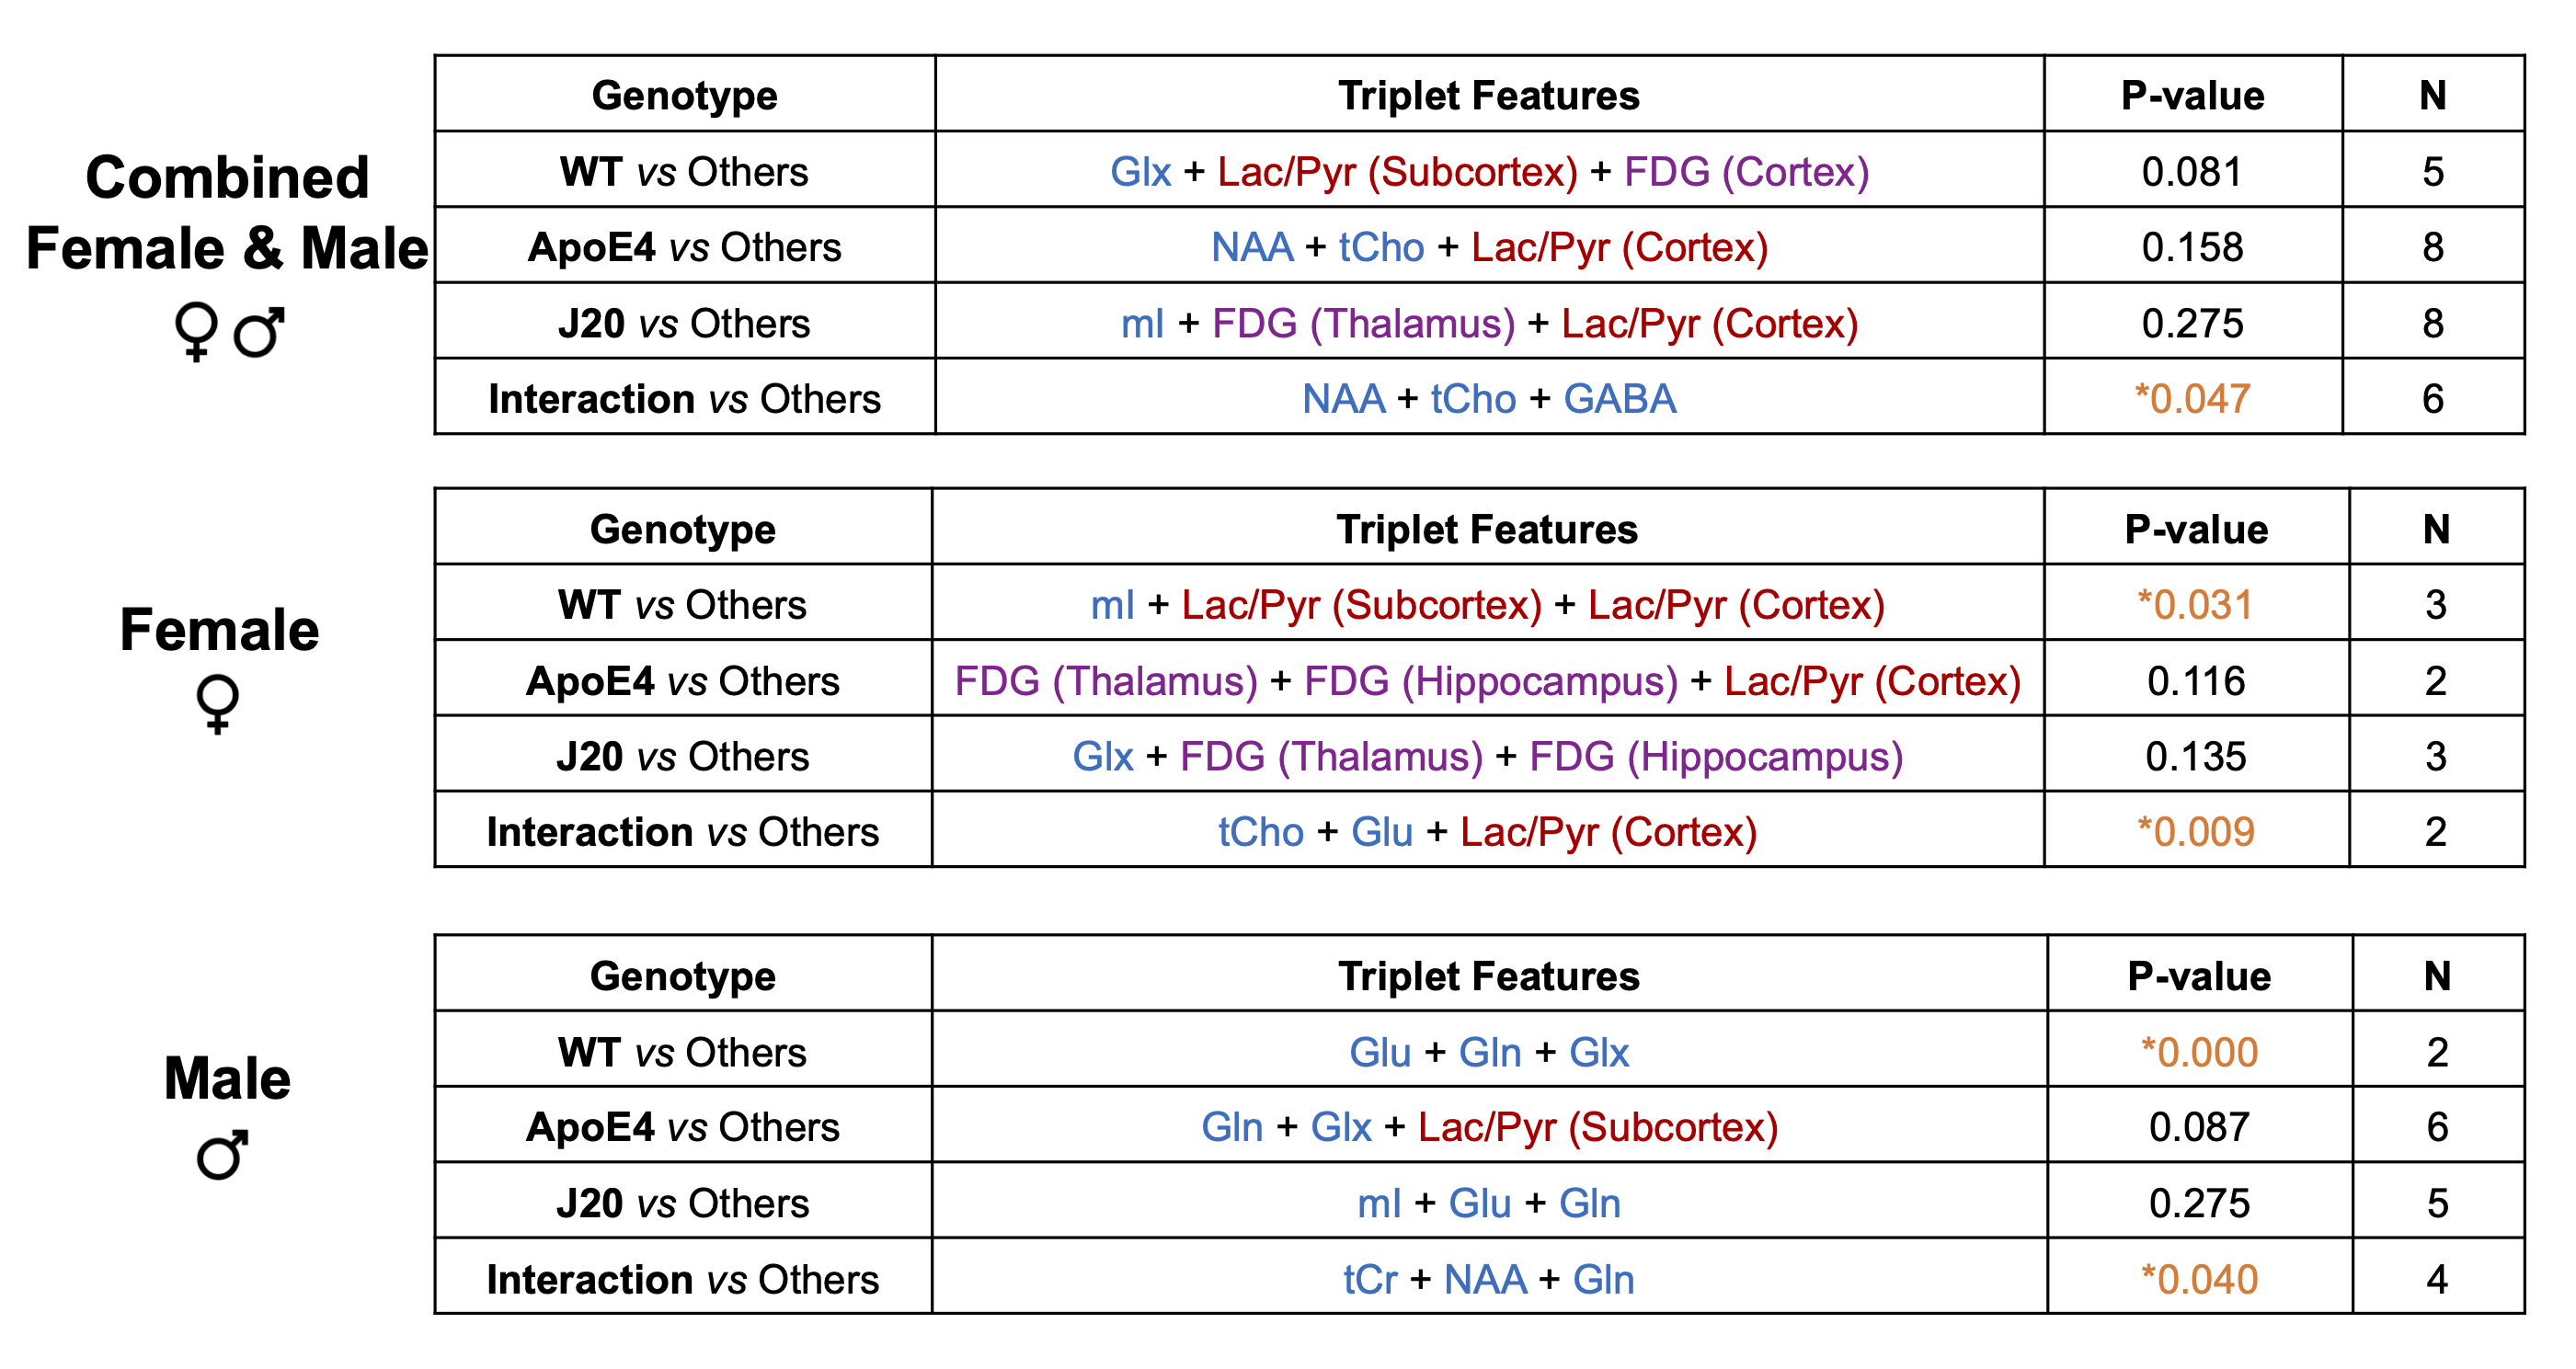
Machine Learning: 16 metabolic metrics were used as input features after data standardization via Z-score (Fig.1B). Relevance Vector Machine (RVM) algorithm was implemented for multi-class classification using open-source sklearn-rvm toolbox.5 Four RVM models were trained to assign each animal to one of the four groups with a confidence score and classification decision was made on a One-vs-Others basis. To estimate the impact of each metabolic feature, a permutation test (num_iterations = 1000) was operated in a feature-wise and model-wise way. The p-value of each metabolic feature was reported by calculating the percentage of permutation-based confidence scores that were higher than the original confidence score. Following the same logic, the triplet permutation test was run to estimate the contribution of any feature triplet. To evaluate sex effect, the RVM-based classification and permutation test were operated separately for female and male mice.
Results
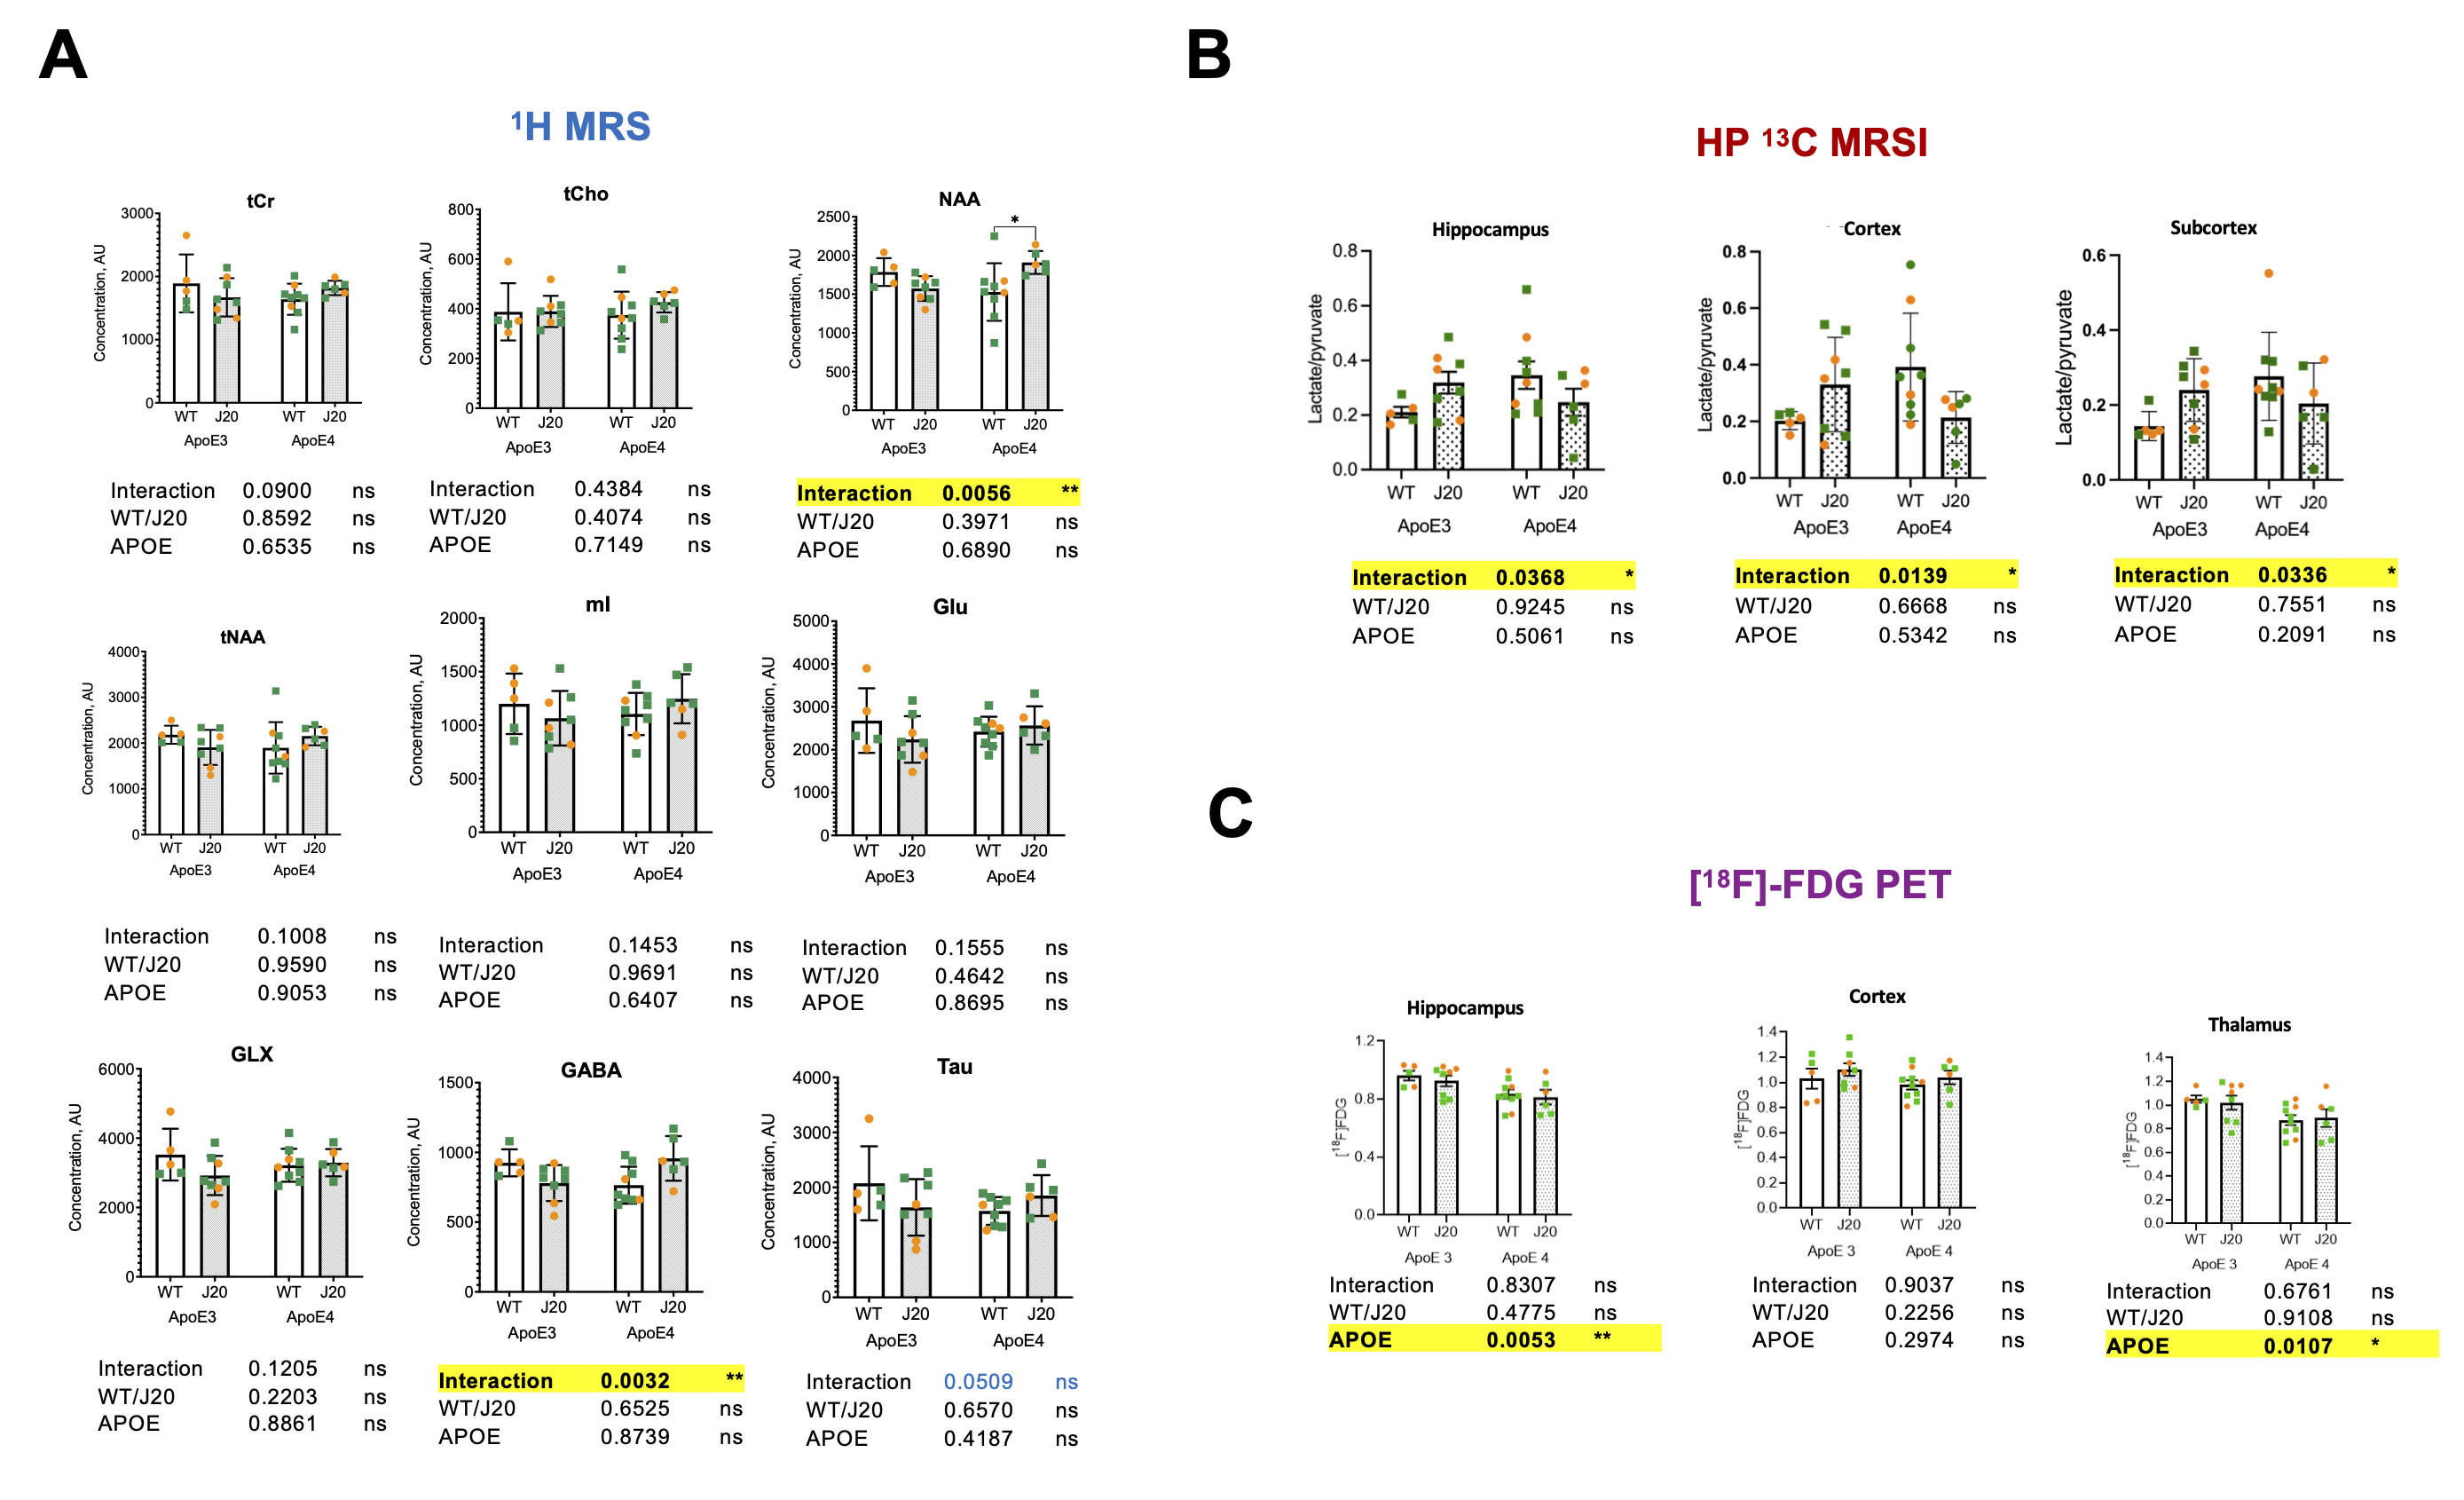
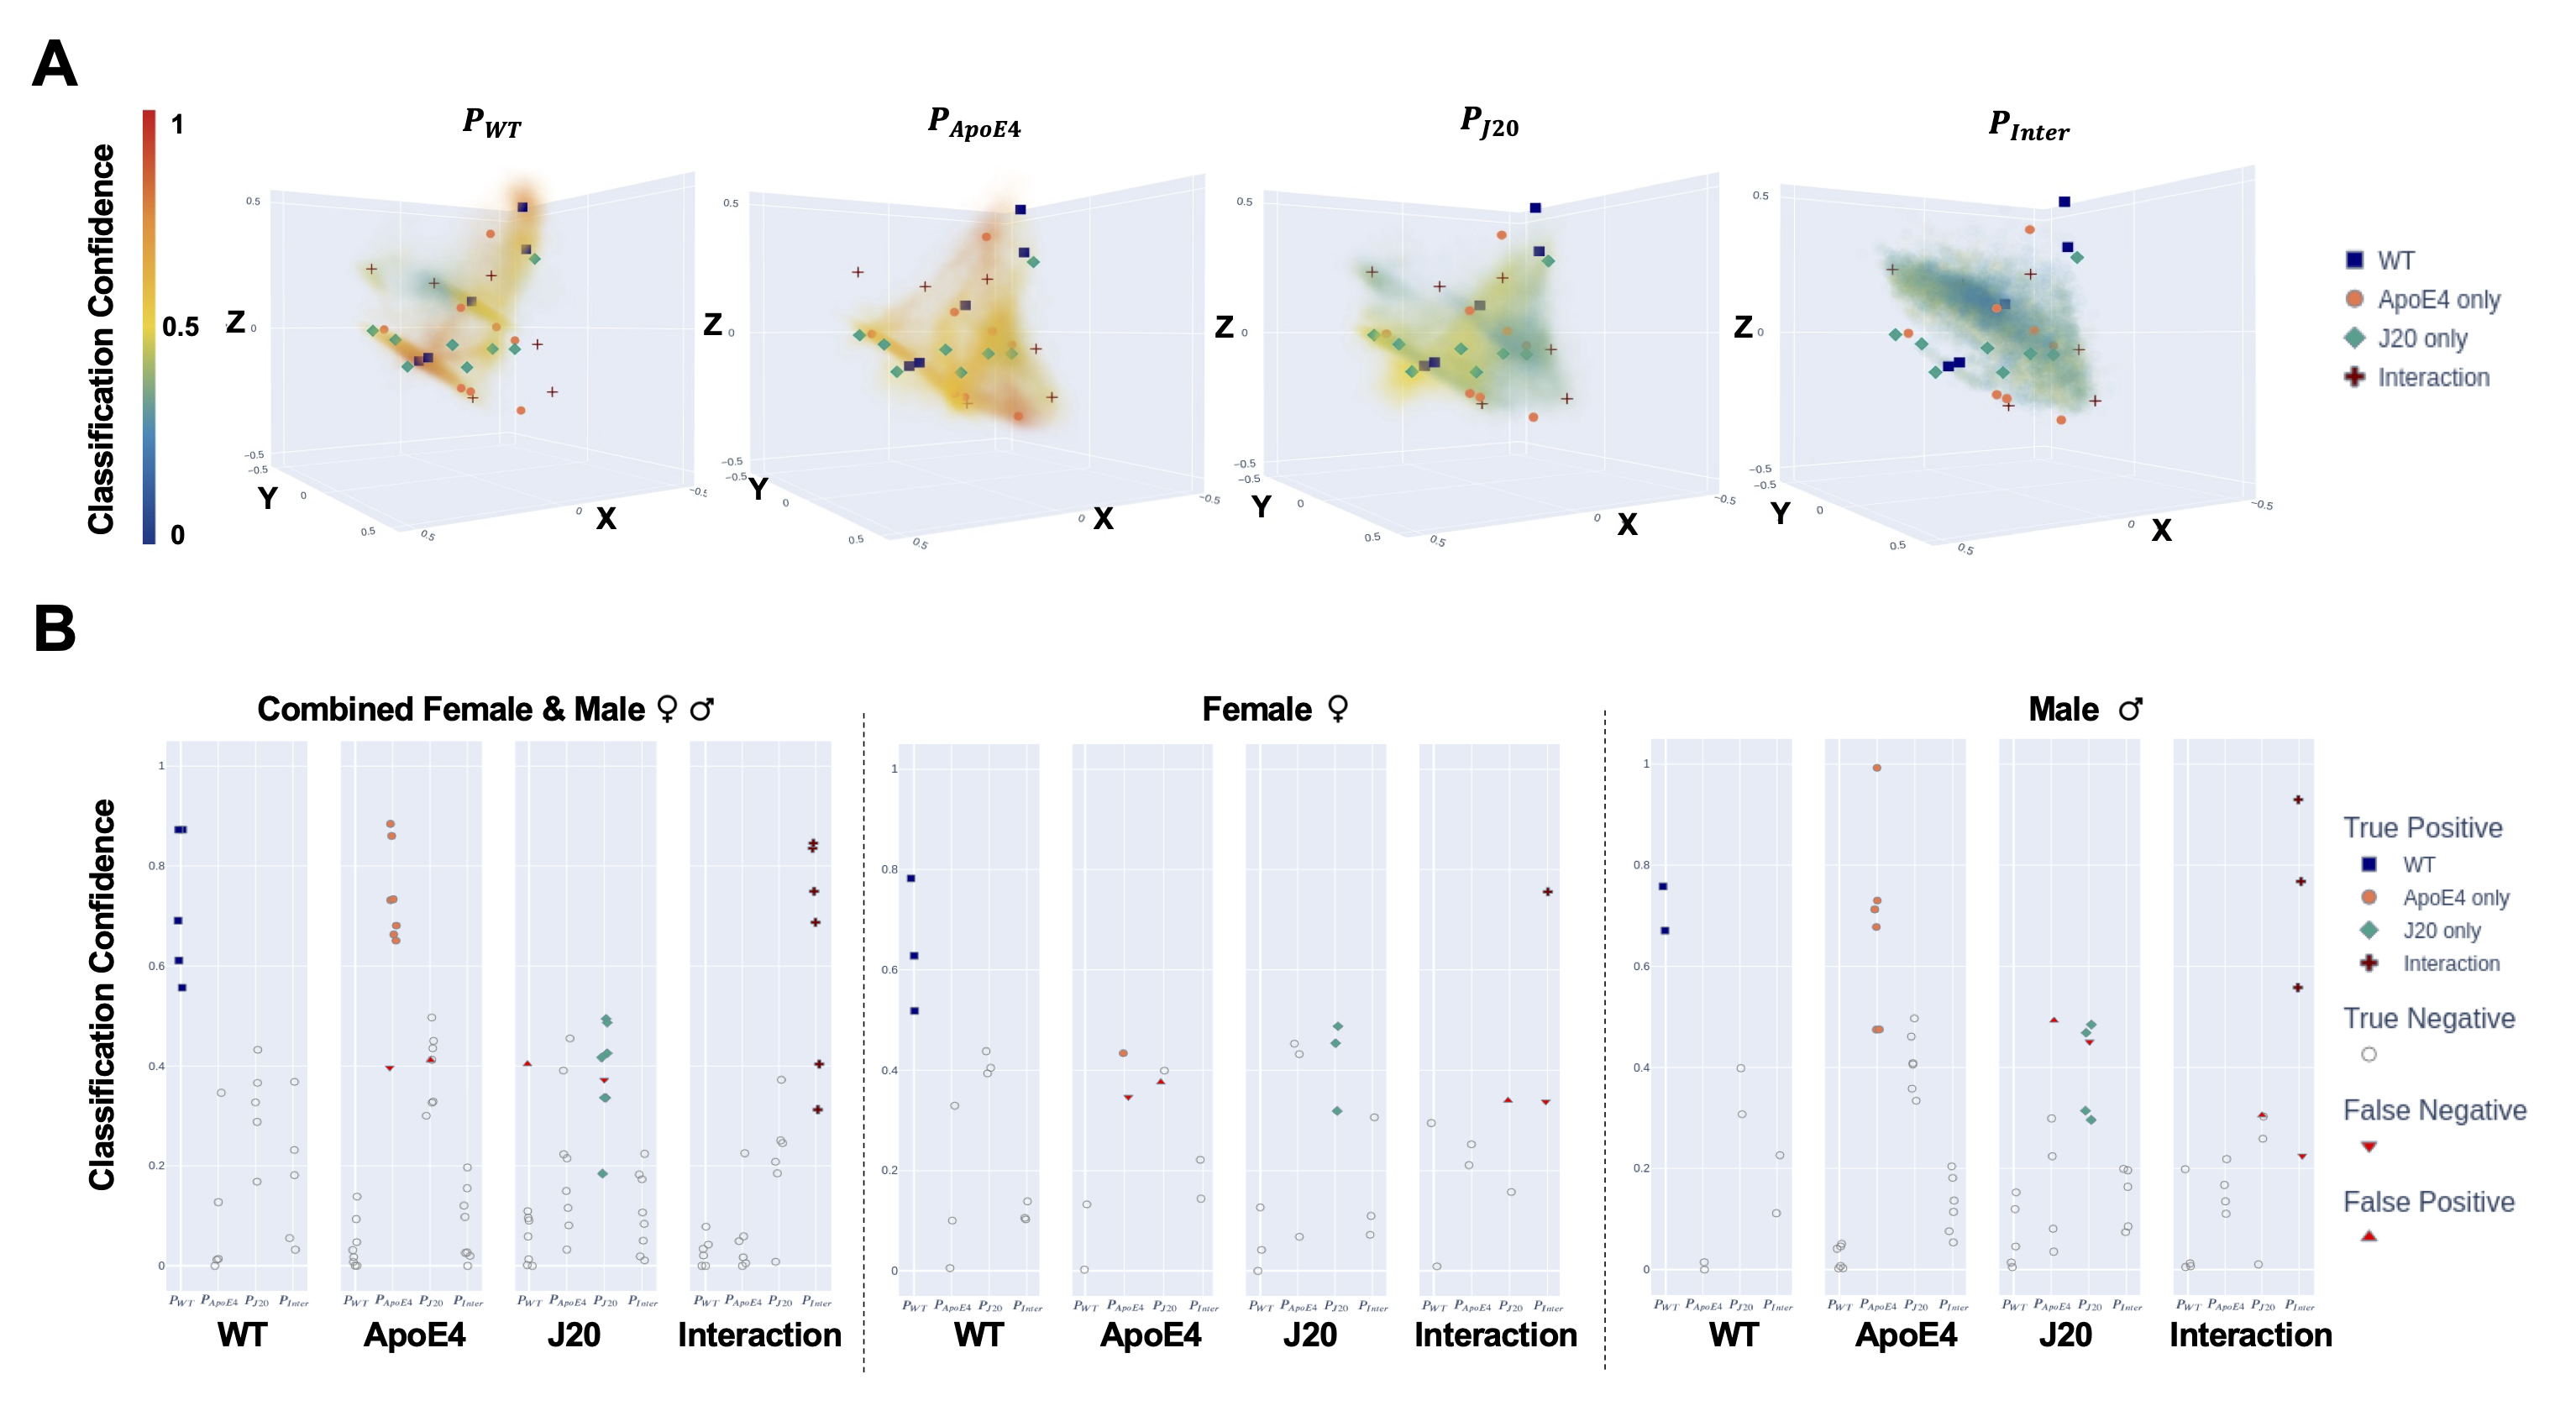
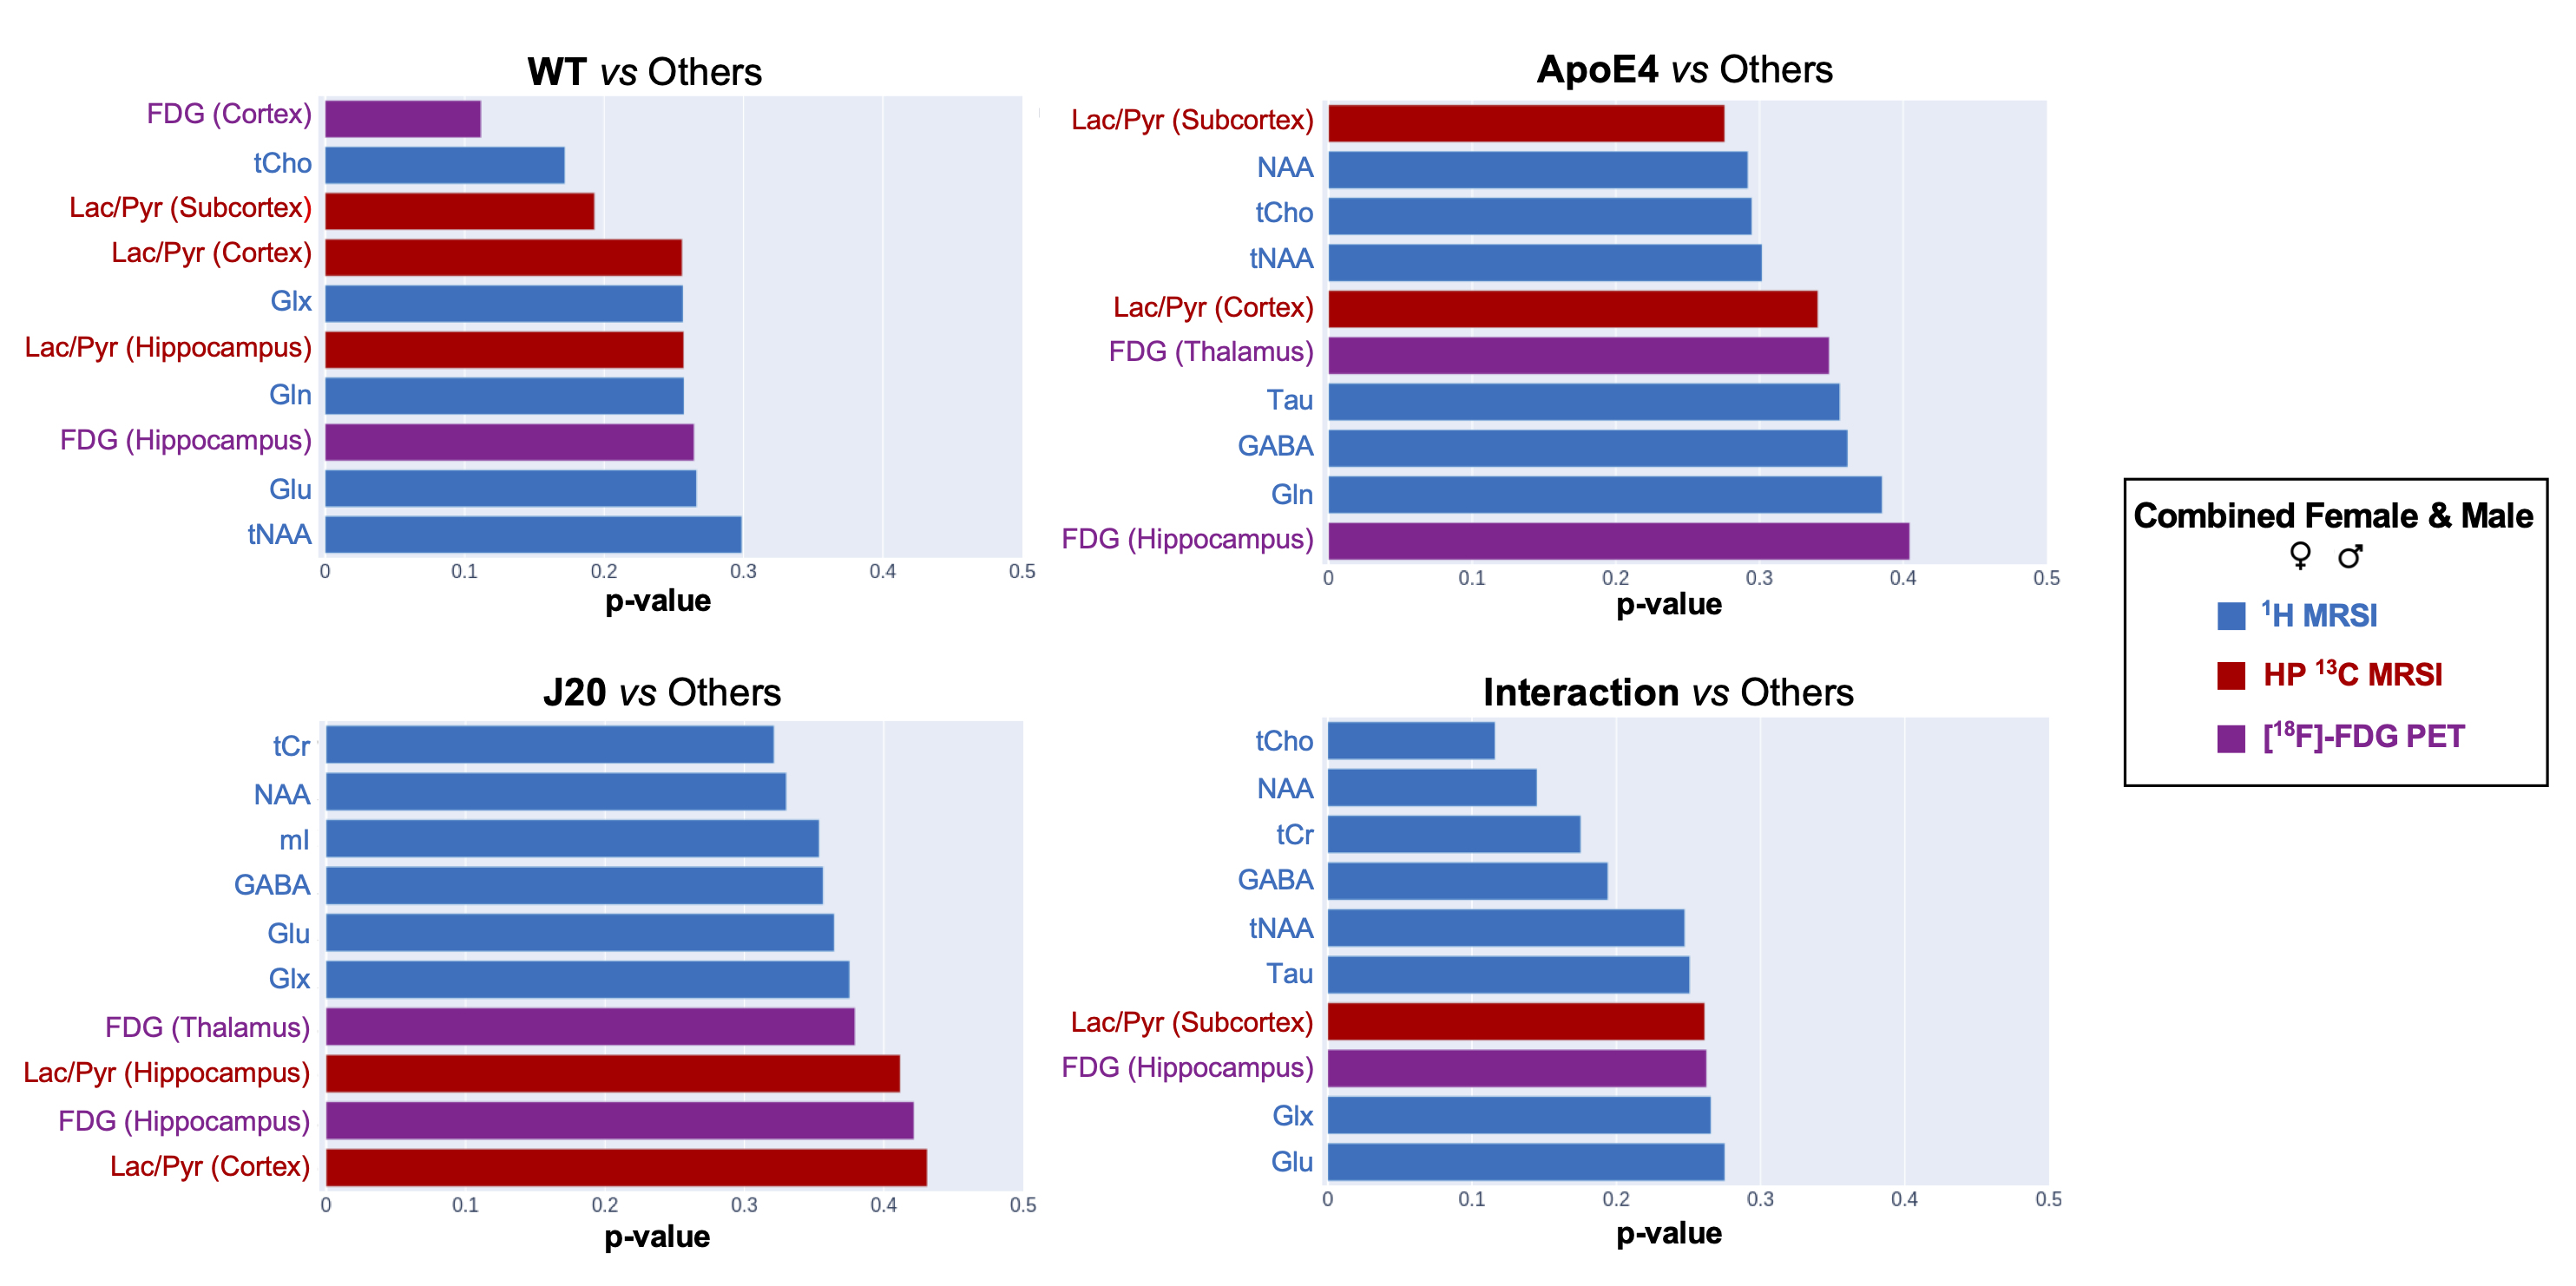
Two-way ANOVA results showed a significant effect of ApoE×APP Interaction on GABA and NAA hippocampal levels (1H MRS), and on lactate/pyruvate ratio across all ROIs (HP 13C MRSI) (Fig.2A~B). Significantly reduced FDG uptake in hippocampus and thalamus was also found in all mice harboring the ApoE4 mutation (Fig.2C). RVM algorithm was robust in handling classification of the four genotypes, with total accuracy of 92.6% for combined sex, 80% for female, and 88.2% for male (Fig.3B~C). Particularly in the WT-vs-Others task, the RVM models showed 100% specificity and 100% sensitivity. The permutation tests identified the singlet (Fig.4) and triplet (Fig.5) metabolic features that are pivotal for genotype classification, where a lower p-value stands for a higher impact. All three imaging modalities contributed pivotal features to setting boundaries between WT and AD mutant mice, where FDG uptake (cortex), tCho hippocampal level, and Lac/Pyr raio (Cortex+Subcorex) are among the most impactful. In Interaction-vs-Others, most pivotal features were derived from 1H MRS (Fig.4~5), including tCr, NAA, and Gln. When looking at sex effect, 1H MRS metabolic features were pivotal in male mice, whereas metabolic features from all three modalities were necessary for female mice classification (Fig.5).Conclusions
All three metabolic imaging modalities (1H MRS, HP 13C MRSI, and 18F-FDG PET) are necessary and sufficient in differentiating between WT and AD mice with different mutation status. The metabolic profile of each genotype was characterized by determining the pivotal features used by the RVM discriminatory model. The RVM-based analysis of metabolic neuroimaging can help discover pivotal biomarkers and understand pathogenesis in AD.Acknowledgements
XG, MR, CG and LLP contributed equally to this work. This work was supported by National Institutes of Health RF1 AG064170 (to K.N. and M.M.C.), R01 NS102156 (M.M.C.) and R21 AI153749 (M.M.C., C.G.). It was also supported by the Alzheimer’s Association (H.L. and LLP), a Brightfocus Foundation Fellowship (LLP), Berkelhammer Award for Excellence in Neuroscience (Y.S.) and the NIH Hyperpolarized MRI Technology Resource Center #P41EB013598.References
1. Martins, R. N. et al. Alzheimer’s disease: a journey from amyloid peptides and oxidative stress, to biomarker technologies and disease prevention strategies—gains from AIBL and DIAN cohort studies. J. Alzheimers Dis. 62, 965–992 (2018).
2. Zhang S, Lachance BB, Mattson MP, Jia X. Glucose metabolic crosstalk and regulation in brain function and diseases. Prog Neurobiol. 2021 Sep;204:102089. doi: 10.1016/j.pneurobio.2021.102089. Epub 2021 Jun 10. PMID: 34118354; PMCID: PMC8380002.
3. Butterfield, D.A., Halliwell, B. Oxidative stress, dysfunctional glucose metabolism and Alzheimer disease. Nat Rev Neurosci 20, 148–160 (2019). https://doi.org/10.1038/s41583-019-0132-6
4. Guglielmetti, C., Cordano, C., Najac, C. et al. Imaging immunomodulatory treatment responses in a multiple sclerosis mouse model using hyperpolarized 13C metabolic MRI.Commun Med 3, 71 (2023). https://doi.org/10.1038/s43856-023-00300-1
5. Tipping, Michael E.. “The Relevance Vector Machine.” Neural Information Processing Systems(1999).
Figures