0964
Increased Extra-neurite Conductivity of Brain in Patients with Alzheimer’s Disease1Radiology, Kyung Hee University Hospital at Gangdong, Seoul, Korea, Republic of, 2Biomedical Engineering, Kyung Hee University, Yongin-si, Korea, Republic of, 3Mathematics, Konkuk University, Seoul, Korea, Republic of, 4Neurology, Kyung Hee University Hospital at Gangdong, Seoul, Korea, Republic of
Synopsis
Keywords: Alzheimer's Disease, Alzheimer's Disease
Motivation: The decomposed high-frequency conductivity (HFC) into extra-neurite and intra-neurite components to calculate compartmental conductivities has not been applied to any neurological conditions.
Goal(s): To investigate how the separated extra-neurite conductivity (EC) and intra-neurite conductivity (IC) were reflected in Alzheimer’s disease (AD) patients and to evaluate the association between compartmental conductivities and cognitive decline
Approach: A total 66 patients included in 20 AD patients, 25 amnestic MCI patients, and 21 controls were scanned with a multi-echo turbo spin-echo and multi-shell diffusion tensor EPI sequences.
Results: The EC value was higher in patients with AD than others and decreased with increasing K-MMSE scores.
Impact: The EC value might be used as an imaging biomarker for helping to monitor cognitive function.
Background and Purpose
The levels of conductivity in the extracellular and intracellular space of the brain are still unknown, especially in the brains of Alzheimer’s disease (AD) patients. Magnetic resonance electrical property tomography (MREPT) is a technique to derive in vivo internal electrical conductivity using a standard MRI system without applying externally mounted electrodes or currents and to map high-frequency conductivity (HFC) at the Larmor frequency. Recently, based on information obtained from both HFC and multi-compartment diffusivity, we developed a method to decompose HFC into the low-frequency conductivity of the human brain without injecting an external current (1). This method decomposed HFC into extra-neurite and intra-neurite components to calculate compartmental conductivities but has not been applied to any neurological conditions.The objectives of this study were to investigate how the separated EC and HFC were reflected in AD patients compared with elderly CN people and patients with amnestic mild cognitive impairment (MCI) and to evaluate the association between EC and cognitive decline.
Methods
A total of 66 patients were included including 20 AD patients, 25 amnestic mild cognitive impairment (MCI) patients, and 21 cognitively normal (CN) old people. For the brain MREPT images, a multi-echo turbo spin-echo pulse sequence was used. For obtaining diffusion tensor images to model the multi-compartment spherical mean technique (MC-SMT) (2), a single-shot spin-echo echo-planner imaging (SS-SE-EPI) pulse sequence was used to obtain diffusion tensor with two b-shells of nominally 800 and 2000 s/mm2 with 16 and 32 gradient directions, respectively. HFC was calculated and decomposed into extra- (EC) and intra-neurite (IC) conductivities, respectively. To process the reconstructed maps of each participant, the Statistical Parametric Mapping version 12 (SPM12) software (http://www.fil.ion.ucl.ac.uk/spm/software/spm12/) was used and the following post-processing steps were performed.Voxel-based analyses: Each parameter map was compared among the three participant groups using the voxel-wised full factorial design of one-way analysis of covariance (ANCOVA) with age as a covariate. Furthermore, the association between the voxel value of each map and either age or the K-MMSE score, with age as a covariate, was evaluated using the voxel-based multiple regression analysis.
Region-of-interest (ROI)-based analyses: The following statistical analyses were performed using this data. First, a group comparison of the ROI value was performed using ANCOVA. Second, the correlation coefficient test was performed to analyze the degree of association between the ROI values and the participant’s age or K-MMSE scores. Finally, a receiver operating characteristic (ROC) curve analysis was performed for each conductivity index for each ROI to differentiate between the groups.
Results
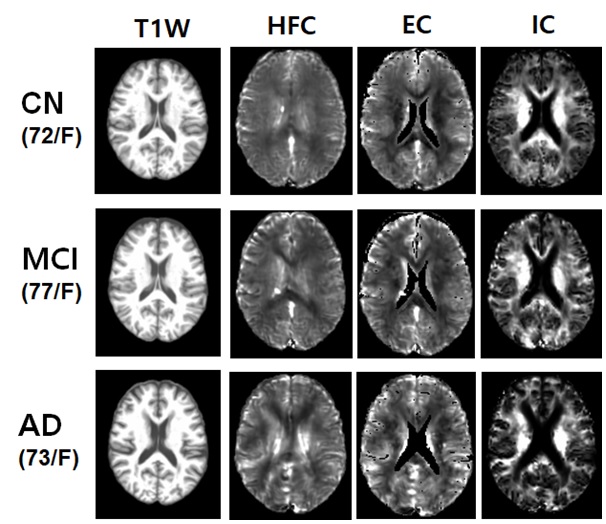
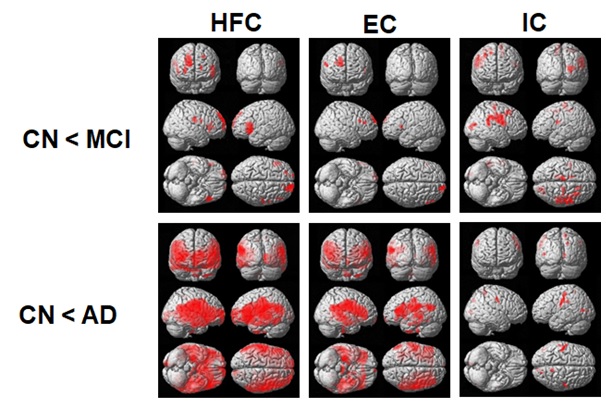
Fig 1 shows the representative T1-weighted images and the corresponding maps of HFC, EC, and IC obtained from the brain of one CN participant (a 72-year-old female), one MCI patient (a 77-year-old female), and one AD patient (a 73-year-old female). Both the HFC and EC appear brighter in the AD patient compared to the CN participant and the MCI patient at the overall slice. Compared with the CN and MCI groups, HFC and EC were higher in the AD group (Fig 2). The conductivities of both HFC and EC were increased in the AD group in the large brain areas, including the frontal, occipital, parietal, and temporal areas. The IC was increased in AD compared with CN but decreased in AD compared with MCI. Compared with the CN group, all three conductivity indices were increased in the MCI group. EC was higher in the AD group in the hippocampus (p=0.009) and insular (p=0.020). Both HFC and EC were significantly negatively associated with the K-MMSE in the insular (rho r = -0.427/p = 0.0004 for HFC, rho r = -0.426/p = 0.0004 for EC) and MTG (rho r = -0.438/p = 0.0003 for HFC, rho r = -0.365/p = 0.003 for EC), but IC were significantly positively associated with the K-MMSE in the corpus callosum (rho r = 0.370/p = 0.002). HFC and EC show significant differentiation between AD from CN and from MCI.Conclusion
The EC value was higher in patients with AD than CN elderly people and patients with amnestic MCI. The EC value decreased with increasing K-MMSE scores after adjusting for age in the insula and middle temporal gyrus. This study showed the possibility that the EC value might be used as an imaging biomarker for helping to monitor cognitive function. Because the EC value may be associated with extra-neurite ion concentration and diffusivity, MREPT may reflect neuronal loss and ion changes in AD patients. Animal studies may be required to verify our results.Acknowledgements
The research was supported by the National Research Foundation of Korea (NRF) grants funded by Ministry of Science and ICT 2020R1F1A1A01074353, M.B.L.; 2019R1A2C1004660, O.I.K.; 2020R1A2C1004749, G.H.J.), Republic of Korea.References
1.Jahng G-H, Lee MB, Kim HJ, Woo EJ, Kwon O-I. Low-frequency dominant electrical conductivity imaging of in vivo human brain using high-frequency conductivity at Larmor-frequency and spherical mean diffusivity without external injection current. NeuroImage. 2021;225:117466.
2.Kaden E, Kelm ND, Carson RP, Does MD, Alexander DC. Multi-compartment microscopic diffusion imaging. NeuroImage. 2016;139:346-59.
Figures