0963
A Multi-Modal Biomechanical Imaging and Analysis Framework for Co-Correlation of 7T MR Elastography, 7T DTI, and Amyloid Deposition1University of Washington, Seattle, WA, United States, 2Biomedical Engineering and Imaging Institute, Icahn School of Medicine at Mount Sinai, New York City, NY, United States, 3Icahn School of Medicine at Mount Sinai, New York City, NY, United States, 4Department of Neurology, Icahn School of Medicine at Mount Sinai, New York City, NY, United States
Synopsis
Keywords: Alzheimer's Disease, Alzheimer's Disease, DTI, PET
Motivation: There is currently a profound need for non-invasive early detection of mild cognitive impairment (MCI) and Alzheimer’s disease (AD).
Goal(s): The purpose of this study is to determine the relationships between imaging and cognitive testing metrics.
Approach: Subjects underwent multimodal imaging, including 7T DTI, 7T MRE, and amyloid PET, and a PACC test. These metrics were used in Shapley Regressions to determine which metrics were the best predictors of MRE or SUVR.
Results: We determined that SUVR was the best predictors of MRE metrics, and that MRE was one of the best predictors of SUVR in subjects with amyloidosis.
Impact: Using multimodal imaging at ultrahigh field (7T) we have observed preliminary relationships between amyloid deposition and biomechanical and microstructural metrics as determined by 7T MR Elastography and DTI in the human brain.
Introduction
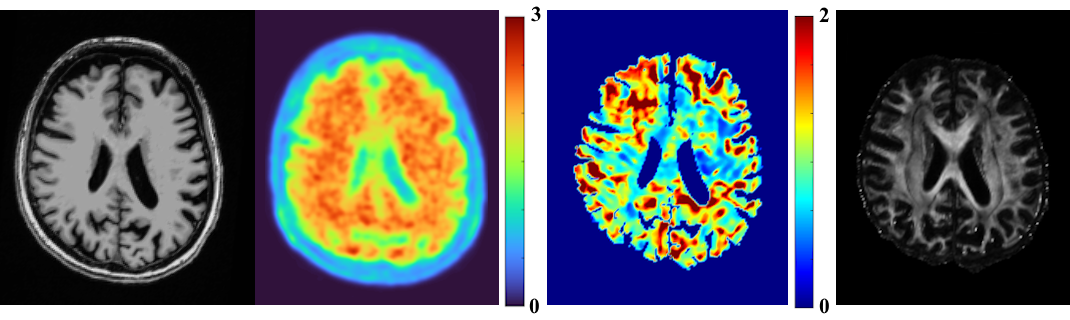
Alzheimer’s disease (AD), a progressive neurodegenerative disease thought to be caused by abnormal deposits of amyloid plaques, is the leading cause of dementia, having an immense impact on the aging population worldwide1. Over the progression of AD, damage spreads throughout the brain, shrinking the volume of the overall brain tissue2. Early diagnosis of AD is still challenging due to subtle microstructural changes, which is particularly troubling, as most treatments for AD can only be used to slow its progression, not reverse it, and are often far more successful when started early. β-amyloid can be detected through the utility of positron emission tomography (PET) with aid of a radioactive tracer or within cerebral spinal fluid acquired through a lumbar puncture. Since these two procedures are invasive, there is a profound need to identify non-invasive correlates of AD pathologies.Pivotal studies applying MRE have shown a progressive softening of white and gray matter tissue in AD patients in regions in line with the known topography of AD pathology3,4. Another potential non-invasive diagnostic tool is diffusion tensor magnetic resonance imaging (DTI), which provides a metric for understanding the integrity of microstructure5. Leveraging non-invasive tools such as ultra-high field (UHF), 7 Tesla (7T) MRI, with increased signal-to-noise ratio and improved soft tissue contrast afforded by UHF allows us to map tissue microstructure. In this study, we aim to use 7T MRE, 7T DTI, 3T amyloid-PET (Figure 1), and cognitive testing results to determine the relationships between these metrics.
Methods
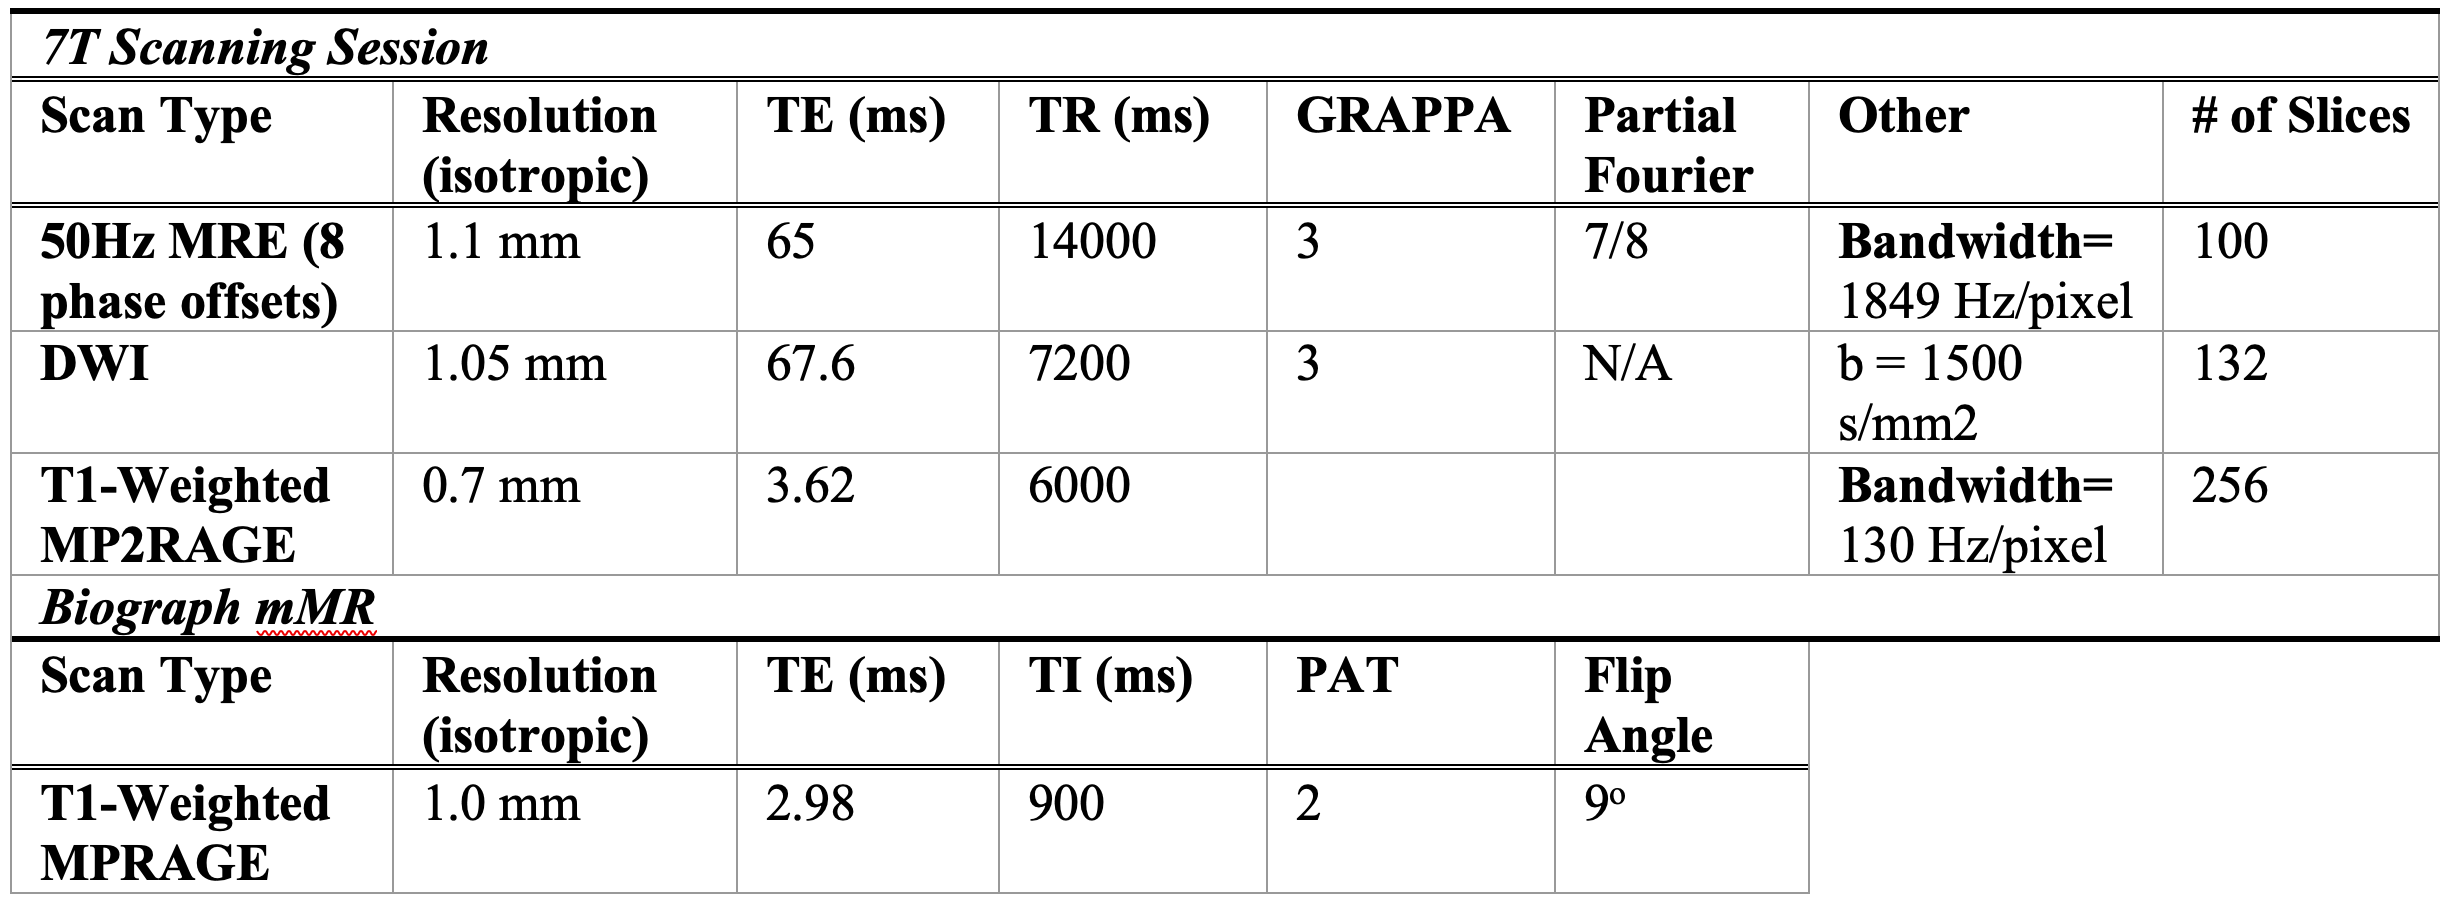
Two scanning sessions (7T MRI and 3T PET) and the Preclinical Alzheimer Cognitive Composite (PACC) test were performed on 14 subjects (Avg. age 70.3±5.2 years) determined to be cognitively normal (CN), and 6 subjects (Avg. age 70.0±9.4 years) determined to have mild cognitive impairment (MCI) or AD. All MCI/AD patients have a consensus diagnosis of cognitive impairment and a Clinical Dementia Rating >4.0 in the Clinical Dementia Rating Scale Sum of Boxes.The 7T MRI (Magnetom, Siemens) scan included a T1-weighted MP2RAGE, a high-angular-resolved diffusion-weighted imaging MRI (dMRI) sequence, and a custom SE-2D-EPI-based MRE sequence (Table 1). The DMRI series were collated into a single volume, denoised, and corrected for artifacts and distortions using MRtrix3. Whole brain tractography was generated with 10,000 seeds using tractseg, and fractional anisotropy (FA) and radial diffusivity (RD) were calculated6. For MRE, data reconstruction and processing was performed to obtain the absolute value of complex shear modulus, |G*|7. All 7T T1 images were postprocessed using FreeSurfer 7.28 for automatic segmentation and parcellation.
Subjects also underwent a Siemens Biograph mMR simultaneous PET-MR scan to measure Aβ burden using F18-labeled florbetaben using FDA-standardized protocols. Attenuation-corrected data from 90–110-minutes post-injection were measured in 1-minute intervals and motion-corrected. The resulting images were coregistered to a T1-weighted MPRAGE. Average selective uptake value ratio (SUVR), FA, RD, and |G*| were calculated per region of interest, specific to each imaging modality. Specifically, SUVR was extracted from cortical gray matter regions. All MCI/AD subjects and one CN subject were determined to be Aβ-positive. We performed multiple Shapley Regressions in four brain regions with combinations of the different imaging metrics and PACC that were acquired for each subject.
Results
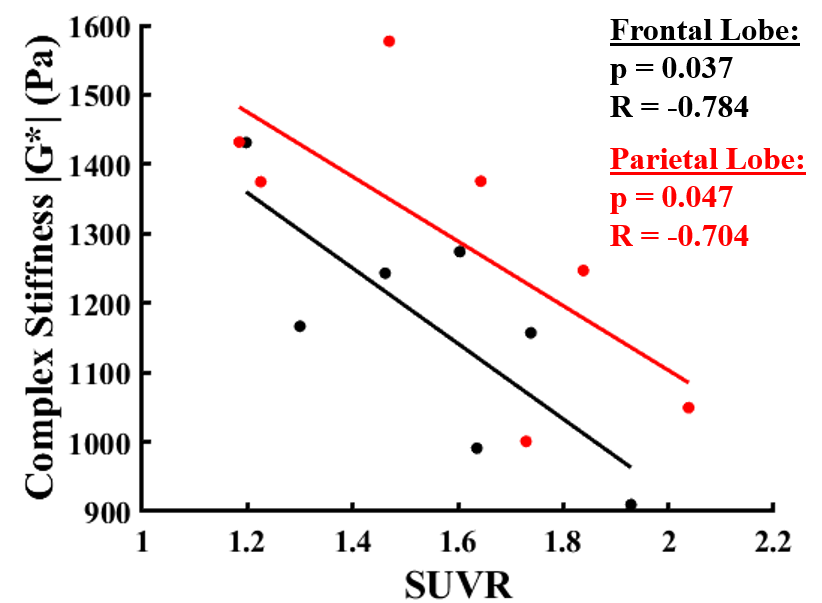
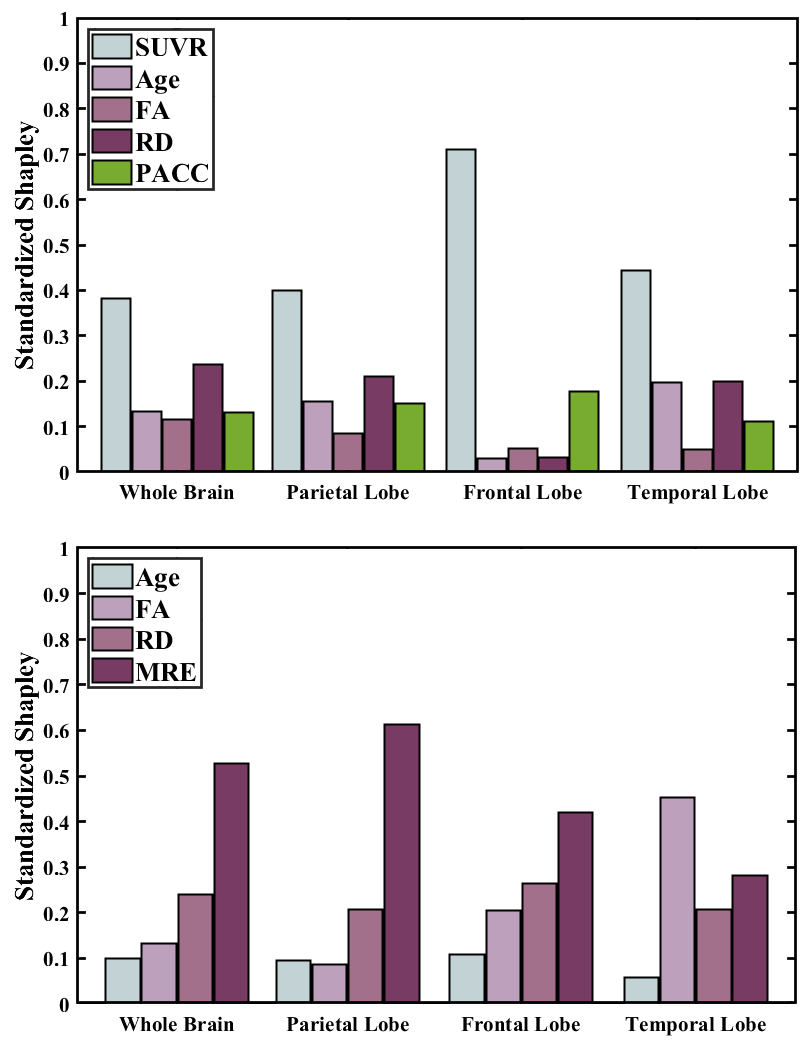
We found significant differences (one-tailed, unequal variance t-test, p<0.05) between the CN and AD/MCI groups in |G*| of the hippocampus and frontal lobe, SUVR of all brain regions investigated, and FA of the rostral and caudal middle frontal lobe, and superior temporal lobe. A significant negative correlation was found between average SUVR and |G*| in the frontal and parietal lobes in Aβ-positive subjects (Figure 2). From the Shapley Regressions (Figure 3), SUVR was the best predictor of |G*| in each region out of all metrics. Excluding PACC, |G*| was the best predictor of SUVR in Aβ-positive subjects in all brain regions tested, apart from the temporal lobe where FA was a better predictor.Discussion
Our group-wise comparison of |G*| and FA are consistent with previous literature, and the negative correlation between |G*| and SUVR in brain regions initially impacted in MCI/AD progression is also consistent with a previous investigation. Shapley regression analysis demonstrated that SUVR and |G*| were the most important covariates in their corresponding multi-regression analyses, which is promising for finding correlates of PET through MRE. A larger cohort of subjects diagnosed with MCI/AD would also broaden the statistical analyses that can be performed with all the metrics collected.Conclusion
Our multi-modal biomechanical imaging and analysis framework has promise to determine relationships between various MRI and PET measures for AD and MCI subjects, providing a physical understanding between tissue mechanics and AD pathophysiology.Acknowledgements
We acknowledge funding support from NSF CMMI 1953323, NIH R21AG071179, NIH P30AG066514, and the Sanford Grossman Interdisciplinary Center in Neural Circuitry and Immune Function.References
1. Double, K. L. et al. (1996). Topography of brain atrophy during normal aging and Alzheimer’s disease. Neurobiol. Aging 17, 513–521
2. Blinkouskaya, Y. & Weickenmeier, J. (2021). Spatiotemporal Atrophy Patterns in Healthy Brain Aging and Alzheimer’s Disease. in IMECE
3. Murphy, M. C. et al. (2016). Regional brain stiffness changes across the Alzheimer’s disease spectrum. NeuroImage Clin. 10, 283–290
4. Hiscox, L. V et al. (2019). Mechanical property alterations across the cerebral cortex due to Alzheimer’s disease. Brain Commun. 2,
5. O’Donnell, L. J., & Westin, C.-F. (2011). An Introduction to Diffusion Tensor Image Analysis. Neurosurgery Clinics of North America, 22(2), 185-196. https://doi.org/10.1016/j.nec.2010.12.004
6. Fischl, B., Liu, A., & Dale, A. M. (2001). Automated manifold surgery: constructing geometrically accurate and topologically correct models of the human cerebral cortex. IEEE transactions on medical imaging, 20(1), 70-80.
7. E. R. Triolo, M. Langan, O. Khegai, A. Alipour, C. Ferreira-Atuesta, A. Pionteck, J. Sutkowsky, T. Hedden, P. Balchandani, and M. Kurt, (2023). A Biomechanical Analysis Framework for Co-Correlation of 7T MR Elastography Measures and Amyloid Beta Deposition, Proceedings of the Joint Annual Meeting ISMRM-ISMRT, 2023.
Figures