0962
Spatial Imaging-Transcriptomic analysis reveals the Molecular Basis of diffusion MRI signature in mouse model of Alzheimer’s Disease1Department of Biomedical Engineering, Zhejiang University, Hangzhou, China, 2Zhejiang University, Hangzhou, China
Synopsis
Keywords: Alzheimer's Disease, Alzheimer's Disease, Transcriptomic, 5xFAD
Motivation: While numerous studies noted the reduction of fractional anisotropy (FA) from diffusion MRI as a sensitive marker in Alzheimer's disease, the underlying biology remained elusive.
Goal(s): We aimed to explore biological basis of DTI metrics by integrating diffusion MRI with spatial transcriptomic data from the same individual.
Approach: We performed voxelwise correlation between the co-registered transcriptomic and MRI data and downstream enrichment analysis.
Results: We revealed links to myelin, oligodendrocytes, and Alzheimer's-associated biological processes.These findings enhanced our understanding of changes of diffusion MRI in Alzheimer's disease.
Impact: Spatial imaging-transcriptomic provides a certain level of biological evidence for the molecular processes underlying DTI signatures of Alzheimer’s disease. Similar approach can be applied to other types of MRI markers in different neurodegenerative diseases.
Introduction
Diffusion MRI (dMRI) probes brain tissue microstructure and is widely used in Alzheimer's research. Prior studies noted reduced FA and increased MD (Mean Diffusivity) in Alzheimer's[1–3]. Yet, the molecular basis giving rise to the changes in dMRI remains largely unknown. Here, we utilized the recently developed spatial transcriptome technique and integrated it with dMRI to unveil underlying mechanisms from the genetic perspective. While past studies mainly focused on ROI-level correlation with genetic and imaging data from different individuals[4,5], e.g., the Allen Brain Atlas, our research highlighted MRI and spatial transcriptomic data from the same source, with voxel-level correlation to provide a more direct evidence.Method
Animal preparation
In this study, male 5xFAD and C57BL6/J wild-type mice were employed. The 5xFAD mouse model is characterized by an accelerated accumulation of amyloid-beta plaques in the brain[6]. At 8 months of age, a total of eight wild-type and eight 5xFAD mice were sacrificed. Seven whole brain brains from each group were fixed in 4% formalin, prepared for MRI scan. One remaining brain from each group was divided into two hemispheres, with one half utilized for MRI and spatial transcriptomic sequencing.Data acquisition and preprocessing
MRI data: High resolution dMRI was obtained on a 14T Bruker scanner, using an EPI sequence with the following parameters: an isotropic spatial resolution of 100 micrometers, b-values of 3000 and 6000 s/mm², 30 diffusion directions per b-value, and 6 non-diffusion-weighted measurements. Skull stripping was performed manually, followed by denoising, bias correction, and correction for eddy current effects. FA, MD, AD (Axial Diffusivity) and RD (Radial Diffusivity) were calculated using MRtrix3[7].Transcriptomic data: Two hemispheres underwent 10x spatial transcriptome (ST) Formalin-Fixed Paraffin-Embedded sequencing. Data from a coronal section at the mid-hippocampal level were obtained that contains over two thousand individual spots, and adjacent spot center points spaced at 100 micrometers apart were used to match the resolution of MRI. Over 10,000 different gene expressions were detected in total.
Group difference between 5xFAD and WT
All mice were registered to the Waxholm Space (WHS)[8] via a population-averaged template using ANTs[9]. We performed voxel-wise comparisons between the AD and control groups, followed by multiple comparison correction, utilizing the Threshold-Free Cluster Enhancement method.Spatial imaging-transcriptomic analysis
Initially, the MR image underwent manual rotation to select a slice that closely matched the ST slice via an adjacent DAPI-stained slice. Subsequently, we transformed the DAPI image, along with the transcriptomic data to the selected MRI slice (Figure1). We performed voxel-wise Spearman correlation between the differences in DTI values (e.g., ΔFA=[FAWT-FAAD]) and each of the ST values (>10,000 gene expressions). After multiple comparison correction, we ranked the genes displaying significant correlations based on their p-values. The most statistically significant genes were then selected for Gene Ontology (GO) enrichment analysis and Cell type-Specific Gene Expression Analysis (CSEA)[10]. The analysis was performed for the whole section and the cortex alone, as the cortex is the primary region affected by amyloid accumulation.Results
dMRI-based group difference
The FA values of 5xFAD mice were significantly lower than those in WT throughout the entire brain, especially in the neocortex and entorhinal cortex (Figure2). This aligns with previous research findings using the same mouse model[2]. No significant differences were observed in other DTI metrics.Spatial imaging-transcriptome correlation
We identified the top 100 genes that were correlated with ΔFA (Figure3.A), and GO enrichment analysis revealed that these genes were associated with biological processes including ensheathment of neurons, amyloid fibril formation, and astrocyte development (Fig3.B.i). Furthermore, they were linked to cellular components such as myelin sheaths and axons (Fig3.B.ii) and molecular function of tau protein binding and amyloid binding (Fig3.B.iii). Moreover, these genes were enriched on oligodendrocytes in CSEA result (Figure4). As for the similar analysis in cortex, the number of related genes were reduced to less than 30. GO BP and CC enrichment results (Figure5) were similar to the results above but much more specific to Alzheimer's disease.Discussion and conclusion
It is widely acknowledged that higher myelin content is associated with elevated FA values in the brain. Combining enrichment and cell type-specific gene expression analysis, the significant reduction in FA values in the AD group likely indicates myelin damage or the loss and degeneration of oligodendrocytes. Furthermore, related genes point towards several biological processes highly relevant to Alzheimer's disease, especially the formation of amyloid fibrils. In conclusion, this method provides a certain level of biological evidence for the molecular processes underlying DTI signatures of Alzheimer’s disease. Similar approach can be applied to other types of MRI markers in different neurodegenerative diseases.Acknowledgements
This work is supported by the National Natural Science Foundation of China (81971606, 82122032), and Science and Technology Department of Zhejiang Province (2022C03057, 202006140)References
[1] Teipel S J, Wegrzyn M, Meindl T, et al. Anatomical MRI and DTI in the Diagnosis of Alzheimer’s Disease: A European Multicenter Study. Journal of Alzheimer’s Disease, 2012, 31(s3): S33-S47.
[2] Maharjan S, Tsai A P, Lin P B, et al. Age-dependent microstructure alterations in 5xFAD mice by high-resolution diffusion tensor imaging. Frontiers in Neuroscience, 2022, 16.
[3] Goveas J, O’Dwyer L, Mascalchi M, et al. Diffusion-MRI in neurodegenerative disorders. Magnetic Resonance Imaging, 2015, 33(7): 853-876.
[4] Martins D, Giacomel A, Williams S C R, et al. Imaging transcriptomics: Convergent cellular, transcriptomic, and molecular neuroimaging signatures in the healthy adult human brain. Cell Reports, 2021, 37(13): 110173.
[5] Arnatkeviciute A, Fulcher B D, Bellgrove M A, et al. Imaging Transcriptomics of Brain Disorders. Biological Psychiatry Global Open Science, 2022, 2(4): 319-331.
[6] Jullienne A, Trinh M V, Obenaus A. Neuroimaging of Mouse Models of Alzheimer’s Disease. Biomedicines, 2022, 10(2): 305.
[7] Tournier J D, Smith R, Raffelt D, et al. MRtrix3: A fast, flexible and open software framework for medical image processing and visualisation. NeuroImage, 2019, 202: 116137.
[8] Johnson G A, Badea A, Brandenburg J, et al. Waxholm Space: An image-based reference for coordinating mouse brain research. NeuroImage, 2010, 53(2): 365-372.
[9] Avants B B, Tustison N, Song G. Advanced Normalization Tools (ANTS). Insight j, 2009, 2(365): 1-35.
[10] Xu X, Wells A B, O’Brien D R, et al. Cell Type-Specific Expression Analysis to Identify Putative Cellular Mechanisms for Neurogenetic Disorders. The Journal of Neuroscience, 2014, 34(4): 1420.
Figures
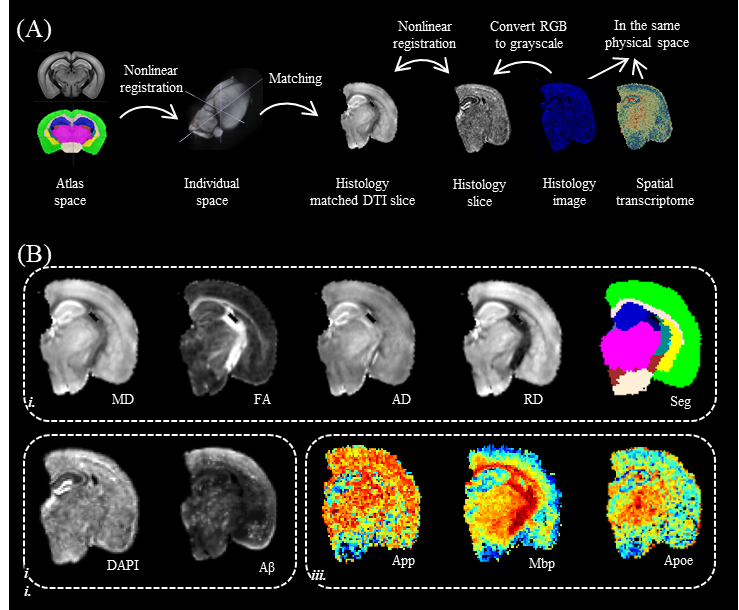
Figure 1: (A) Registration between MRI and ST slice. (B) i) the DTI metrics and WHS atlas segmentation for this slice, ii) DAPI and Aβ fluorescent protein staining, and iii) transcriptome gene expressions that were registered to the same reference space.
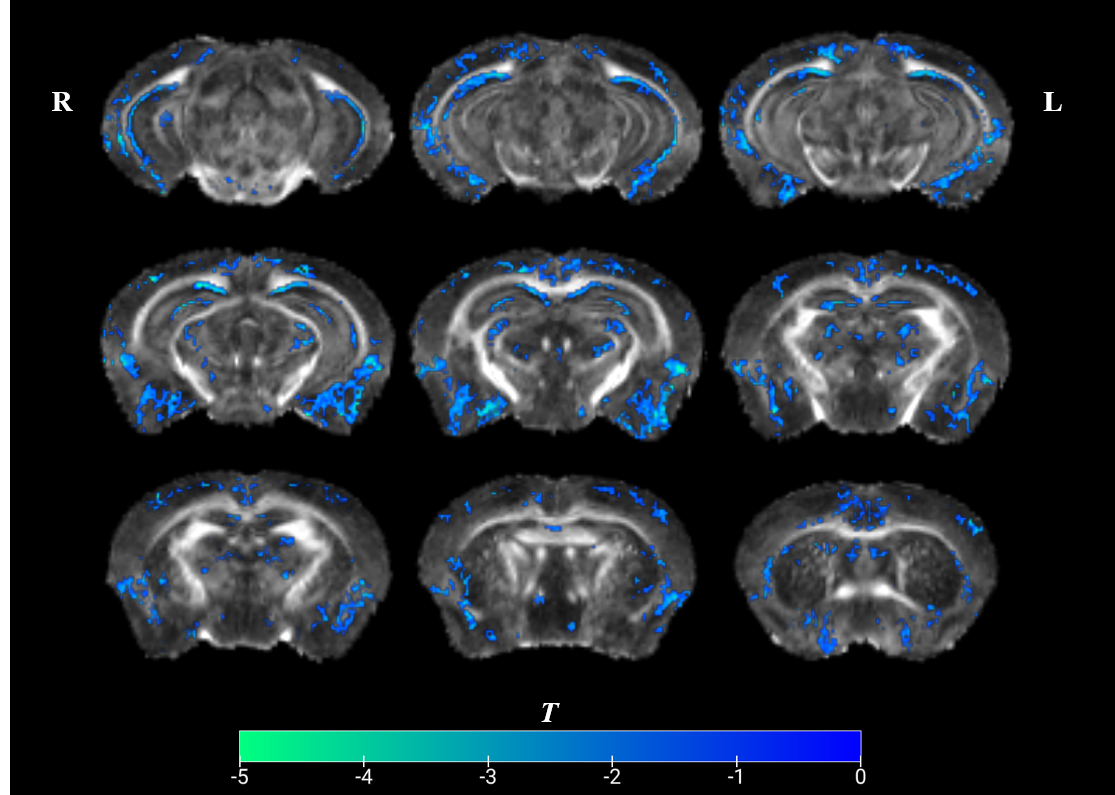
Figure 2: Voxel-based analysis showed that FA in 5xFAD mice was significantly lower across the whole brain (multiple comparison corrected p-value < 0.05). The color bars represent T statistics between groups (winter: 5xFAD < WT). Compared to WT, 5xFAD has lower FA especially in the neocortex and entorhinal cortex, while no higher FA voxels were found.
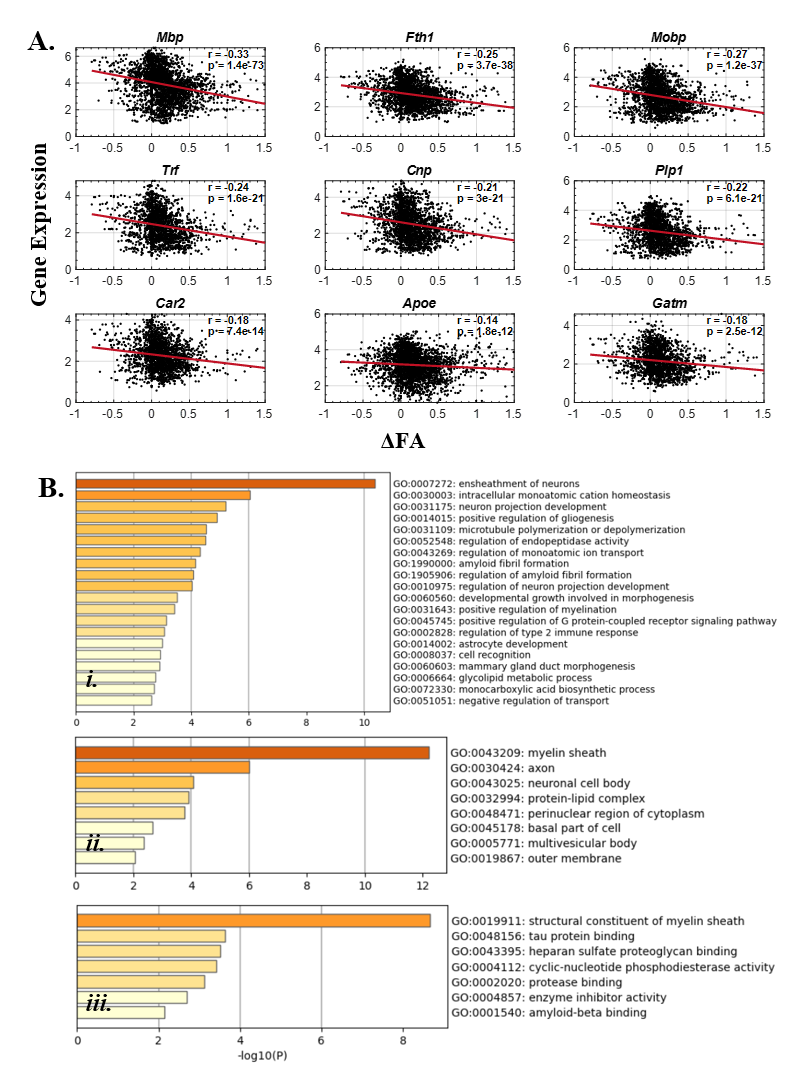
Figure 3: GO enrichment results for ΔFA negatively related genes. (A). Scatter plots of top 9 significantly correlated genes (Mbp, Fth1, Mobp, Trf, Cnp, Plp1, Car2, Apoe and Gatm). The r and p-values are shown in the plots. (B). Heatmap of i) GO Biological Processing (GO BP) enrichment ii) GO Cell Component (GO CC) enrichment and iii) GO Molecular Function (GO MF) enrichment.
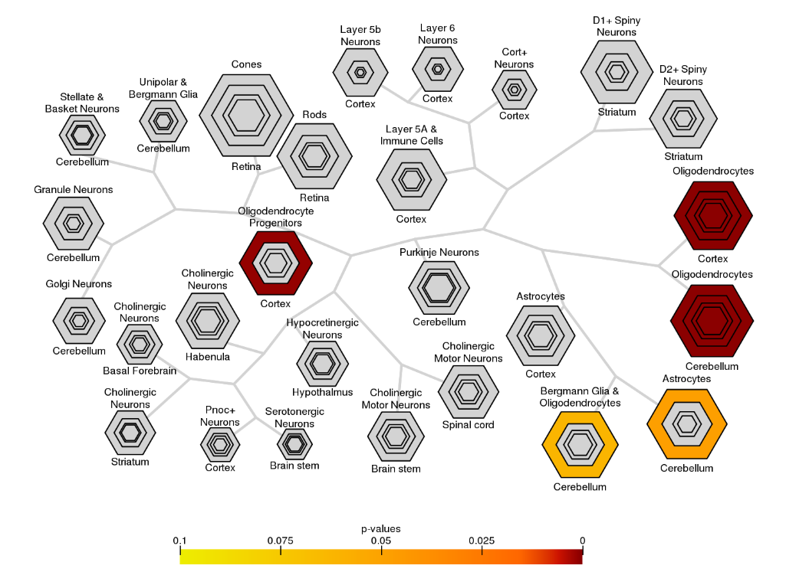
Figure 4: Bullseye plot of the output of CSEA reveals that ΔFA negatively related genes were enriched in oligodendrocytes and oligodendrocyte progenitors. For each cell type, the size of the bullseye is scaled to the number of specific and enriched transcripts at different stringency thresholds. The lower the pSI (specificity index probability), the smaller, yet more stringently specific, the transcript list will be. Bullseye is color coded by Fisher’s exact test p values as shown.
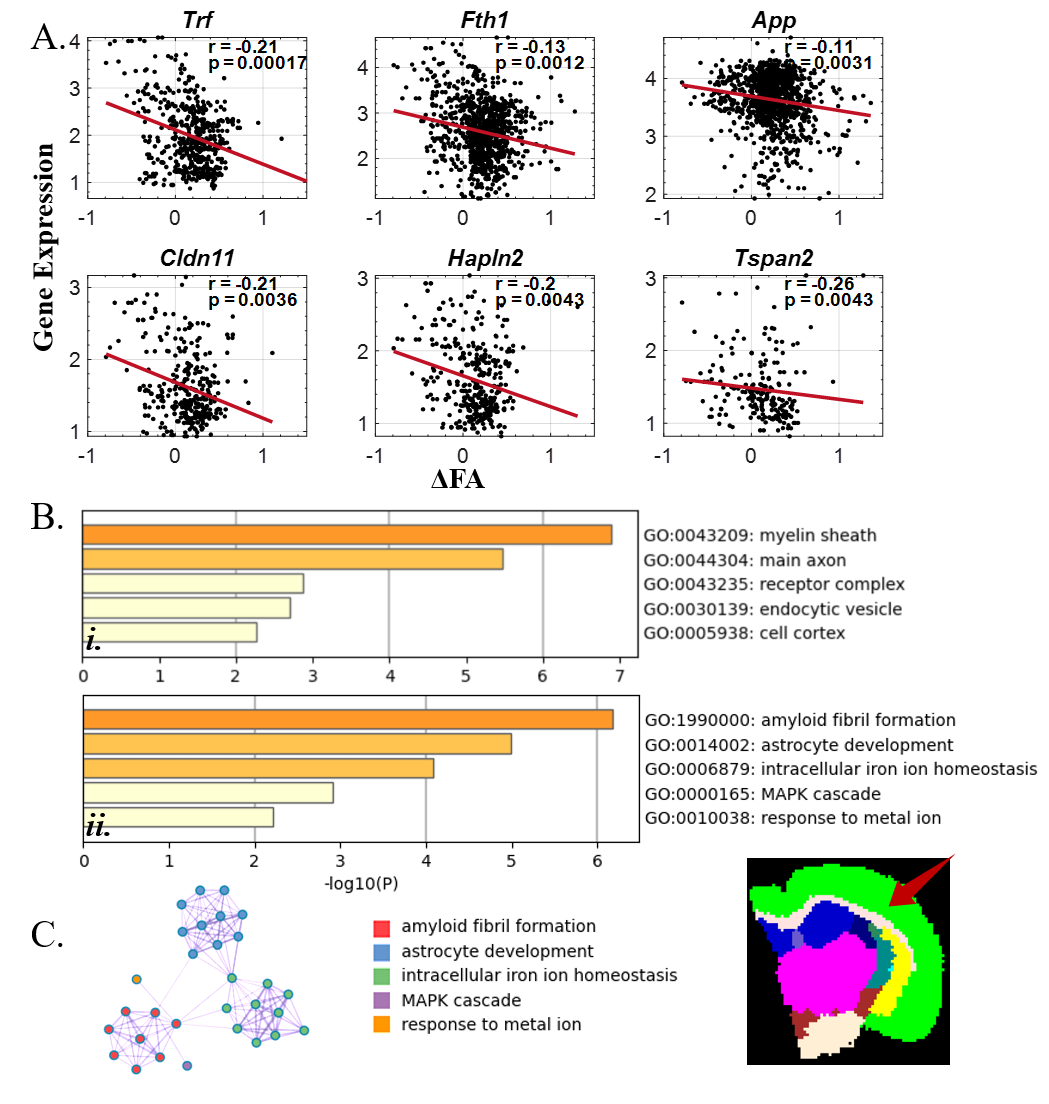
Figure 5: GO enrichment results for ΔFA negatively related genes in cortex. (A). Scatter plots of top 6 significantly correlated genes (Trf, Fth1, App, Cldn11, Hapln2 and Tspan2). The r and p-values are shown in the plots. (B). Heatmap of i ) GO Cell Component (GO CC) enrichment and ii) GO Biological Processing (GO BP) enrichment. (C) GO BP enrichment network.