0961
Topological network analysis and virtual brain modelling combined to portray subject-specific profiles of dementia stages.1Digital Neuroscience Centre, IRCCS Mondino Foundation, Pavia, Italy, 2Brain and Behavioral Sciences, University of Pavia, Pavia, Italy, 3IRCCS Mondino Foundation, Pavia, Italy, 4Advanced Imaging and Artificial Intelligence Center, IRCCS Mondino Foundation, Pavia, Italy, 5Unit of Behavioral Neurology, IRCCS Mondino Foundation, Pavia, Italy, 6University Institute of Advanced Studies (IUSS), Pavia, Italy, 7NMR Research Unit, Queen Square Multiple Sclerosis Centre, Department of Neuroinflammation, UCL Queen Square Institute of Neurology, London, United Kingdom
Synopsis
Keywords: Alzheimer's Disease, Modelling, Virtual Brain modelling, biomarkers, brain dynamics, excitatory/inhibitory balance
Motivation: The high level of heterogeneity typical of mild cognitive impairment (MCI) condition currently hinders the selection of a personalized effective therapy.
Goal(s): Our goal is to obtain a personalized profile exploring not only structural and functional topology but also diving in subject-specific physiological parameters.
Approach: Starting from structural and functional connectomes, we combined graph theoretical analysis with virtual brain models in the default mode network of healthy subjects, MCI and Alzheimer's disease patients.
Results: Our results offer a detailed description of alterations at single-subject level, illustrating differences between dementia stages based on topology and subject-specific physiological parameters.
Impact: The personalized profile obtained combining graph theory and virtual brain models portray dementia stages at single-subject level, capturing the wide heterogeneity of mild cognitive impairment and opening new perspectives for personalized effective interventions.
Introduction
The thin bridge between normal cognition and dementia is defined as mild cognitive impairment (MCI), an intermediate clinical condition whose heterogeneity hinders the definition of a personalized effective therapy1. At present, a deeper understanding of subject-specific neurophysiological changes (i.e., excitatory/inhibitory balance–E/I) is still missing, and the need to prevent MCI evolution into dementia prompts the search for new biomarkers. Therefore, in this work we combined the outputs of graph theory and Virtual Brain model (TVB)2,3 analysis of the default mode network (DMN)4, aiming to identify personalized biomarkers of dementia stages (MCI, Alzheimer’s disease-AD) for single-subject profiling. Given the heterogeneity of MCI patients, this advanced personalized approach has real potential for clinical translation and may prove useful for tailored interventions.Methods
Subjects: 18 healthy controls (HC) (9f, 69±5y), 10 AD (8f, 70±8y) and 15 MCI (9f, 76±6y, checked for CSF biomarkers) underwent MRI using a 3T Siemens Skyra scanner, including: resting-state fMRI (rs-fMRI) (GE-EPI, TR/TE=2400/30ms; voxel=3x3x3mm3, 200 volumes), diffusion-weighted imaging (SE-EPI, TR/TE=8400/93ms, voxel=2.5x2.5x2.5mm3, b=1000/2000s/mm2 with 30 directions each, 7 b0-images), and 3DT1-weighted volume (MPRAGE, TR/TE/TI=2.3/2.96/900ms, voxel=1x1x1mm3). Patients underwent a neuropsychological examination to assess global cognitive status (Mini-Mental State Examination, MMSE) and performance in multiple domains sensitive to cognitive impairment.Preprocessing and tractography: Diffusion-weighted and rs-fMRI images were preprocessed. Whole-brain anatomically-constrained tractography5 was performed estimating fiber orientation distributions with multi-tissue constrained spherical deconvolution and probabilistic tractography6.
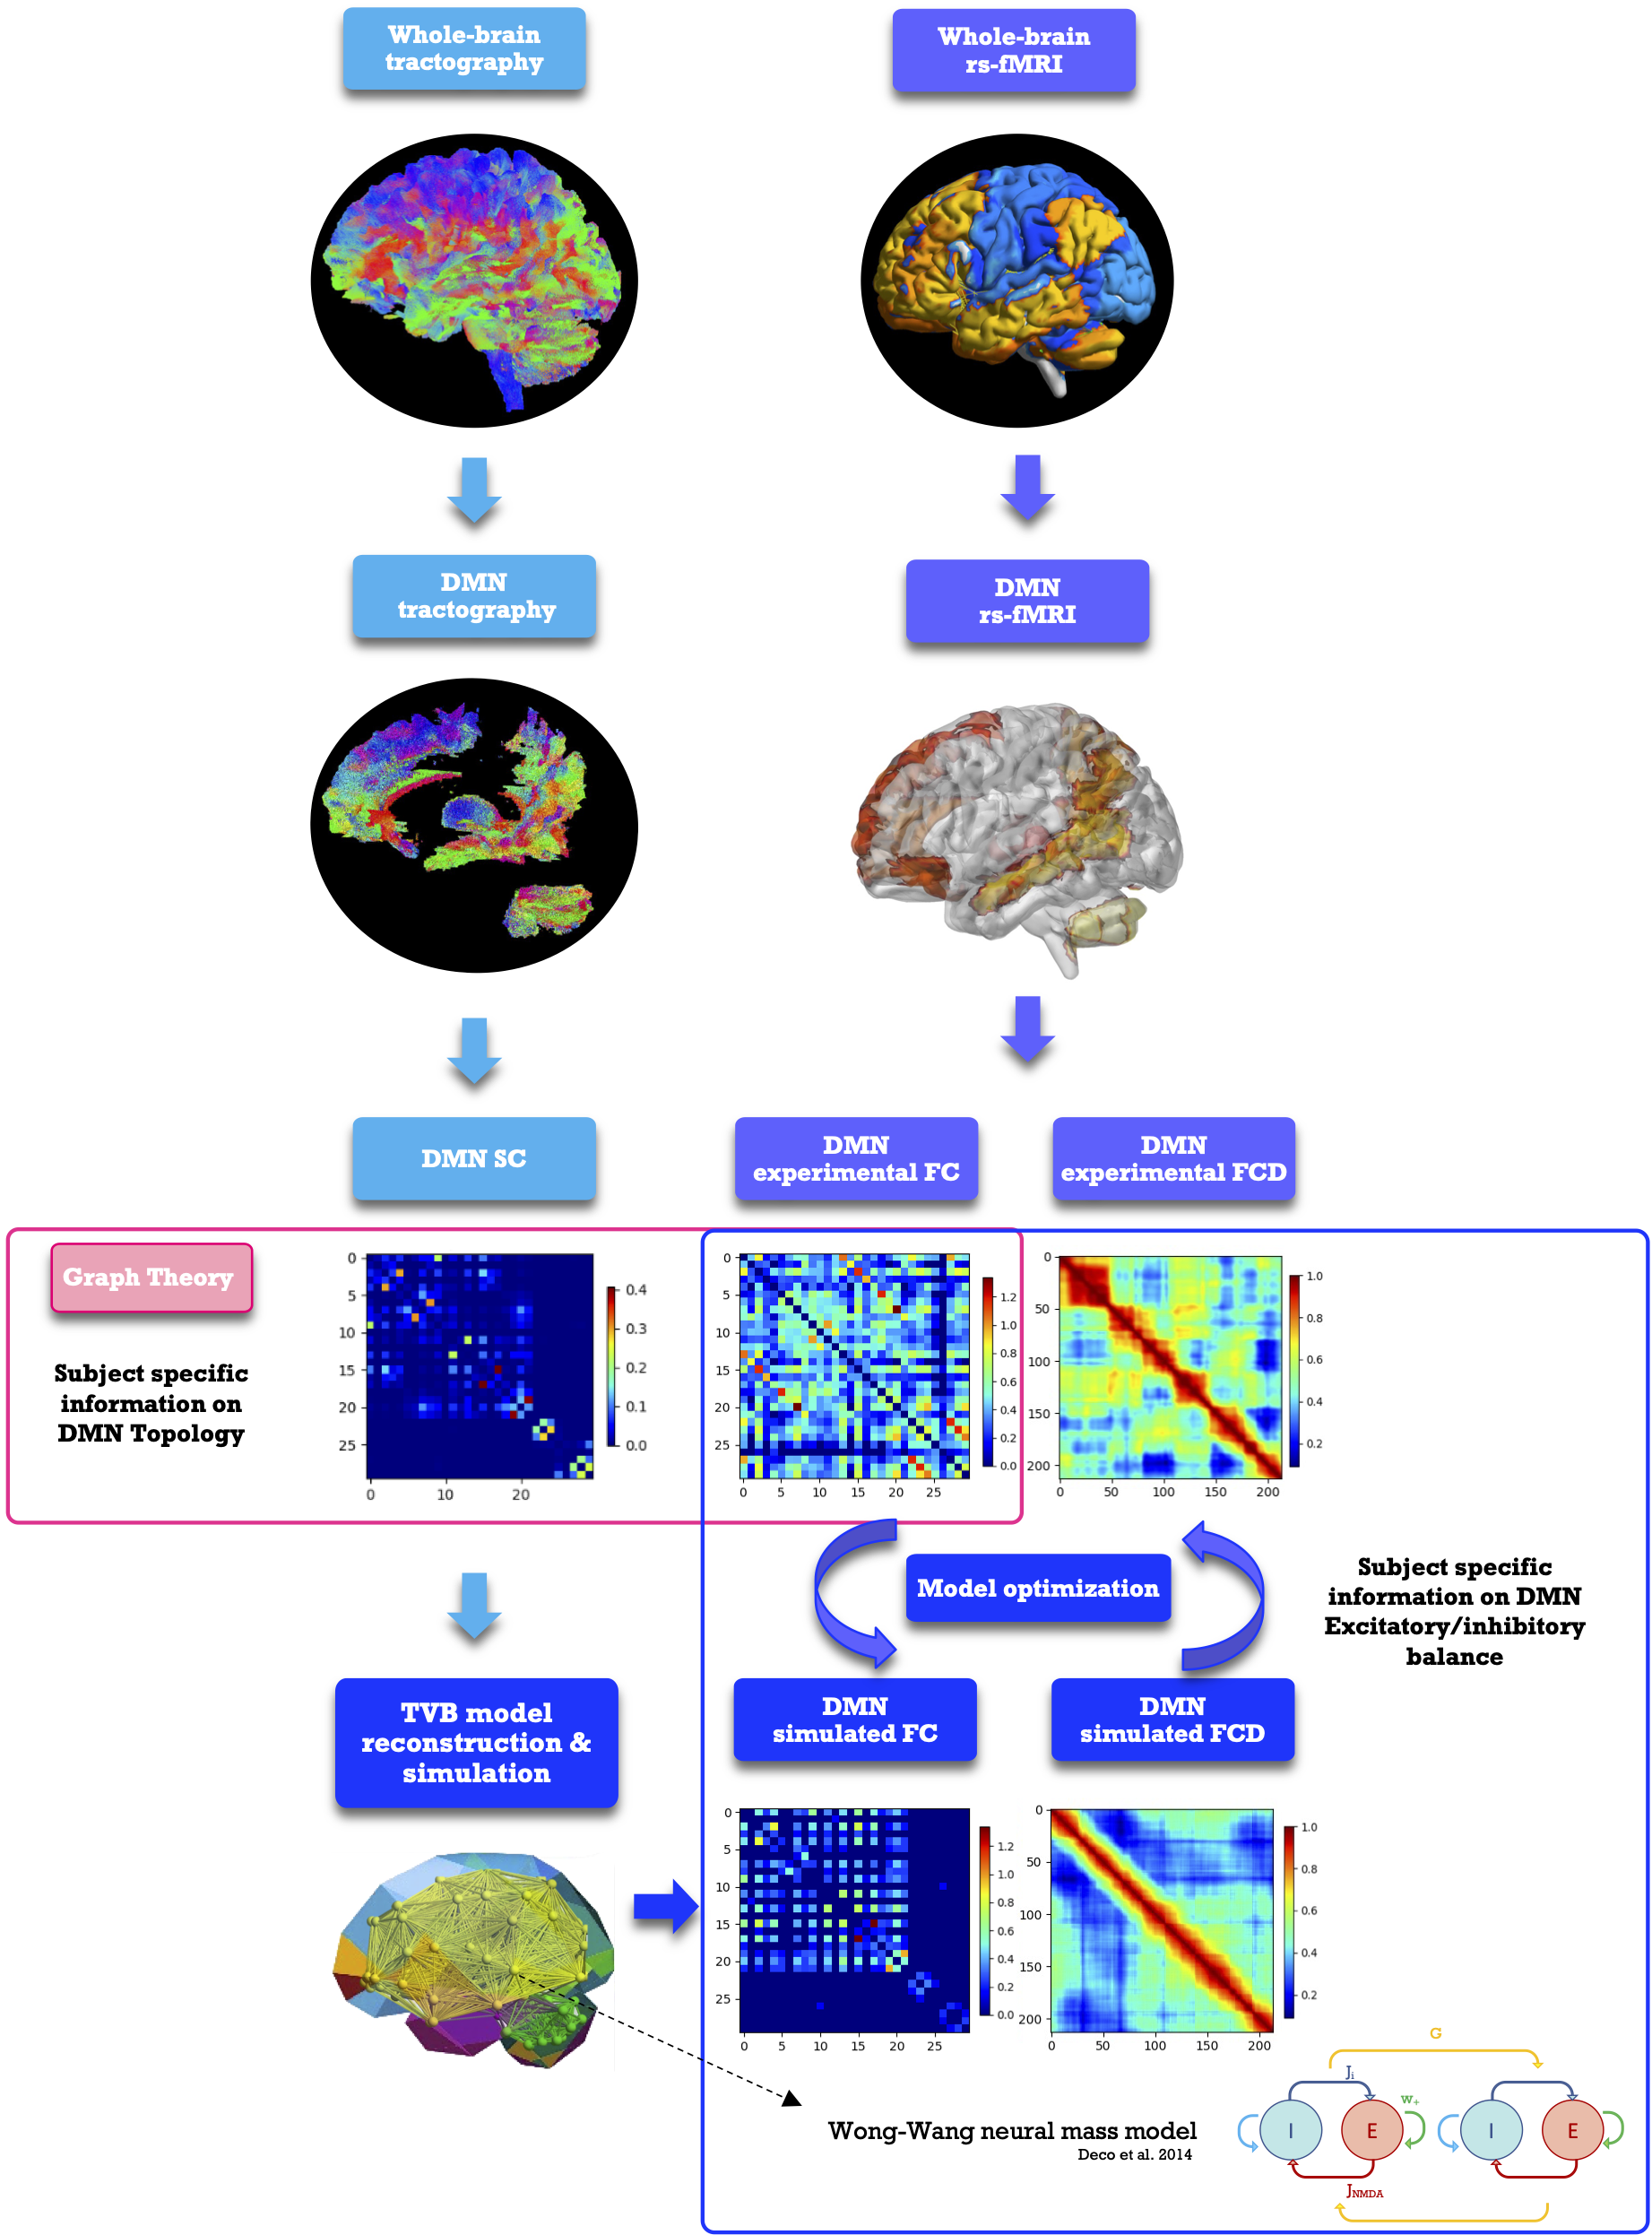
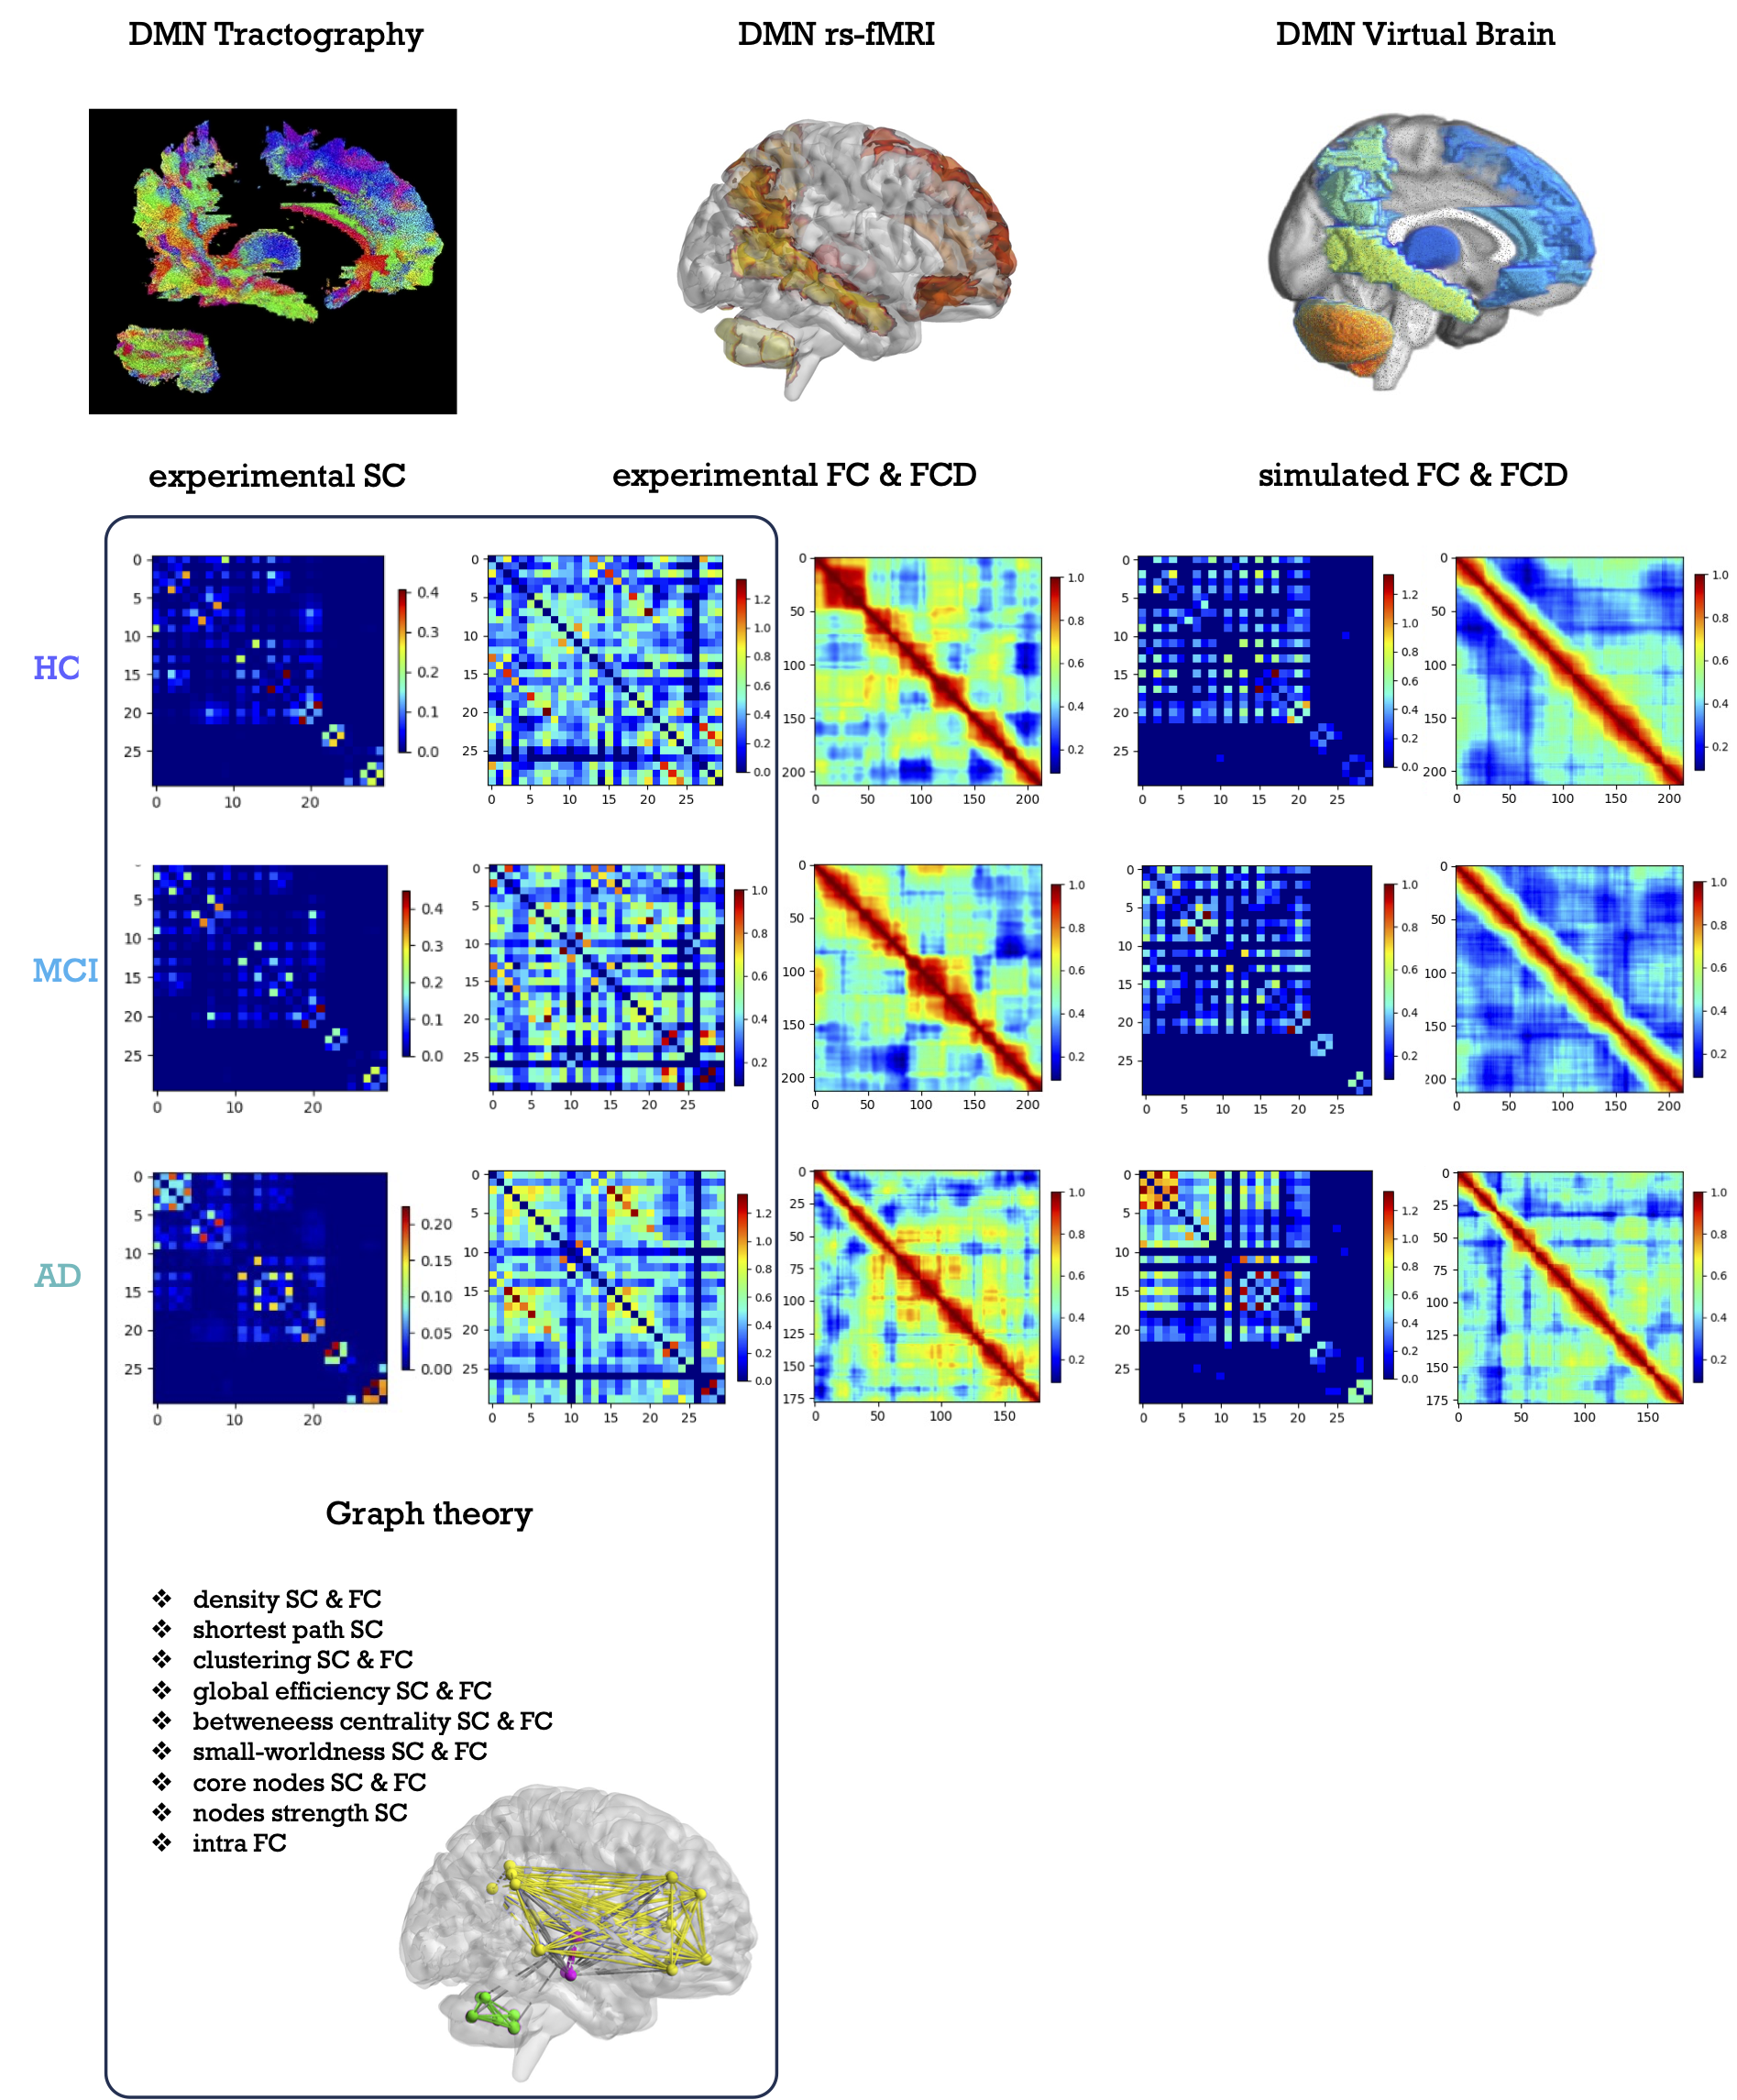
Structural connectivity (SC) and experimental functional connectivity (expFC) matrices: An ad-hoc atlas was created combining 93 cortical/subcortical cerebral (AAL7) and 31 cerebellar (SUIT8) labels. DMN nodes were selected from the ad-hoc atlas according to Buckner9 and Yeo10 atlases. DMN nodes were used to parcellate whole-brain tractography leading to a DMN SC matrix weighted by the normalized number of streamlines. The time-course of BOLD signals was extracted from rs-fMRI data for each DMN node and both static (expFC) and dynamic (expFCD) FC were reconstructed from experimental data (Fig.1). DMN topological organization was assessed applying graph theory analysis to SC and expFC (Fig.2).
TVB simulation: Analysis was conducted at single-subject level (Fig.1). TVB nodes were represented by the Wong-Wang model11, leading to an explicit representation of DMN dynamics and E/I balance in single subjects. Model parameters were tuned to gain a description of global coupling (G), excitatory (JNMDA) and inhibitory (Ji) synaptic strength, and recurrent excitation (w+). At each iteration of the tuning process, simulated FC (simFC) and FCD (simFCD) were computed (Fig.2). Parameters were adjusted iteratively to maximize matching between simulated and experimental FC and FCD12.
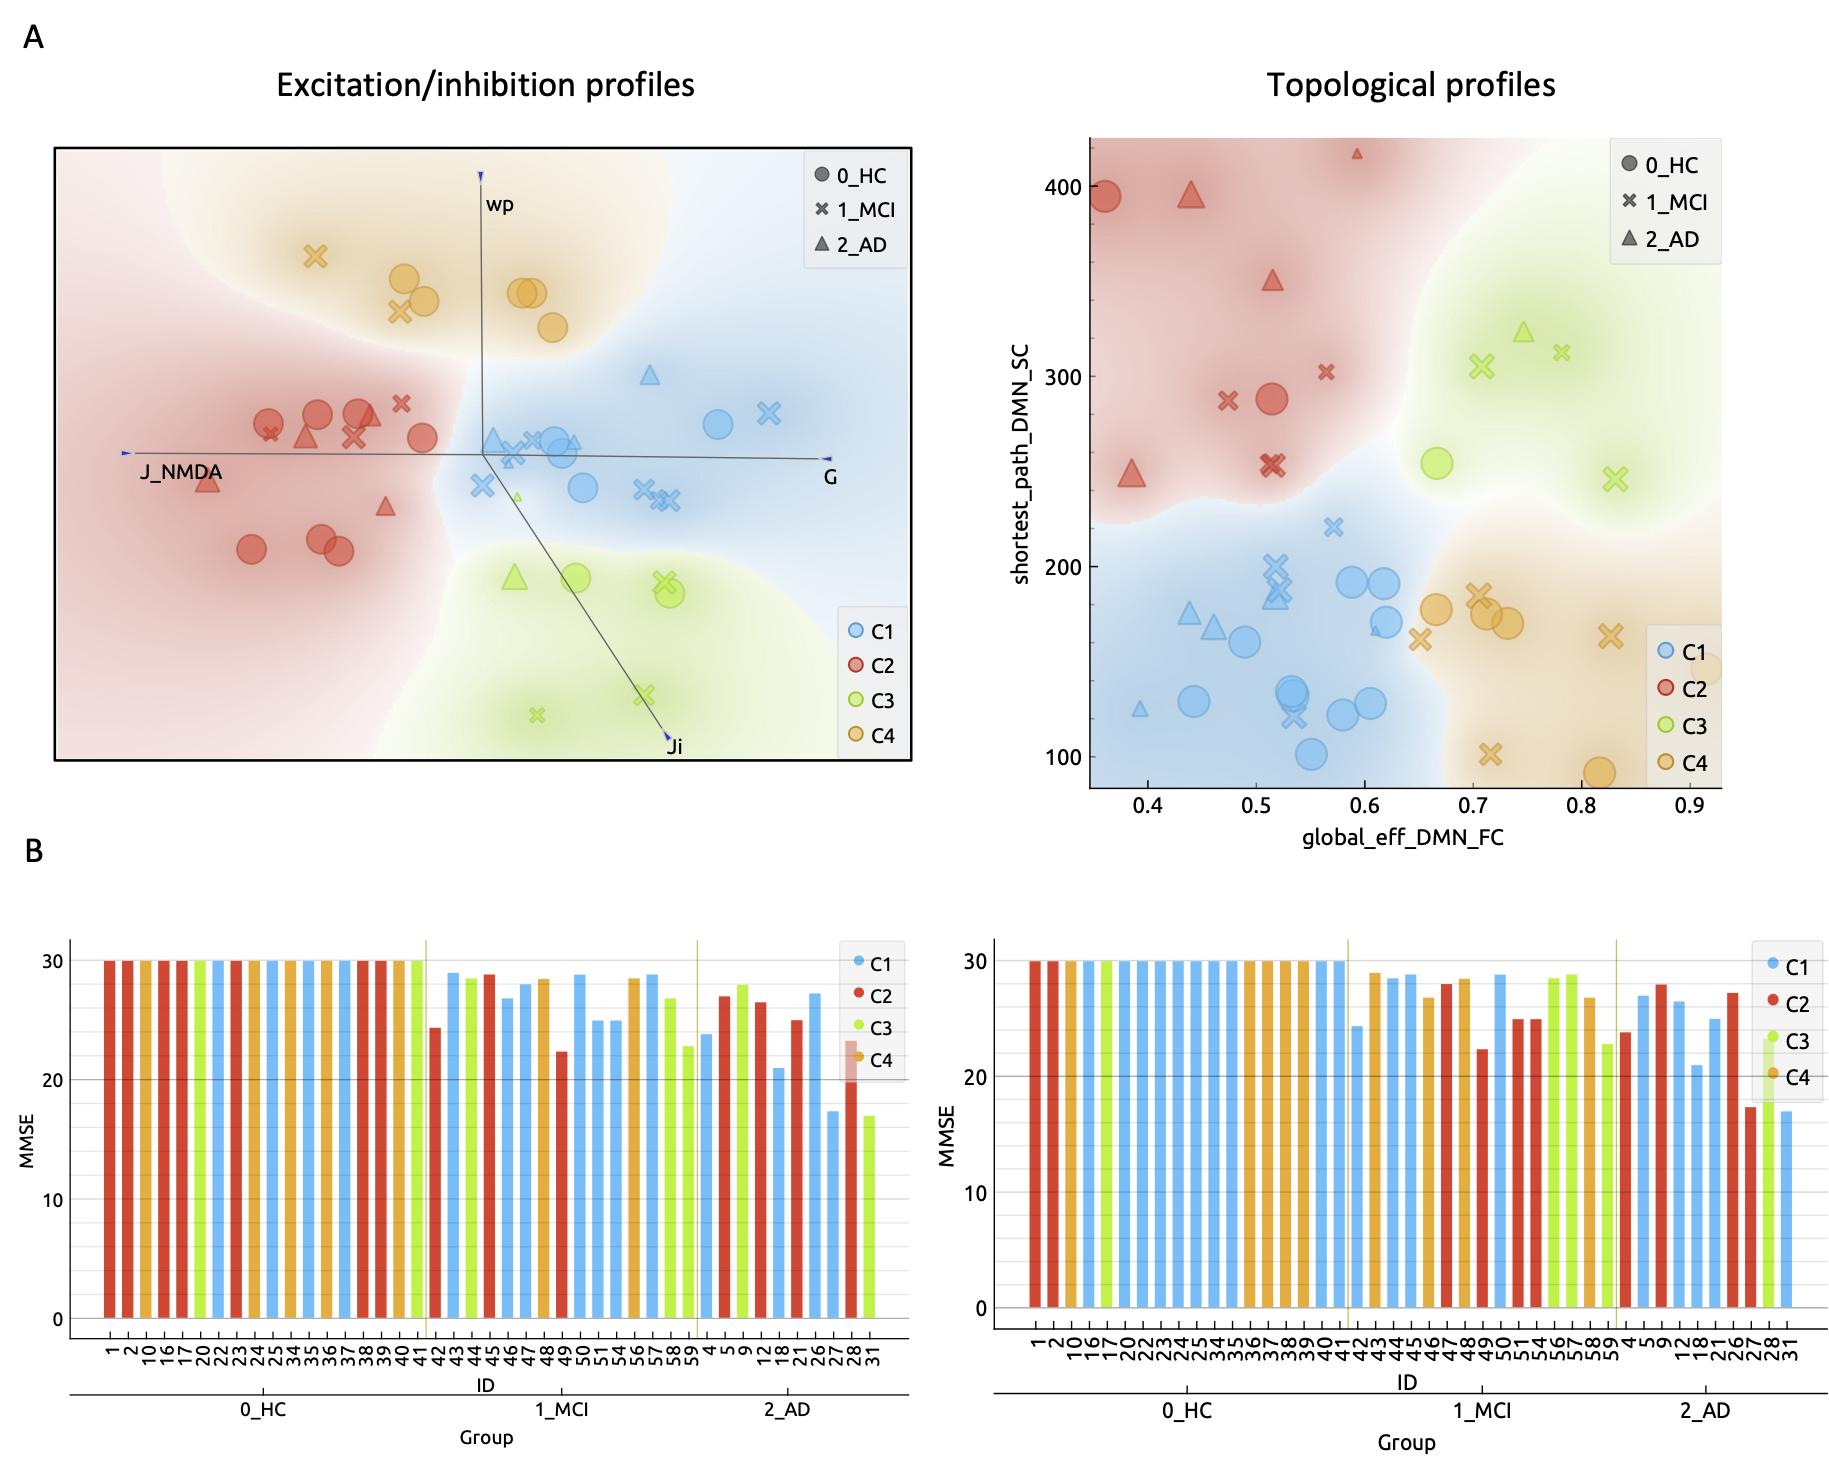
Statistics (SPSSv21, Orange3): General linear model was used to assess differences between groups (HC, MCI, AD). Machine learning algorithms (random forest–RF and support vector machine–SVM) were combined13 to test the classification power of both topological and TVB-derived parameters. A multiple regression analysis was performed to investigate the relationship between neuropsychological scores and the combination of graph theory measures and TVB parameters. K-mean clustering was performed to reconstruct subjects-specific metabolic and topological profiles.
Results
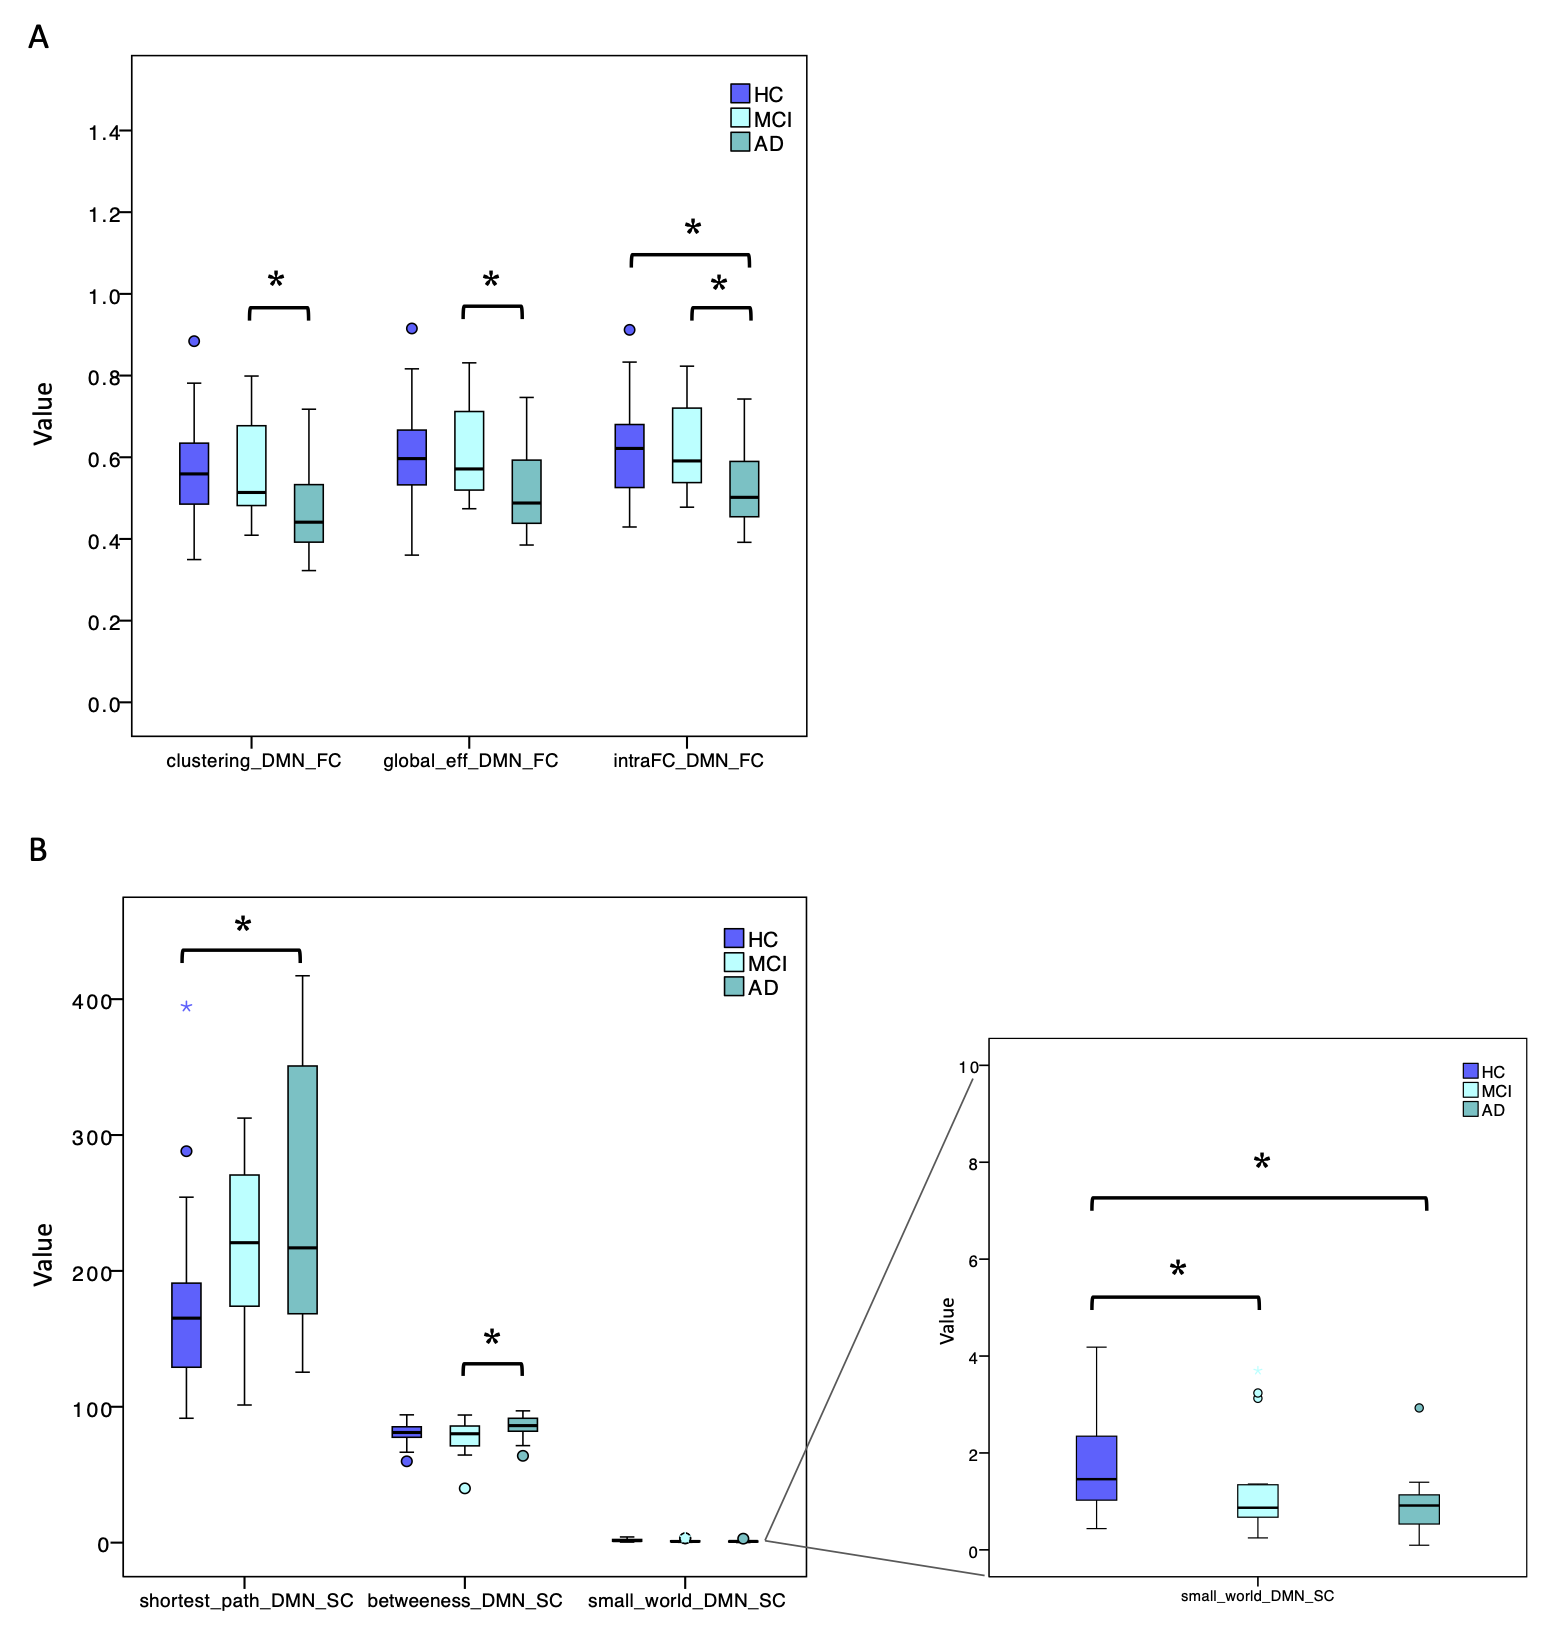
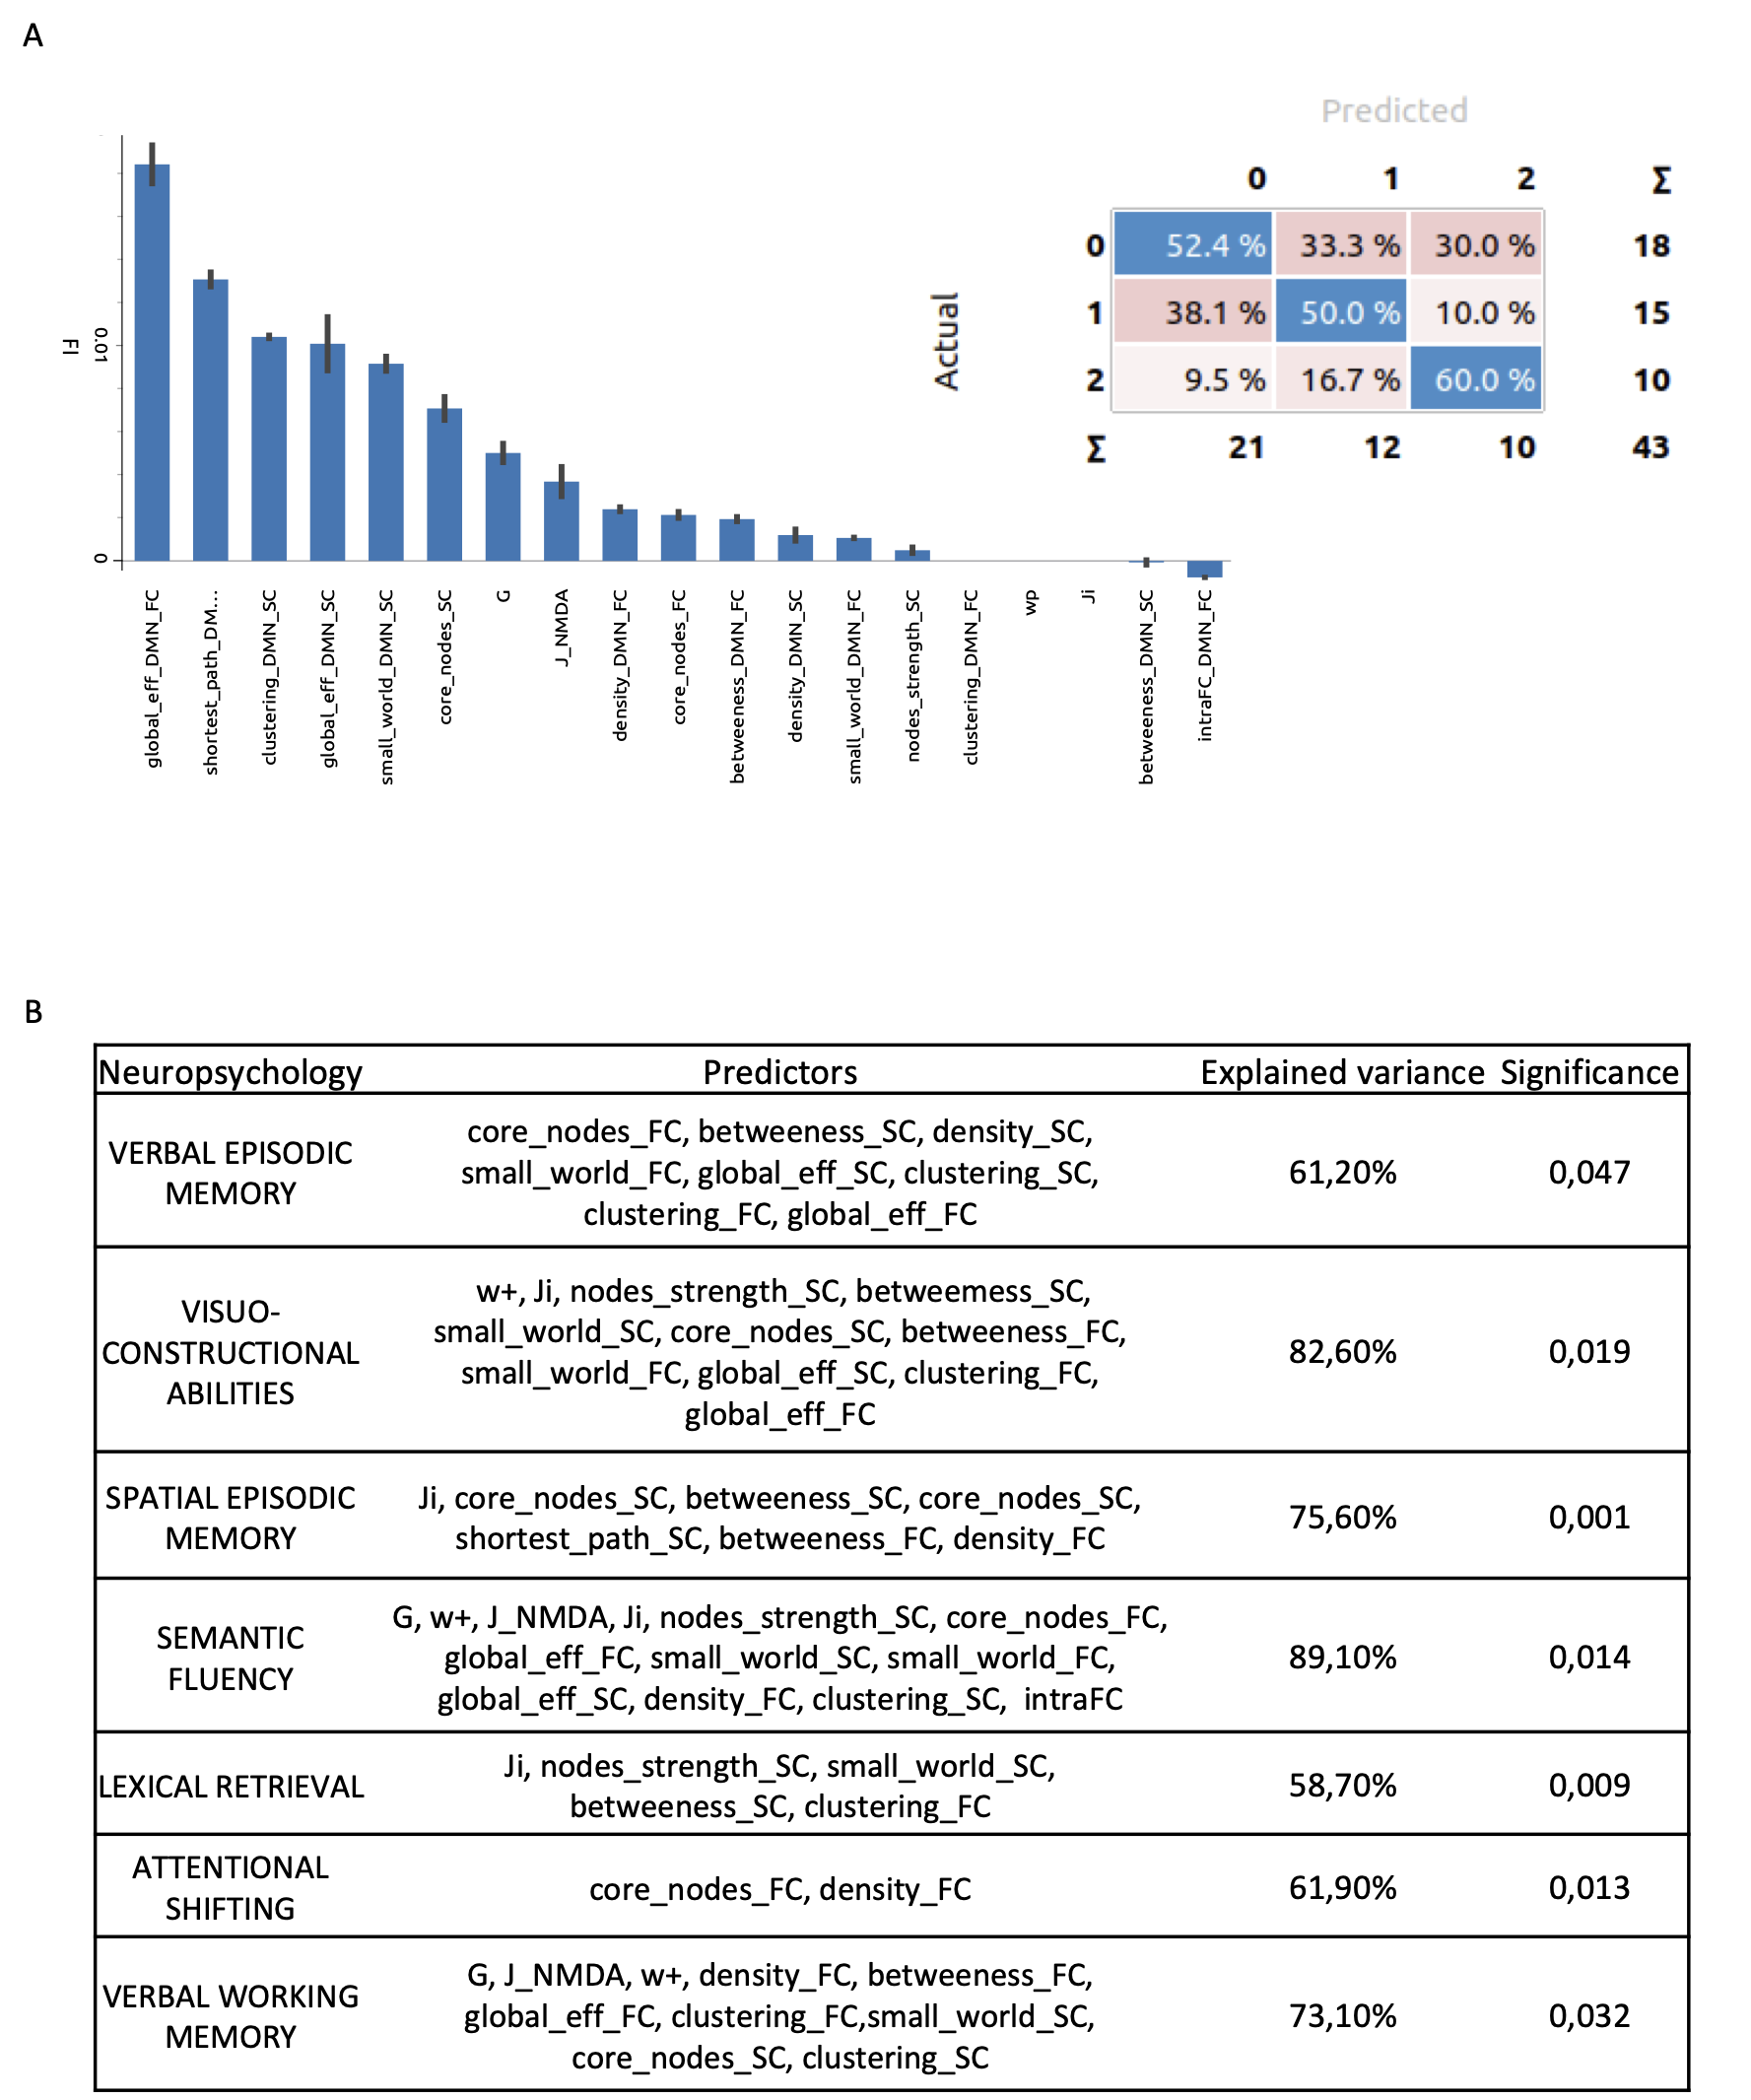
Graph theory measures were different between dementia stages, showing a decrease in clustering coefficient, global efficiency and intra connectivity of FC (Fig.3A), and an increased shortest path and betweenness centrality as well as a decreased small worldness in SC (Fig.3B). RF detected both topological and TVB parameters as relevant for classification, and SVM with the 2 most informative features reached 73% of specificity (Fig.4A). Interestingly, the combination of topology and E/I balance best explained the variance of neuropsychological scores, reaching almost 90% in cognitive domains related to DMN activity (Fig.4B). Clustering analysis revealed personalized profiling based on E/I or topology at single-subject level, capturing heterogeneity across subjects (Fig.5).Discussion
Our results offer a detailed description of alterations at single-subject level, illustrating differences between dementia stages based on topology and physiological descriptors. Topological measures revealed a loss of both segregation and integration suffered by DMN with advanced dementia. Interestingly, graph theory measures and TVB parameters presented a significant discriminant power, holding the potential for a new type of clinical classification based on personalized network models and advanced MRI features. Moreover, the combined topological and E/I assessment was strongly associated with subjective cognitive performance, underlining the link between DMN disruption and cognitive worsening. Clustering analysis identified typical profiling in the population, leading to a unique description of subject-specific features that can be used for a tailored interventional workflow. Overall, the personalized information gained with this work opens new prospectives for the identification of subjects who can benefit from early intervention, introducing a new approach that could even be applied to evaluate the effectiveness of drugs or neuromodulation treatments.Acknowledgements
This work was performed at the IRCCS Mondino Foundation and was supported by the Italian Ministry of Health (SG-2021-12374430) to AM. The project was supported by H2020 Research and Innovation Action Grants Human Brain Project 785907 and 945539 (SGA2 and SGA3) to ED’A and FP. Moreover, the project was supported by the MNL Project “Local Neuronal Microcircuits” of the Centro Fermi (Rome, Italy), #NEXTGENERATIONEU (NGEU) and funded by the Ministry of University and Research (MUR), the National Recovery and Resilience Plan (NRRP), project MNESYS (PE0000006) to ED’A; Horizon2020 [Research and Innovation Action Grants Human Brain Project 945539 (SGA3)], BRC (#BRC704/CAP/CGW), MRC (#MR/S026088/1), Ataxia UK, Rosetrees Trust (#PGL22/100041 and #PGL21/10079) to CW-K. CGWK is a shareholder in Queen Square Analytics Ltd.References
1. Roberts R, Knopman DS. (2013) Classification and epidemiology of MCI. Clin Geriatr Med. 29(4):753-72.
2. Sanz-Leon P, Knock SA, Spiegler A, Jirsa VK (2015) Mathematical framework for large-scale brain network modeling in The Virtual Brain. Neuroimage 111:385–430
3. Sanz-Leon P, Knock SA, Woodman MM, Domide L, Mersmann J, Mcintosh AR, Jirsa V (2013) The virtual brain: A simulator of primate brain network dynamics. Front Neuroinform 7.
4. Hohenfeld, C., Werner, C.J. and Reetz, K. (2018) ‘Resting-state connectivity in neurodegenerative disorders: Is there potential for an imaging biomarker?’, NeuroImage: Clinical, 18(February), pp. 849–870.
5. Smith RE, Tournier JD, Calamante F, Connelly A (2012) Anatomically-constrained tractography: Improved diffusion MRI streamlines tractography through effective use of anatomical information. Neuroimage 62:1924–1938
6. Tournier JD, Calamante F, Connelly A (2012) MRtrix: Diffusion tractography in crossing fiber regions. Int J Imaging Syst Technol 22:53–66.
7. Tzourio-Mazoyer, N., Landeau, B., Papathanassiou, D., Crivello, F., Etard, O., Delcroix, N., et al. (2002). Automated anatomical labeling of activations in SPM using a macroscopic anatomical parcellation of the MNI MRI single-subject brain. Neuroimage 15, 273–289.
8. Diedrichsen J, Balsters JH, Flavell J, Cussans E, Ramnani N (2009) A probabilistic MR atlas of the human cerebellum. Neuroimage 46:39–46
9. Buckner, R.L., Krienen, F.M., Castellanos, A., Diaz, J.C. and Thomas Yeo, B.T. (2011) ‘The organization of the human cerebellum estimated by intrinsic functional connectivity’, Journal of Neurophysiology, 106(5), pp. 2322–2345.
10. Yeo T, B.T., Krienen, F.M., Sepulcre, J., Sabuncu, M.R., Lashkari, D., Hollinshead, M., et al. (2011) ‘The organization of the human cerebral cortex estimated by intrinsic functional connectivity’, Journal of Neurophysiology, 106(3), pp. 1125–1165.
11. Deco G, Ponce-Alvarez A, Hagmann P, Romani GL, Mantini D, Corbetta M (2014) How local excitation-inhibition ratio impacts the whole brain dynamics. J Neurosci 34:7886–7898.
12. Kong, X., Kong, R., Orban, C., Wang, P., Zhang, S., Anderson, K., et al. (2021) ‘Sensory-motor cortices shape functional connectivity dynamics in the human brain’, Nature Communications, 12(1).
13. Triebkorn P, Stefanovski L, Dhindsa K, Diaz-Cortes MA, Bey P, Bülau K, Pai R, Spiegler A, Solodkin A, Jirsa V, McIntosh AR, Ritter P Alzheimer's Disease Neuroimaging Initiative. (2022) Brain simulation augments machine-learning-based classification of dementia. Alzheimers Dement (N Y). 15;8(1):e12303.
Figures