0957
Dynamic interleaved radial amine CEST and sodium (INTERLACED) at 3T1Radiological Sciences, UCLA, Brain Tumor Imaging Laboratory, Los Angeles, CA, United States, 2Radiological Sciences, UCLA, Magnetic Resonance Research Laboratories, Los Angeles, CA, United States, 3NMR Laboratory, Neuromuscular Investigation Center, Institute of Myology, Paris, France, 4Bioengineering, UCLA, Los Angeles, CA, United States, 5Neurosurgery, David Geffen School of Medicine, UCLA, Los Angeles, CA, United States
Synopsis
Keywords: Data Acquisition, Non-Proton
Motivation: Sodium (23Na) and advanced 1H MRI provides valuable metabolic information but are not routinely used because of the required additional scan time.
Goal(s): Employ the idle times in 23Na MRI to perform 1H measurements, reducing total scan time.
Approach: An interleaved radial amine CEST and sodium pulse sequence was developed to simultaneously acquire acidity or T2* maps simultaneously with salinity maps in phantoms and in the lower leg during an exercise paradigm.
Results: A scan reduction of 46% relative to sequential acquisitions. Dynamic T2*, acidity and sodium changes were successfully tracked and in line with the expected physiological responses.
Impact: The achieved scan time reduction could facilitate the inclusion of sodium and advanced 1H imaging in clinical routine. Furthermore, it could benefit functional studies by providing dynamic multinuclear information simultaneously from the same transient state.
Purpose
Sodium (23Na) and advanced 1H imaging techniques provide valuable metabolic information but are not routinely used because of the required additional scan time. The idle times in 23Na MRI could be used to perform 1H measurements1,2, reducing scan time.An interleaved radial amine CEST and sodium (INTERLACED) pulse sequence is proposed to simultaneously acquire acidity or T2* and salinity maps without applying hardware modifications. We present phantom and data acquired dynamically in the leg during an exercise paradigm.
Methods
Experiments were done at 3T (Prisma, Siemens) on 5 volunteers (28.4±6.2 y.o.) using a dual-tuned 1H/23Na birdcage coil (RAPID).Saline solutions
Two phantom sets were prepared with varying pH, sodium and gadolinium concentrations as described in table 1.
Exercise paradigm
Straight-leg plantar flexions were performed inside the coil using an elastic rubber band. The first exercise lasted 5 minutes and subjects were instructed to reach a maximum level of fatigue. Eight minutes later a second exercise was performed where plantar flexions were performed until reaching intense levels of fatigue. The subject would then hold an isometric contraction for as long as possible. Dynamic MR measurements were performed during the initial 6 and 10 minutes of recovery for the first and second exercises, respectively, and during the isometric contraction.
Interleaved NMR
INTERLACED is described in figure 2. For each magnetization transfer ratio asymmetry (MTRasym) map, 29 CEST off-resonance frequencies were sampled (-3.5 to -2.5, 3.5 to 2.5 and -0.3 to 0.3 ppm) in 0.1 ppm steps. For each saturation off-set, two acquisition trains were performed, each consisting of 5 CEST saturation pulses (Gaussian, 100-ms length each, 6 µT peak amplitude), 25 1H spokes and 6 23Na spokes. A multi-echo acquisition with no CEST pulses (INTERLACED-T2*) was also used. Acquisition parameters are summarized in figure 2B.
Dynamic measurements alternated between INTERLACED (29 CEST off-sets), INTERLACED (S0 reference, no CEST saturation) and INTERLACED-T2*. During the isometric contraction, S0 and the -0.3 to 0.3 ppm CEST off-sets were acquired only once, improving temporal resolution of subsequent MTRasym maps from 53 to 33 seconds.
Data Analysis
Interleaved NMR
For each dataset, 1H images were reconstructed3,4 individually while the 23Na spokes were reconstructed as a single image. T2* values were calculated using an exponential decay of the multi-echo data.
CEST
Following the B0 correction via a z-spectra based k-means clustering and Lorentzian fitting5, 0.4 ppm-width integrals S were estimated and MTRasym calculated as MTRasym(ω)=S(−ω)/S0−S(ω)/S0, with ω=3.0 ppm.
Statistical analysis
Similarity between interleaved and mononuclear measurements in phantoms was evaluated with intraclass correlation coefficients (ICC). In the exercise paradigm, relative changes to resting values were estimated using Wilcoxon rank sum tests.
Results and Discussion
INTERLACED and INTERLACED-T2* reduced the acquisition time by 45.8% and 42.9%, respectively, relative to sequential mononuclear sequences.Phantom results are shown in figure 3. The lowest ICC was found for MTRasym(0.973), indicating an excellent correspondence between the interleaved and mononuclear measurements.
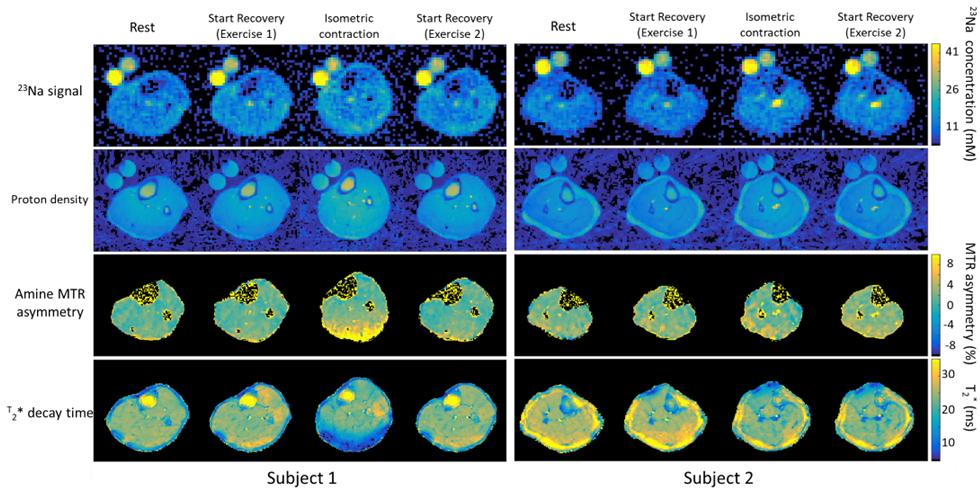
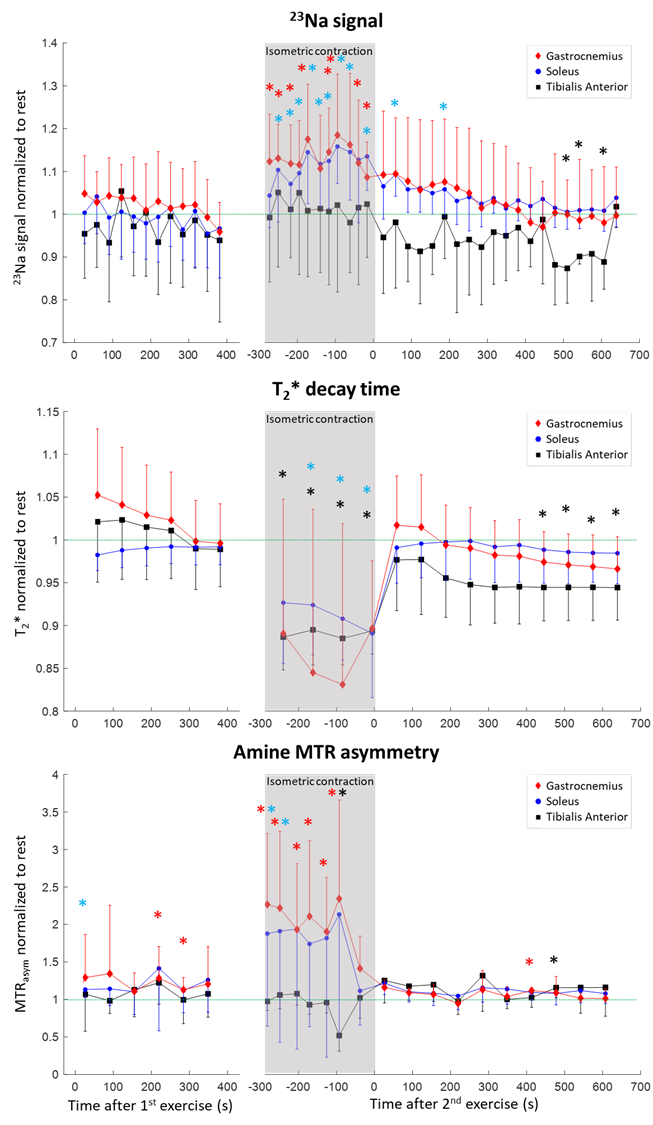
Figure 4 shows representative data from 2 subjects at different phases of the paradigm. Figure 5 shows the time courses for 23Na signal, T2* and MTRasym relative to pre-exercise values. All subjects maintained the isometric contractions for least 256 seconds and stopped within the next 30 seconds. Similarly to previous studies6, during the first exercise trends of increased T2* values in gastrocnemius muscles (Gas) with concomitant decreases in the soleus (Sol) were observed. A trend of increased T2* in the tibialis anterior (TA) and a mild initial increase of the 23Na signal in Gas were also observed. During the isometric contraction following the second exercise, strong T2* decreases were observed, particularly in some volunteers in Gas (figure 4), likely caused by hemoglobin desaturation. The elevated MTRasym in this period indicates acidification of the extracellular space, as amine CEST is insensitive to intracellular pH due to its elevated phosphate concentration7. Elevated MTRasym might be observed only during the tetanic contraction but not during muscle recovery due to a potential reduction in blood flow, allowing ions to accumulate. Additional blood flow measurements are needed to validate this hypothesis. Sodium signal intensity also remained elevated during the isometric contraction and progressively decreased during recovery, as observed elsewhere following an intense exercise8,9. The increase of sodium in Sol and Gas but not TA, could reflect an intracellular sodium concentration increase from transient Na+-K+ pump inactivation.
Conclusion
INTERLACED reduced the total scan time and allowed acquiring dynamic multinuclear data during an exercise paradigm. The sequence can be adapted to acquire other 1H contrasts, such as T2*. This approach will potentially contribute to the inclusion of sodium and advanced 1H MRI into clinical studies.Acknowledgements
No acknowledgement found.References
1. Yu, Z., Madelin, G., Sodickson, D. K. & Cloos, M. A. Simultaneous proton magnetic resonance fingerprinting and sodium MRI. Magn Reson Med 1–11 (2019) doi:10.1002/mrm.28073.2. Kaggie, J. D. et al. Synchronous 1H and 23Na dual-nuclear MRI on a clinical MRI system, equipped with a time-shared second transmit channel. in Proceedings of the 22nd Scientific meeting, International Society for Magnetic Resonance in Medicine (2014).
3. Fessler, J. A. & Sutton, B. P. Nonuniform fast fourier transforms using min-max interpolation. IEEE Transactions on Signal Processing 51, 560–574 (2003).
4. Block, K. T., Uecker, M. & Frahm, J. Undersampled radial MRI with multiple coils. Iterative image reconstruction using a total variation constraint. Magn Reson Med 57, 1086–1098 (2007).
5. Yao, J. et al. Improving B0 Correction for pH-Weighted Amine Proton Chemical Exchange Saturation Transfer (CEST) Imaging by Use of k-Means Clustering and Lorentzian Estimation. Tomography 4, 123–137 (2018).
6. Lopez Kolkovsky, A. L., Marty, B., Giacomini, E., Meyerspeer, M. & Carlier, P. G. Repeatability of multinuclear interleaved acquisitions with nuclear Overhauser enhancement effect in dynamic experiments in the calf muscle at 3T. Magn Reson Med 86, 115–130 (2021).
7. Yao, J., Wang, C. & Ellingson, B. M. Influence of phosphate concentration on amine, amide, and hydroxyl CEST contrast. Magn Reson Med 85, 1062–1078 (2021).
8. McKenna, M. J., Bangsbo, J. & Renaud, J.-M. Muscle K + , Na + , and Cl − disturbances and Na + -K + pump inactivation: implications for fatigue. J Appl Physiol 104, 288–295 (2008).
9. Höger, S. A. et al. Sodium and quantitative hydrogen parameter changes in muscle tissue after eccentric exercise and in delayed‐onset muscle soreness assessed with magnetic resonance imaging. NMR Biomed 36, (2023).
Figures
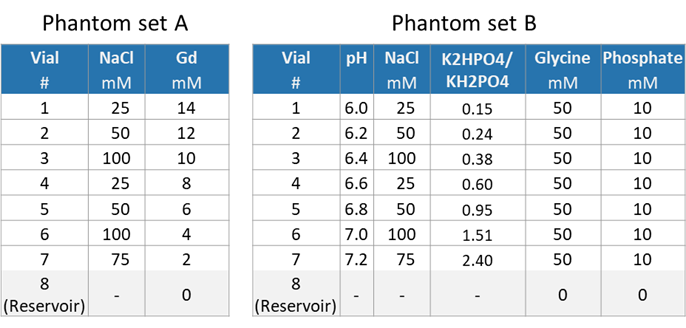
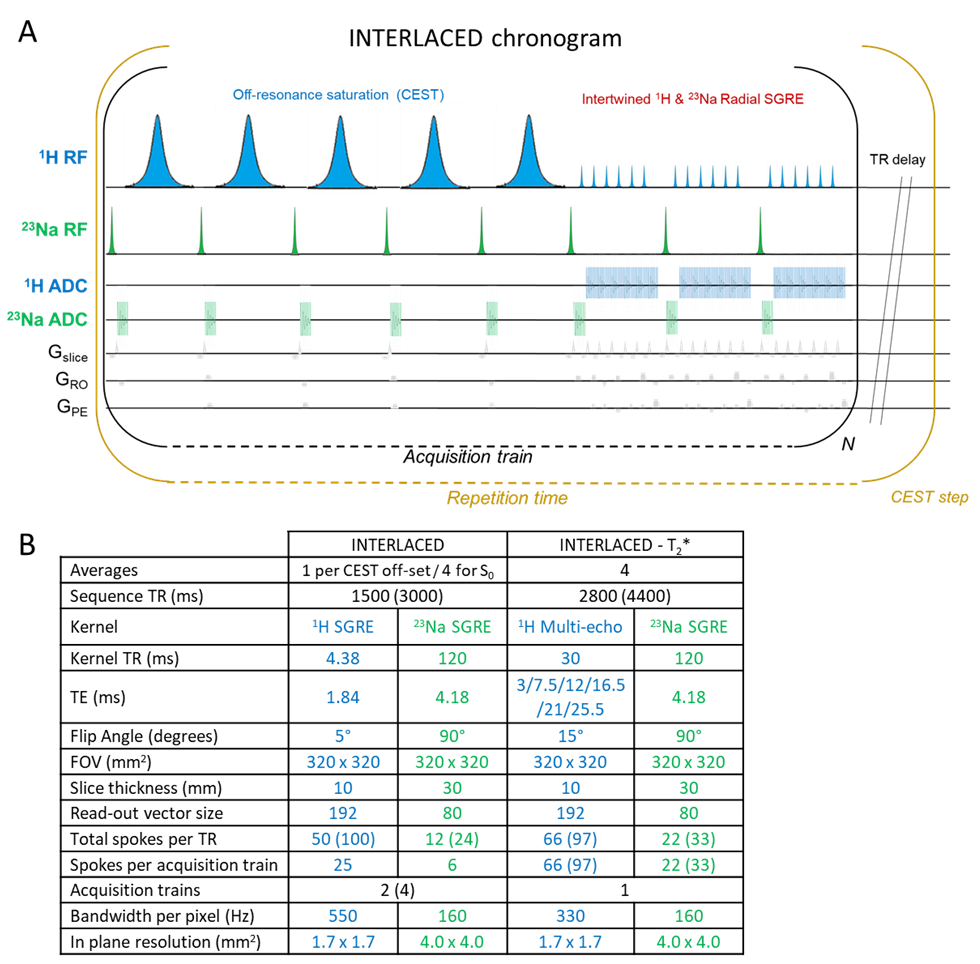
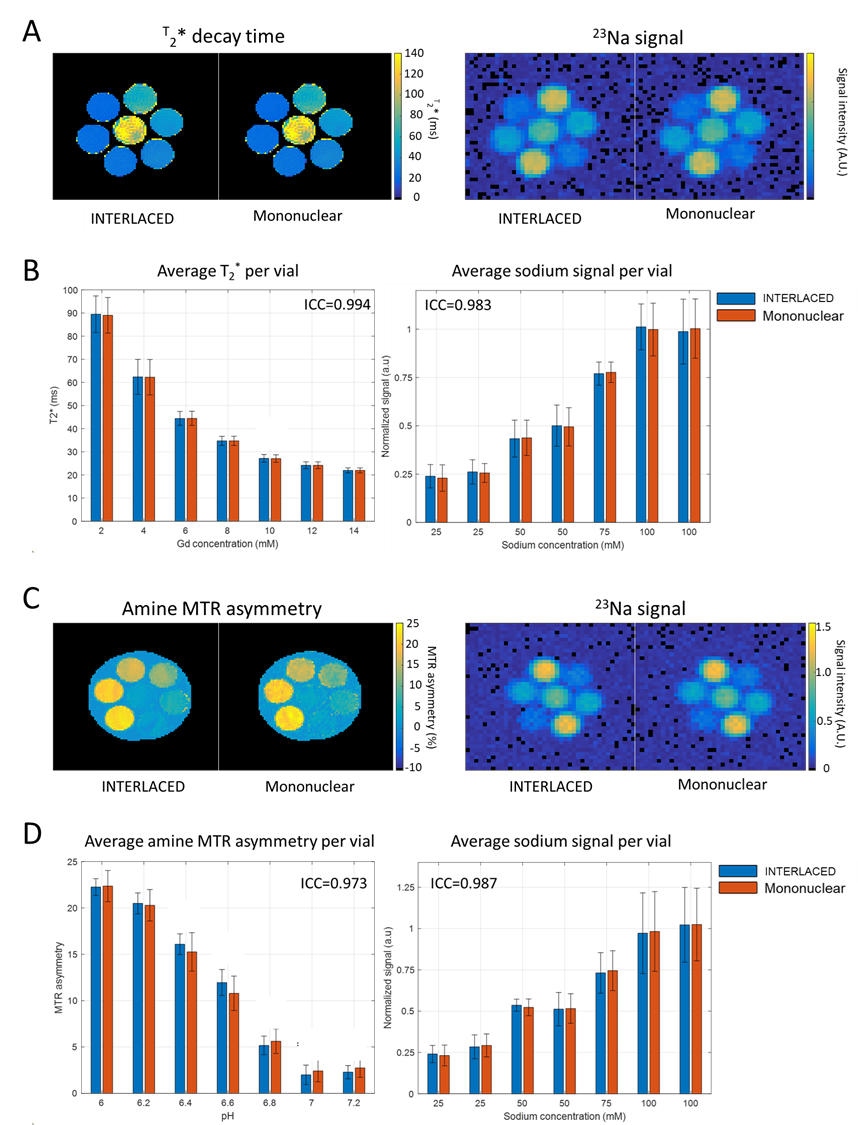
Figure 3. Maps and average values per vial of (A,B) T2* and 23Na from the A phantom set and of (C,D) Amine MTRasym and 23Na from the B phantom set acquired using either INTERLACED or the mononuclear sequences. For each vial set, 23Na signal was normalized to the average intensity of the 100 mM sodium phantoms from the interleaved acquisition. ICC indicated for each phantom set and measurement.