0952
Further accelerating spin-echo EPI through combined patterned multislice excitation and SMS acquisition1AMRI, LFMI, National Institute of Neurological Disorders and Stroke, National Institutes of Health, Bethesda, MD, United States
Synopsis
Keywords: New Signal Preparation Schemes, Pulse Sequence Design, SMS, PME, Diffusion
Motivation: Both the recently introduced patterned multislice excitation (PME) technique and SMS acquisition can be used for faster imaging. Combining these would reduce imaging times further.
Goal(s): To demonstrate that the PME is compatible with SMS imaging.
Approach: Four RF pulses were combined to achieve acceleration from both SMS and PME. To limit peak RF amplitude, pulse components were time-shifted. The approach was demonstrated using diffusion weighted (DW) imaging at 3T.
Results: Close to fourfold acceleration was successfully implemented by combining twofold SMS and PME and evaluated for DW MRI performance versus twofold acceleration based on PME only.
Impact: Recently introduced PME approach and SMS can be combined to accelerate the acquisition.
Introduction
Spin-echo EPI (SE EPI) is an efficient technique for applications such as diffusion-weighted (DW) MRI and displacement-encoded MRI (REFS)1. The introduction of simultaneous multislice (SMS) techniques has further improved efficiency, allowing high angular resolution DW schemes in clinically feasible scan times2-4. Nevertheless, some inefficiency remains due to the time needed to establish the required contrast.Recently, we introduced a novel acquisition strategy, called patterned multislice excitation (PME) that reduces this inefficiency by combining excitation and refocusing pulses for distinct slices5. Here we investigated the feasibility of combining PME with SMS to achieve further acceleration.
Theory and Method
PME changes each RF pulse’s spectral pattern to prepare the magnetization of upcoming slices while simultaneously acting on the current slice, thereby providing a way of generating contrast in a time-efficient manner (Figure 1A and Figure 1B). The pulses in the SMS2-PME-SE sequence, as a proof of concept, act on four slices in parallel (Figure 1C). The crusher gradients required by PME can serve to generate tissue displacement or diffusion contrast.To overcome peak RF amplitude limitations, we incorporated a time shift between the concurrent RF pulses6 (Figure 2A-C). This was combined with alternating slice-selection gradient polarity over shots to suppress the refocusing of lipid signal (Figure 2D-E). The crusher scheme results in full through-slice refocusing of the water signal in all 4 slices.
Scans were performed on four healthy young volunteers (3 female, 1 male) under an IRB–approved protocol. All measurements were performed on a Siemens 3T Prisma scanner (Erlangen, Germany) with a 32-channel receive head-coil.
The protocol included five scans, all with PME-SE and a 2D EPI acquisition with SENSE rate 2. Diffusion weighting applied in 12 directions equally distributed on a sphere, with a low b of 16-20 s/mm2 and a high-b of 1012-1060 s/mm2. The RF pulse duration was 5.2 ms (for a single excitation) with a bandwidth-time-product of four. The RF time shift was 0.9 ms. The scans were: 1) SMS2 at 1.75 mm isotropic resolution with 62 slices in 1932 ms, 2) same as scan-1, but with SMS1 and a volume TR (vTR) of 3864 ms, 3) SMS2 at 2 mm isotropic resolution with 56 slices in 1624 ms, 4) as scan-3, but SMS1 and a vTR of 3248 ms, 5) as scan-4 without the RF time shift. Total scan time was 9m36s for 1.75 mm3 resolution, and 5m37s for 2 mm3 resolution. The total number of low-b averages was 43,22,29,15 and 15 for scans 1-5 respectively. The number of averages for each high-b direction was 21,10,14,7 and 7 for scans 1-5.
We used SENSE reconstruction for both in-plane and through-plane unaliasing. Voxel-wise mean diffusivity (MD), fractional anisotropy (FA), and fiber orientation maps were generated from the fitted diffusion tensor matrix7.
For the signal-to-noise (SNR) ratio calculation, image noise level derived from data acquired in a shot without RF, in combination with the SENSE matrix. Temporal signal stability (tSNR) was calculated over low-b data and each high-b direction independently. Both SNR and tSNR were converted to SNR/unit-time by dividing $$$\sqrt{vTR}$$$
Results
In figure 3, we compare both the SNR and tSNR for SMS1-PME and SMS2-PME at 1.75 mm3 resolution, showing very similar results.Figure 4 shows similar findings for the 2 mm3 data, comparing (t)SNR for SMS2-PME and SMS1-PME with and without pulse time-shift. Overall, the time-shifted RF pulse did not introduce additional SNR penalty but reduced peak amplitude by 26% and 51% for SMS1-PME and SMS2-PME respectively.
Figure 5 shows mean diffusivity, fractional anisotropy and colormap for PME diffusion data acquired with and without SMS. The SMS2 has no impact on distortion and image quality of the diffusion measures.
Discussion and conclusion
We demonstrated the feasibility of combining PME and SMS to accelerate SE-based diffusion MRI. An additional twofold acceleration was achieved with SMS2-PME over PME while maintaining the (t)SNR per unit time. We did not see an $$$\sqrt{2}$$$ improvement in (t)SNR per unit time with SMS2 expected from the increased number of averages. We attribute this to increased saturation and a modest (~10%) g-factor penalty that was observed with SMS2. The additional acceleration is beneficial for high angular resolution diffusion imaging4 and reducing sensitivity to patient motion. In addition, tSNR gain is expected in applications where vTR is longer, which would reduce the penalty from saturation effects.Acknowledgements
This study was supported by the intramural program of NINDS, NIH.References
1. Aletras AH, Ding S, Balaban RS, Wen H. DENSE: displacement encoding with stimulated echoes in cardiac functional MRI. J Magn Reson. 1999 Mar;137(1):247-52.
2. Larkman DJ, Hajnal JV, Herlihy AH, Coutts GA, Young IR, Ehnholm G. Use of multicoil arrays for separation of signal from multiple slices simultaneously excited. J Magn Reson Imaging. 2001;13(2):313-317.
3. Barth M, Breuer F, Koopmans PJ, Norris DG, Poser BA. Simultaneous multislice (SMS) imaging techniques. Magn Reson Med. 2016;75(1):63-81.
4. Tuch DS, Reese TG, Wiegell MR, Makris N, Belliveau JW, Wedeen VJ. High angular resolution diffusion imaging reveals intravoxel white matter fiber heterogeneity. Magn Reson Med. 2002;48(4):577-582
5. de Zwart JA, van Gelderen P, Wang Y, Duyn JH. Accelerated multislice MRI with patterned excitation [published online ahead of print, 2023 Sep 28]. Magn Reson Med. 2023;10.1002/mrm.29850.
6. Goelman G. Two methods for peak RF power minimization of multiple inversion-band pulses. Magn Reson Med. 1997;37(5):658-665.
7. O'Donnell LJ, Westin CF. An introduction to diffusion tensor image analysis. Neurosurg Clin N Am. 2011;22(2):185-viii
Figures
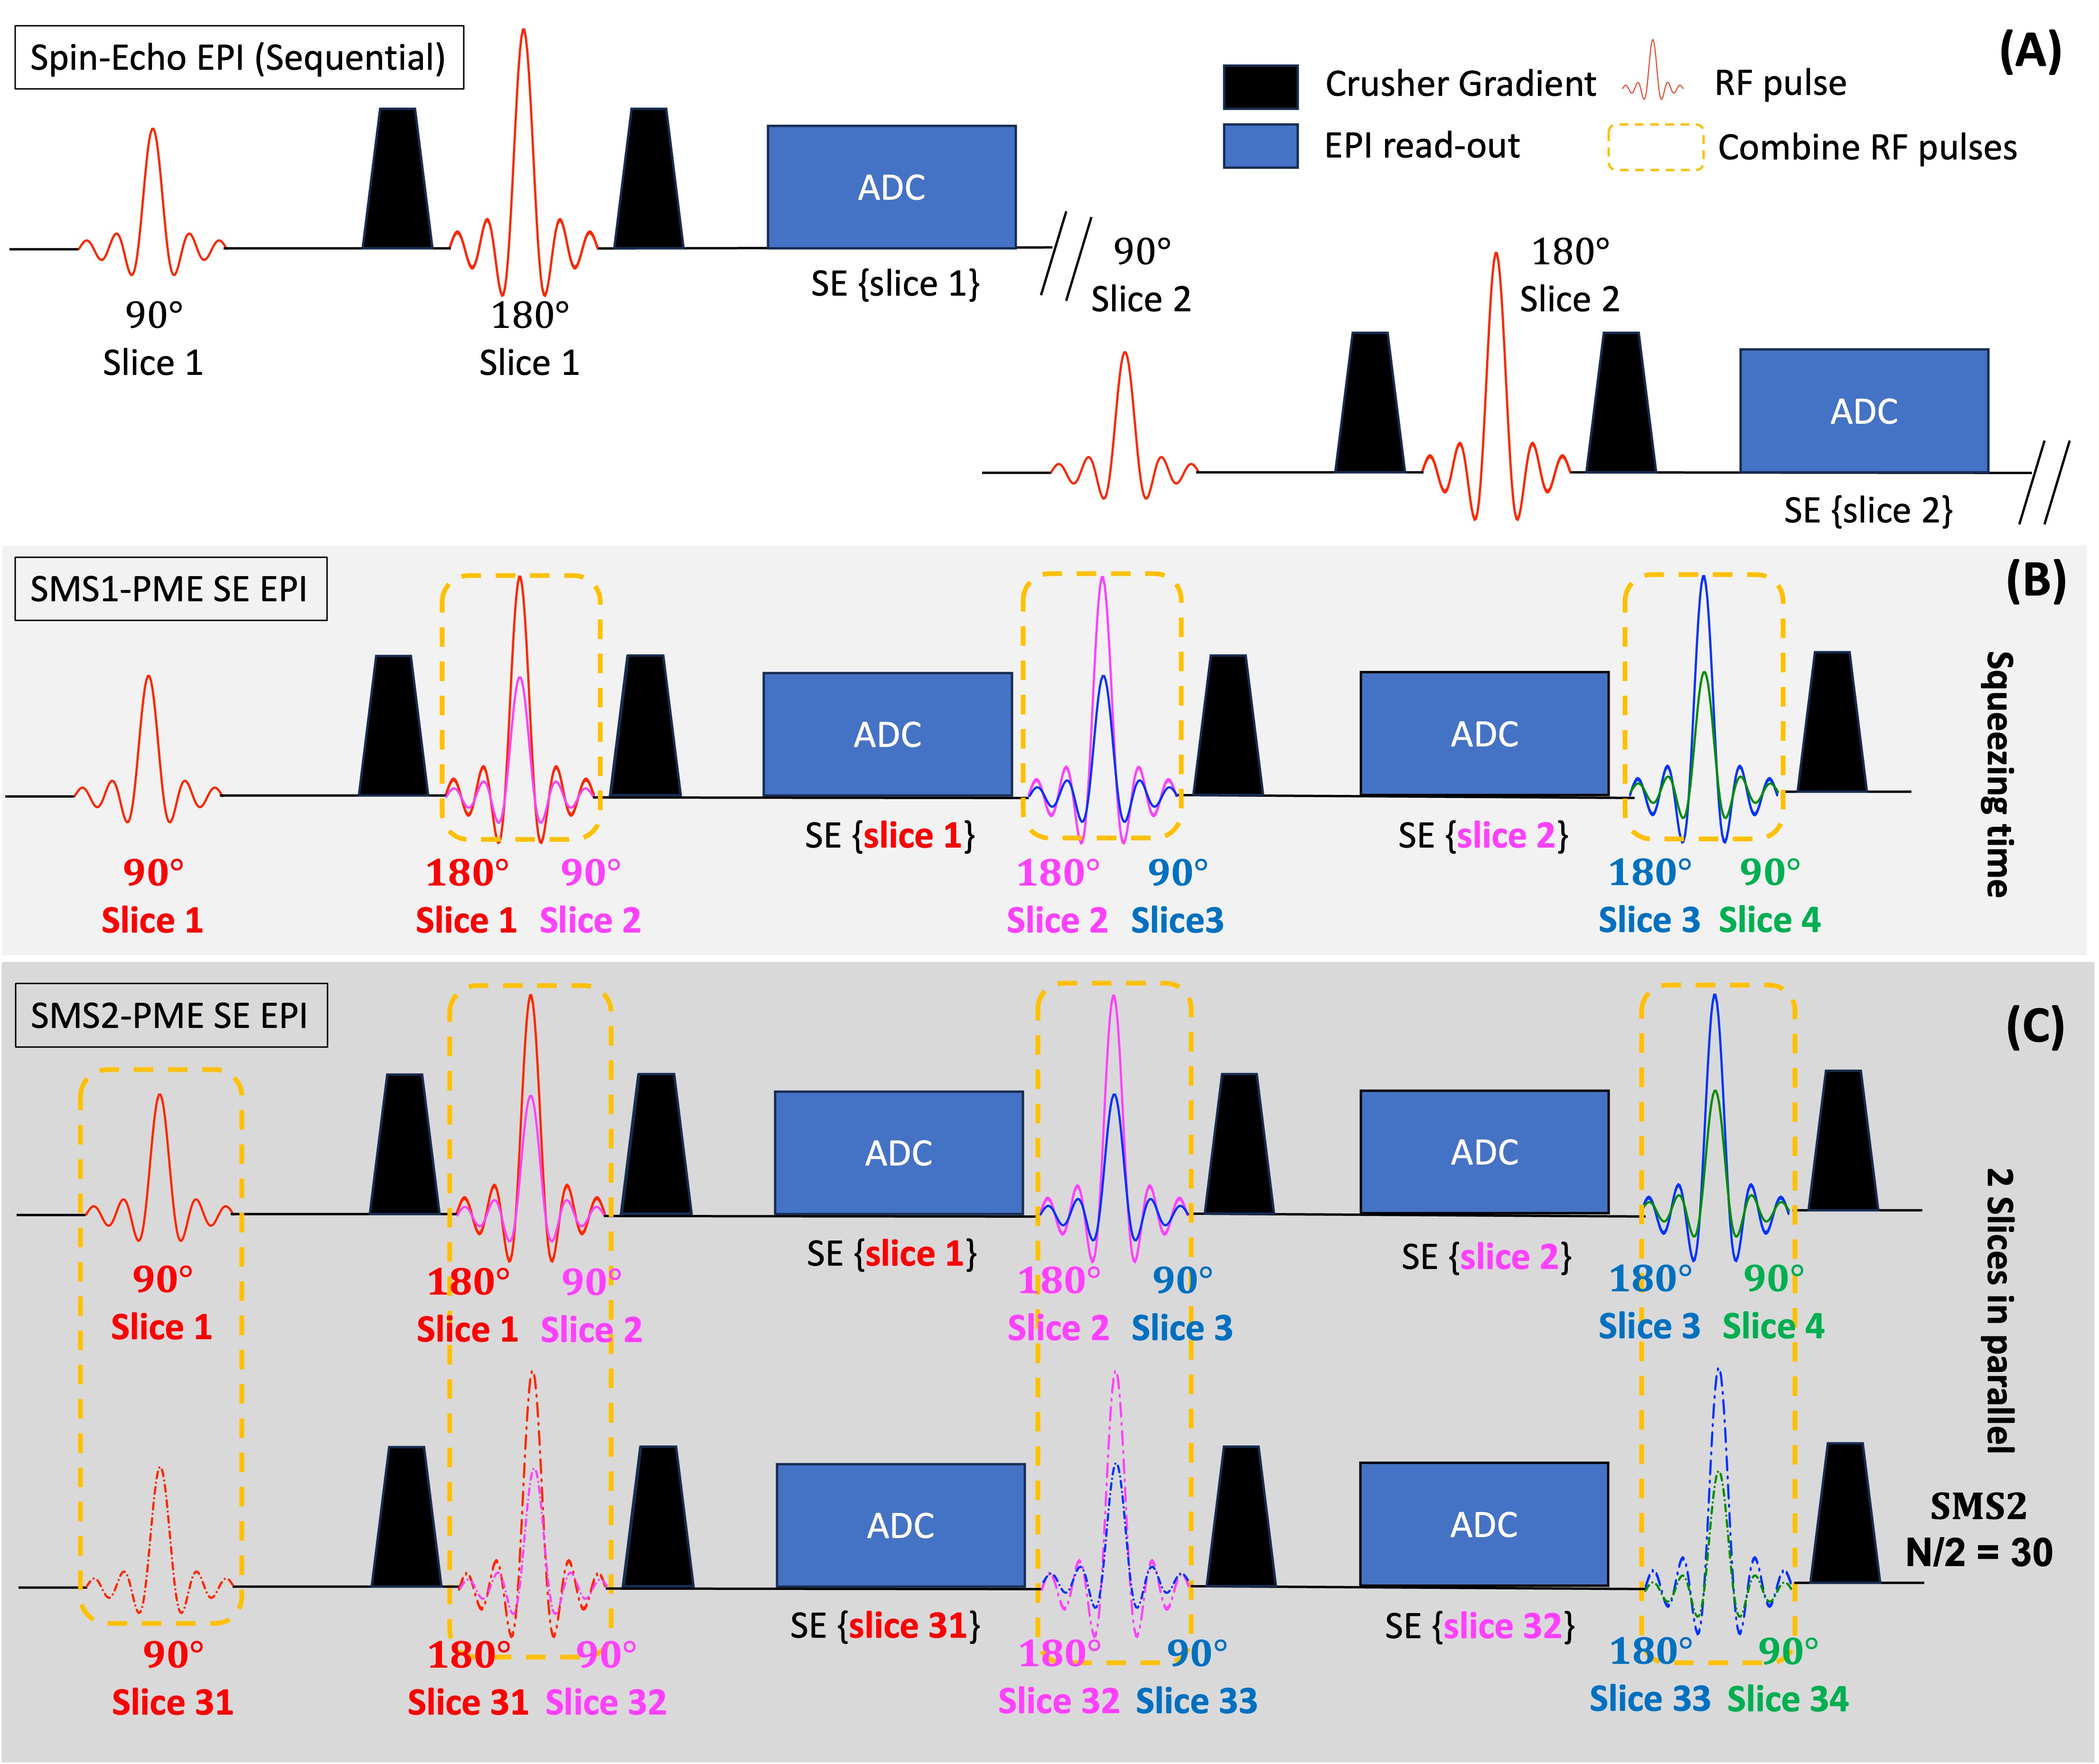
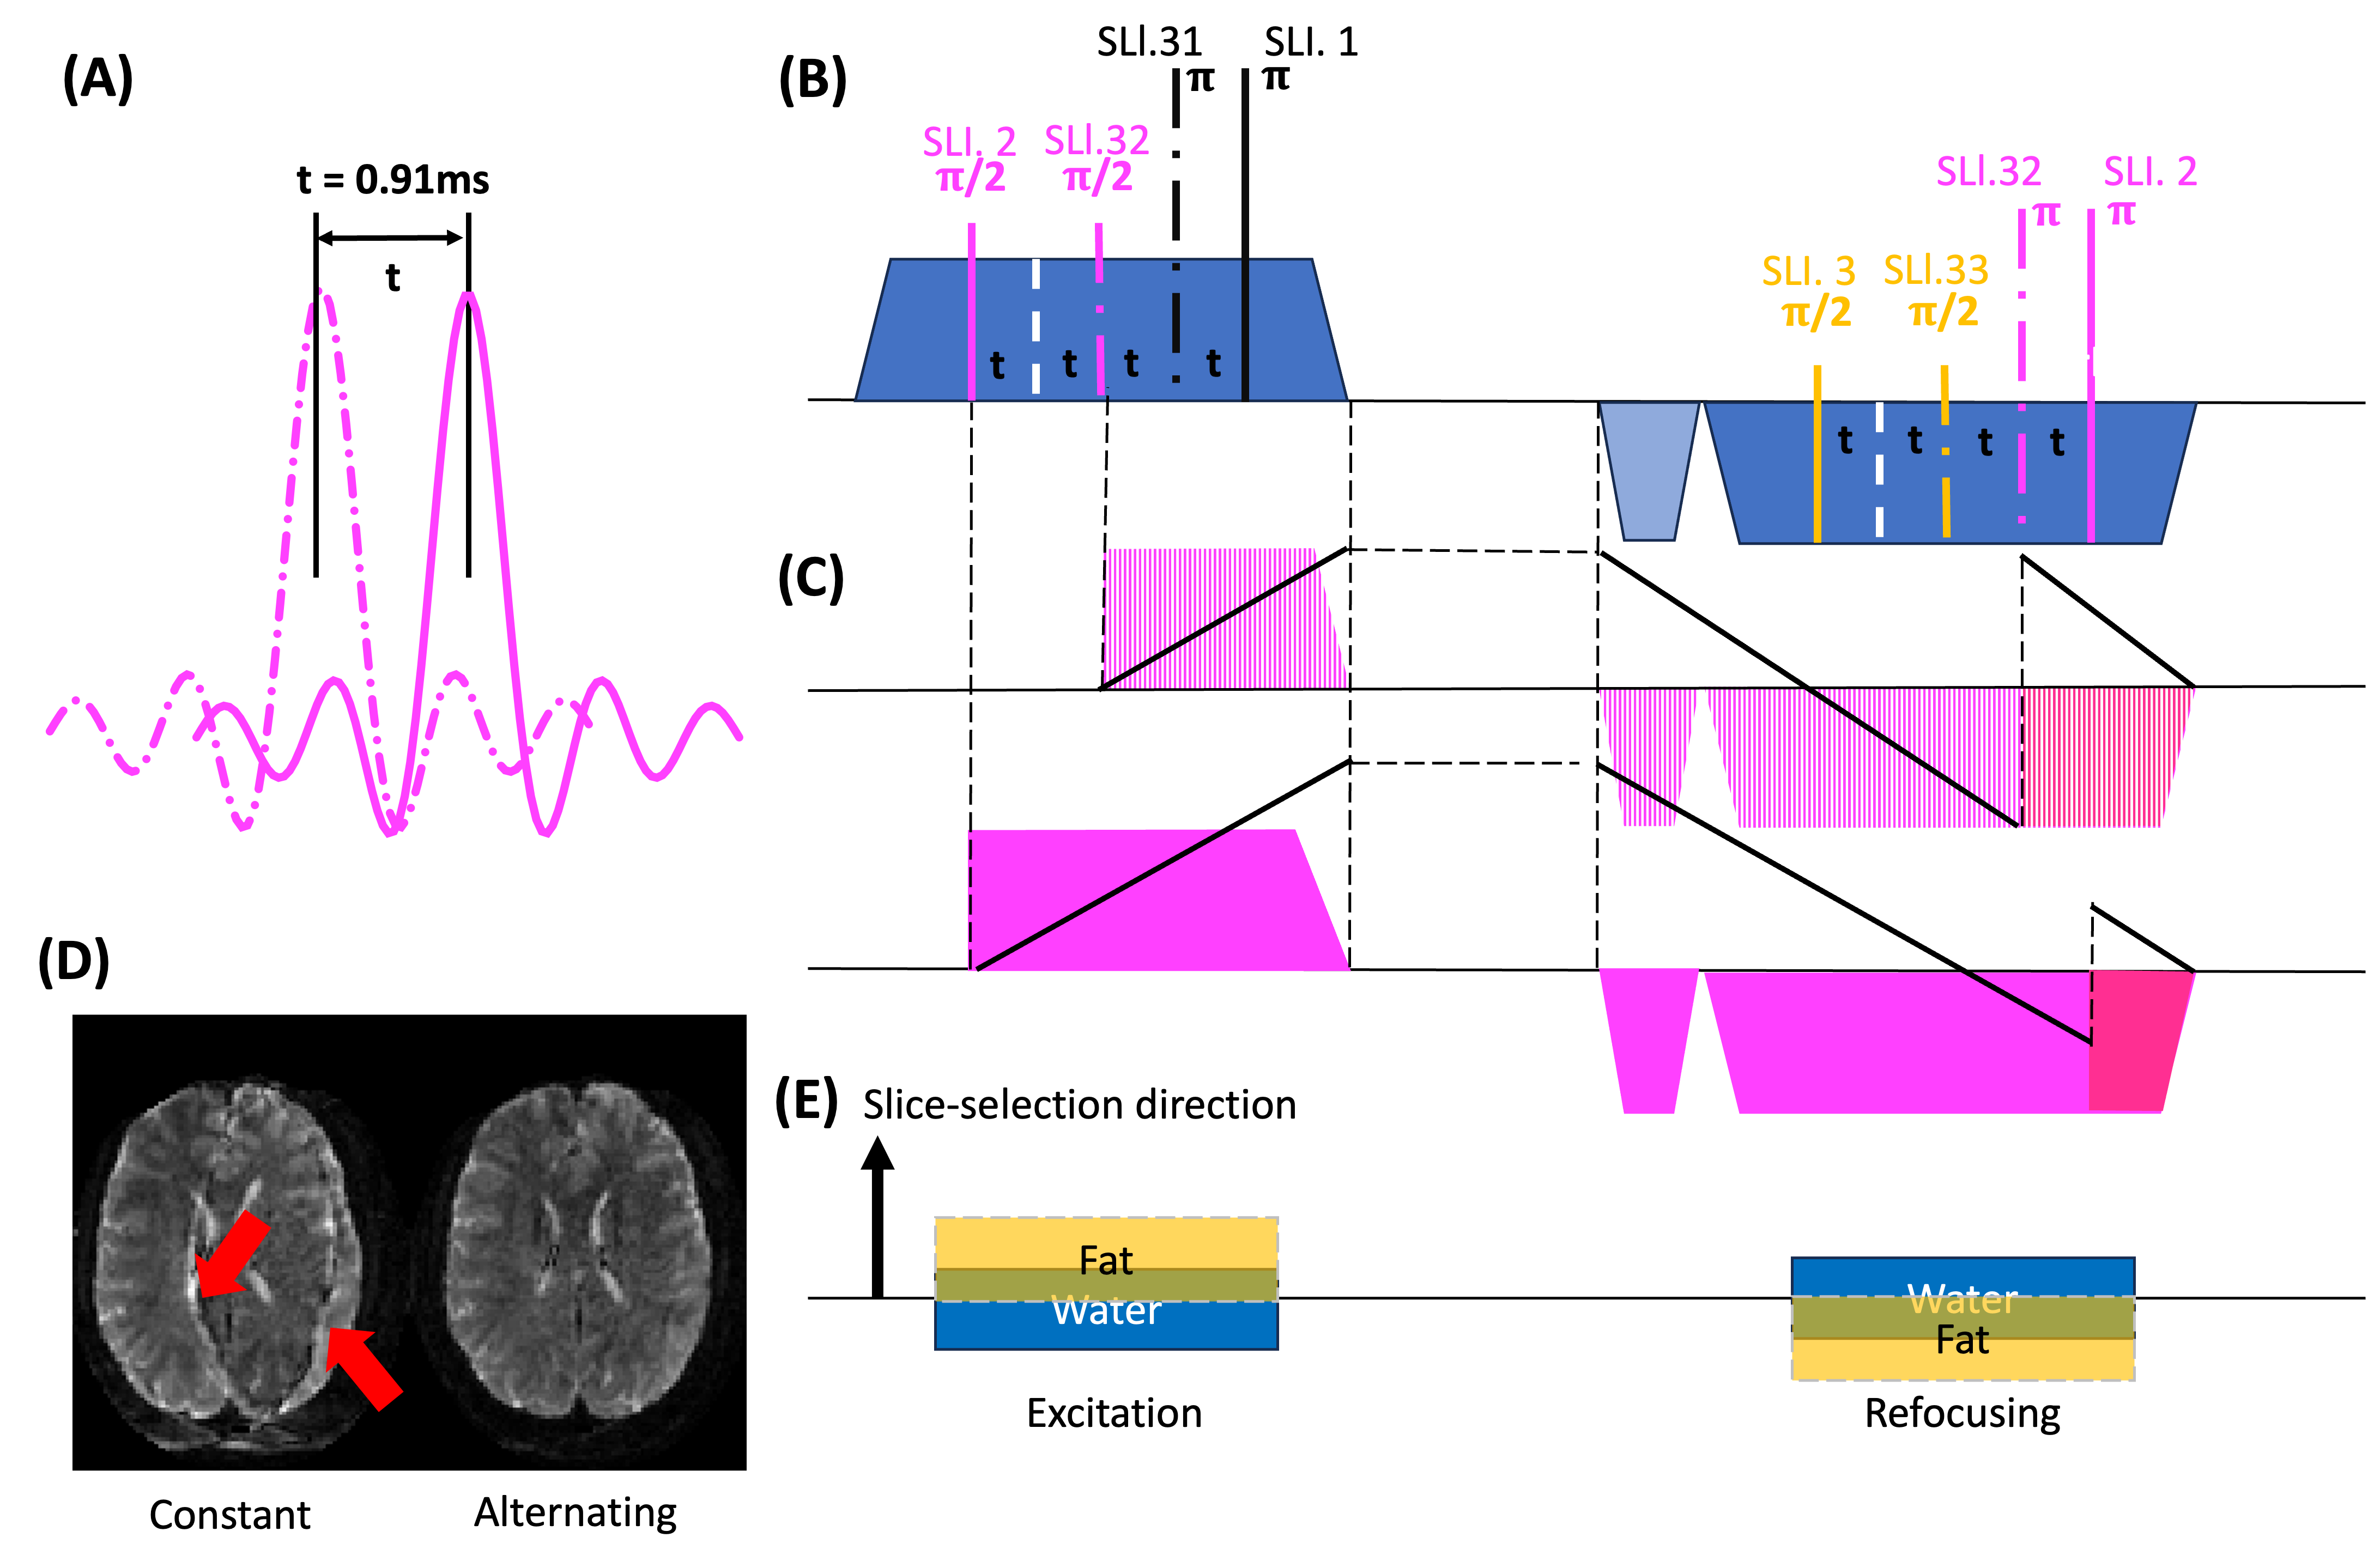
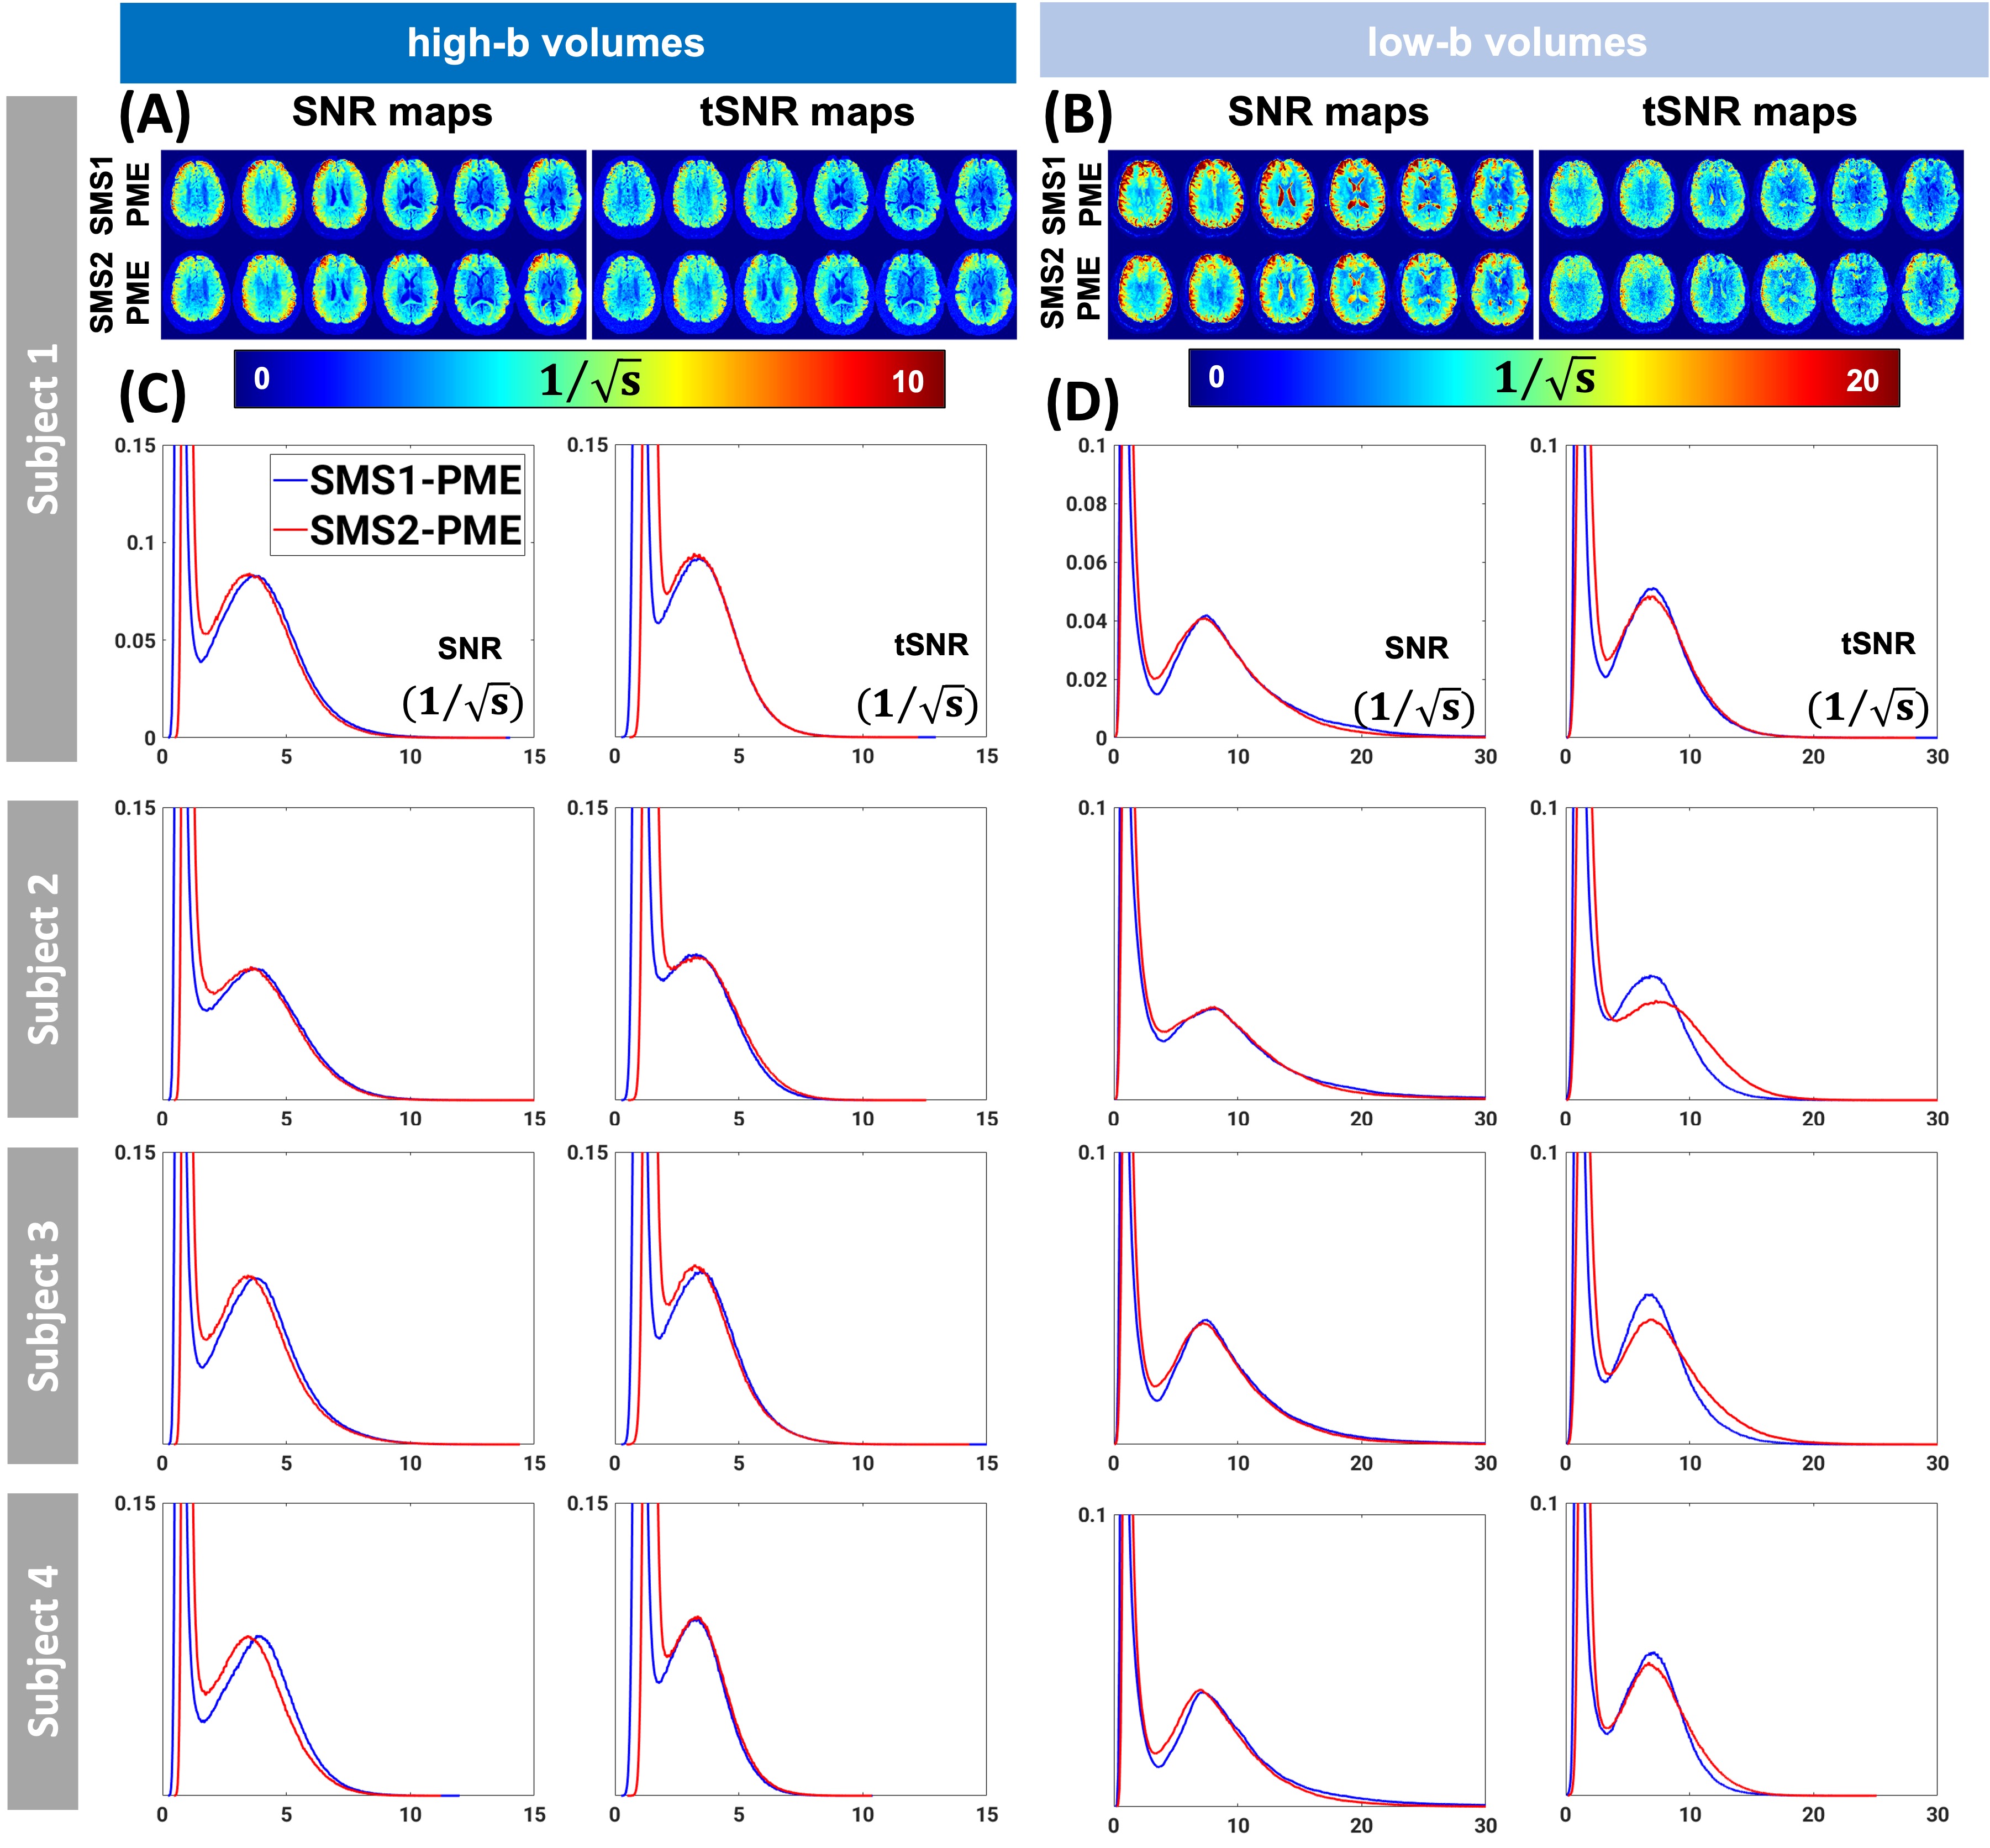
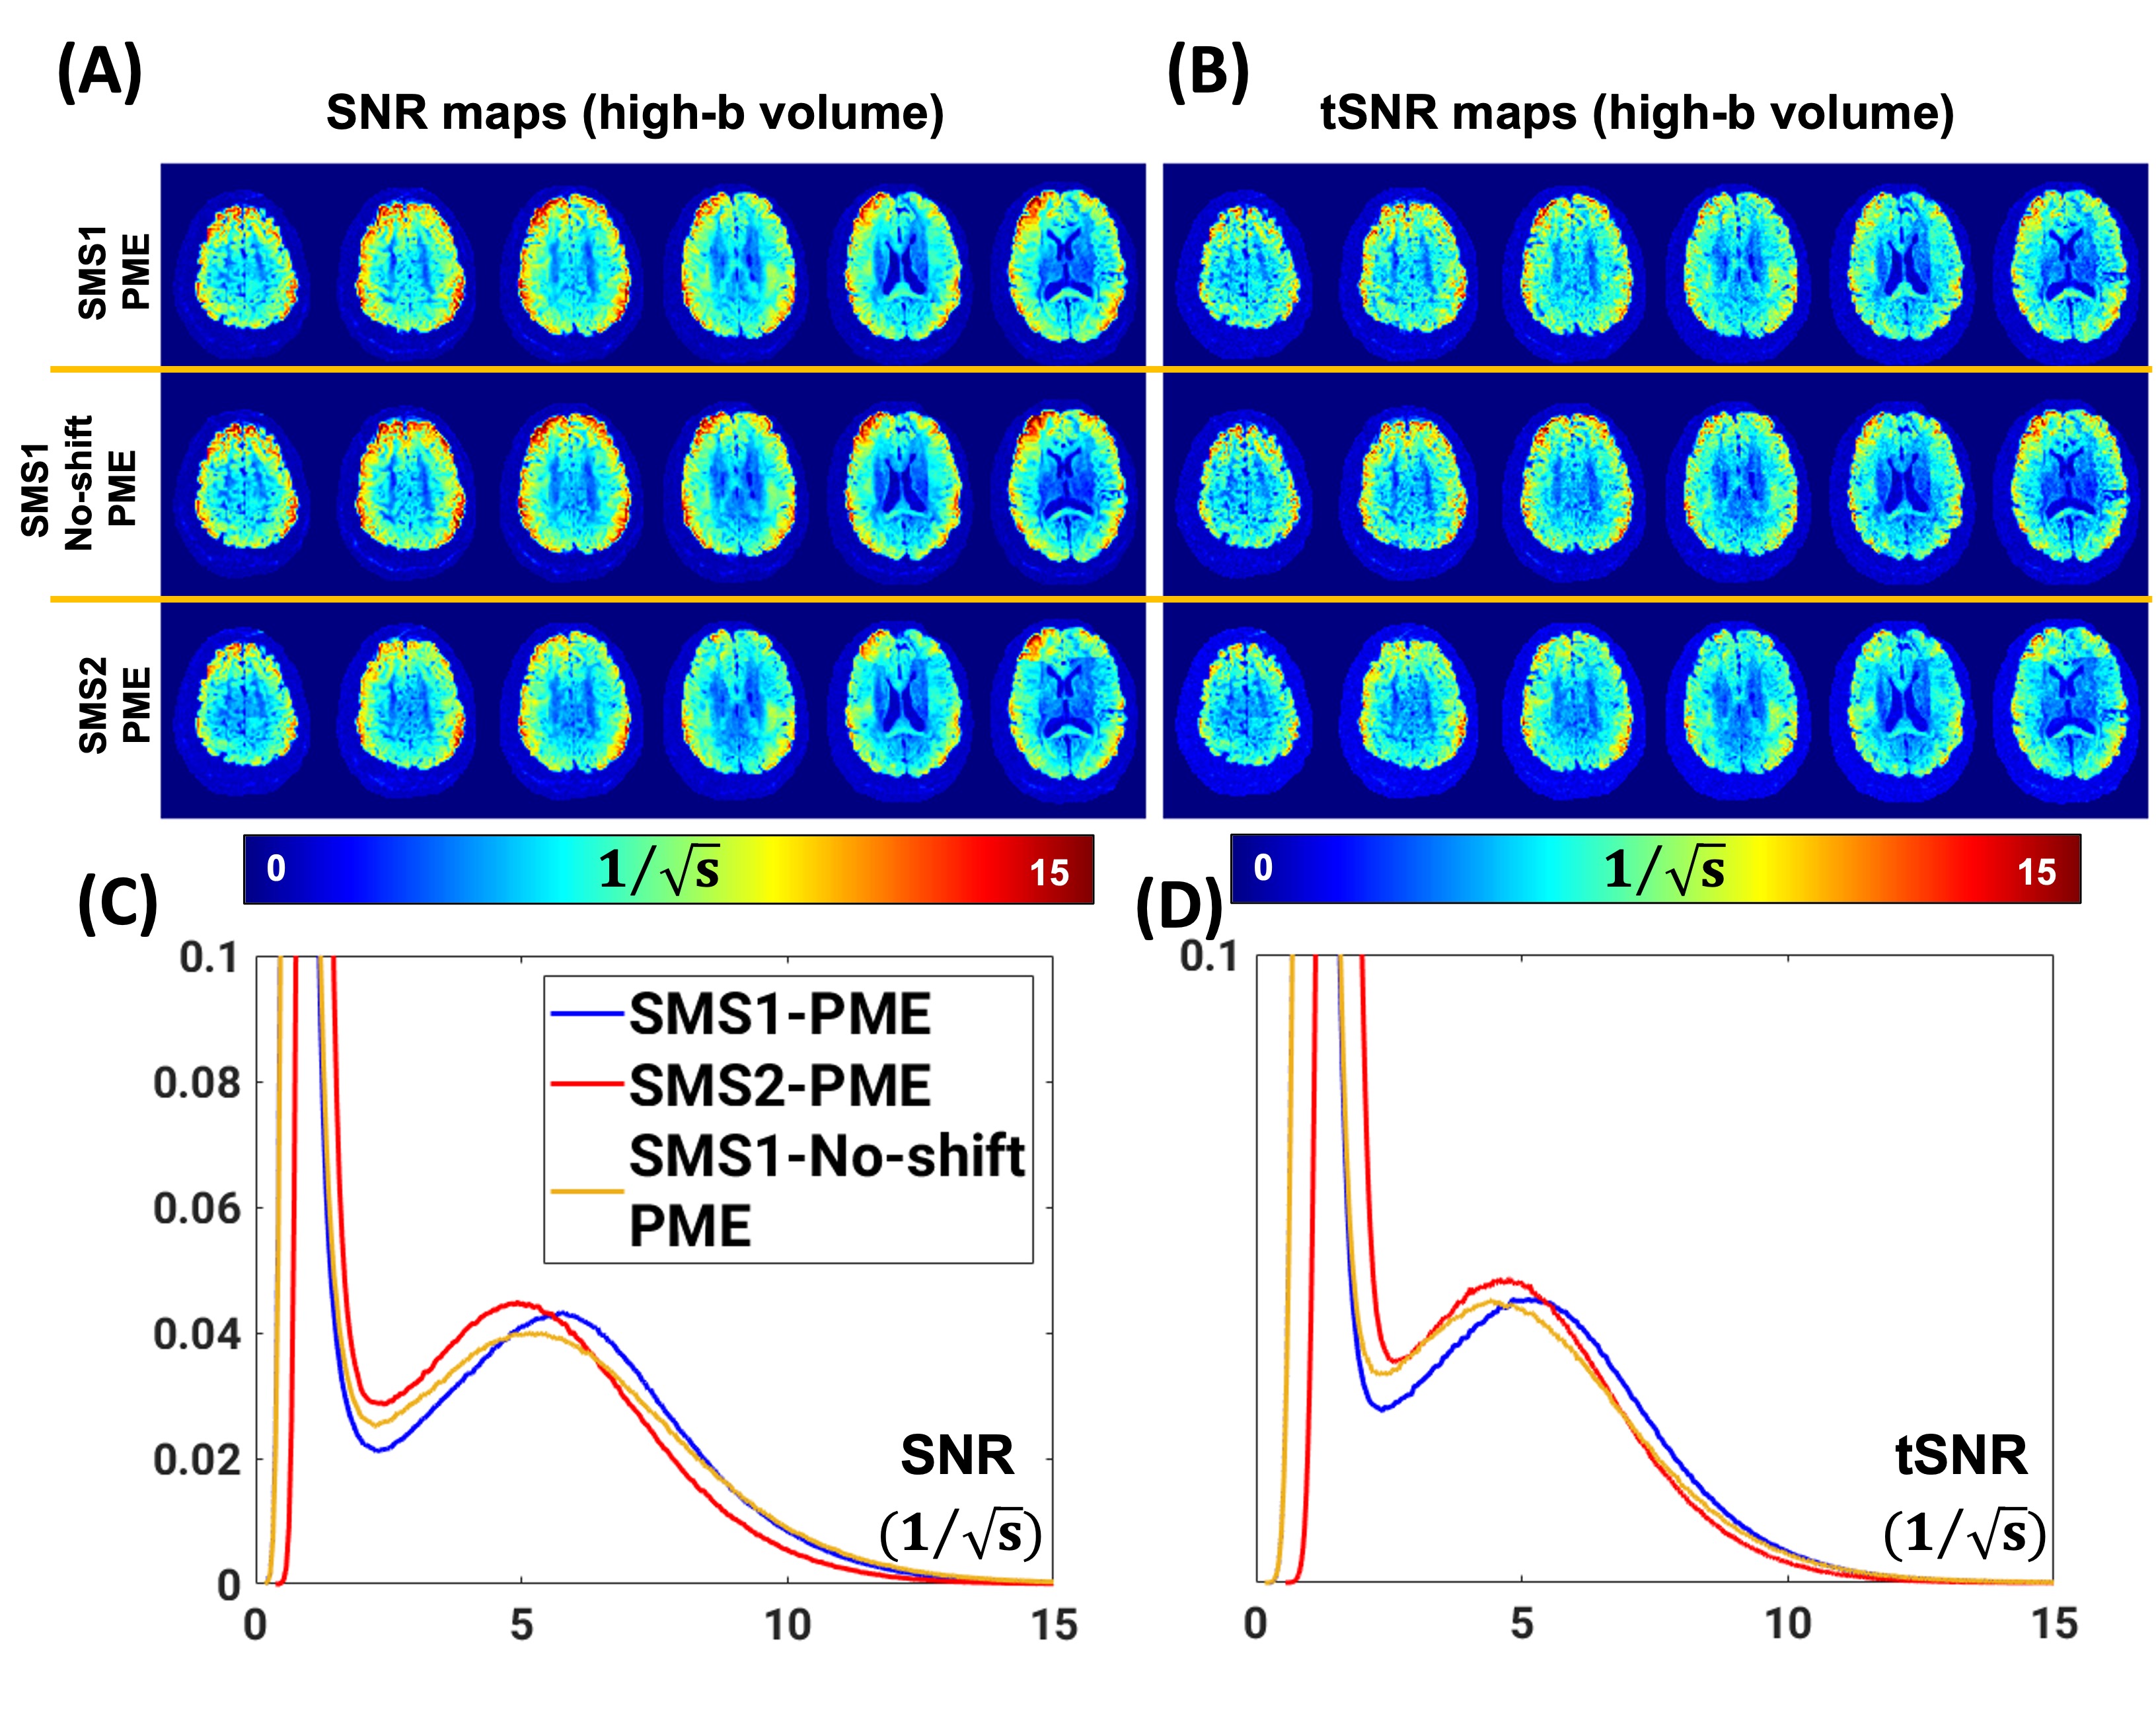
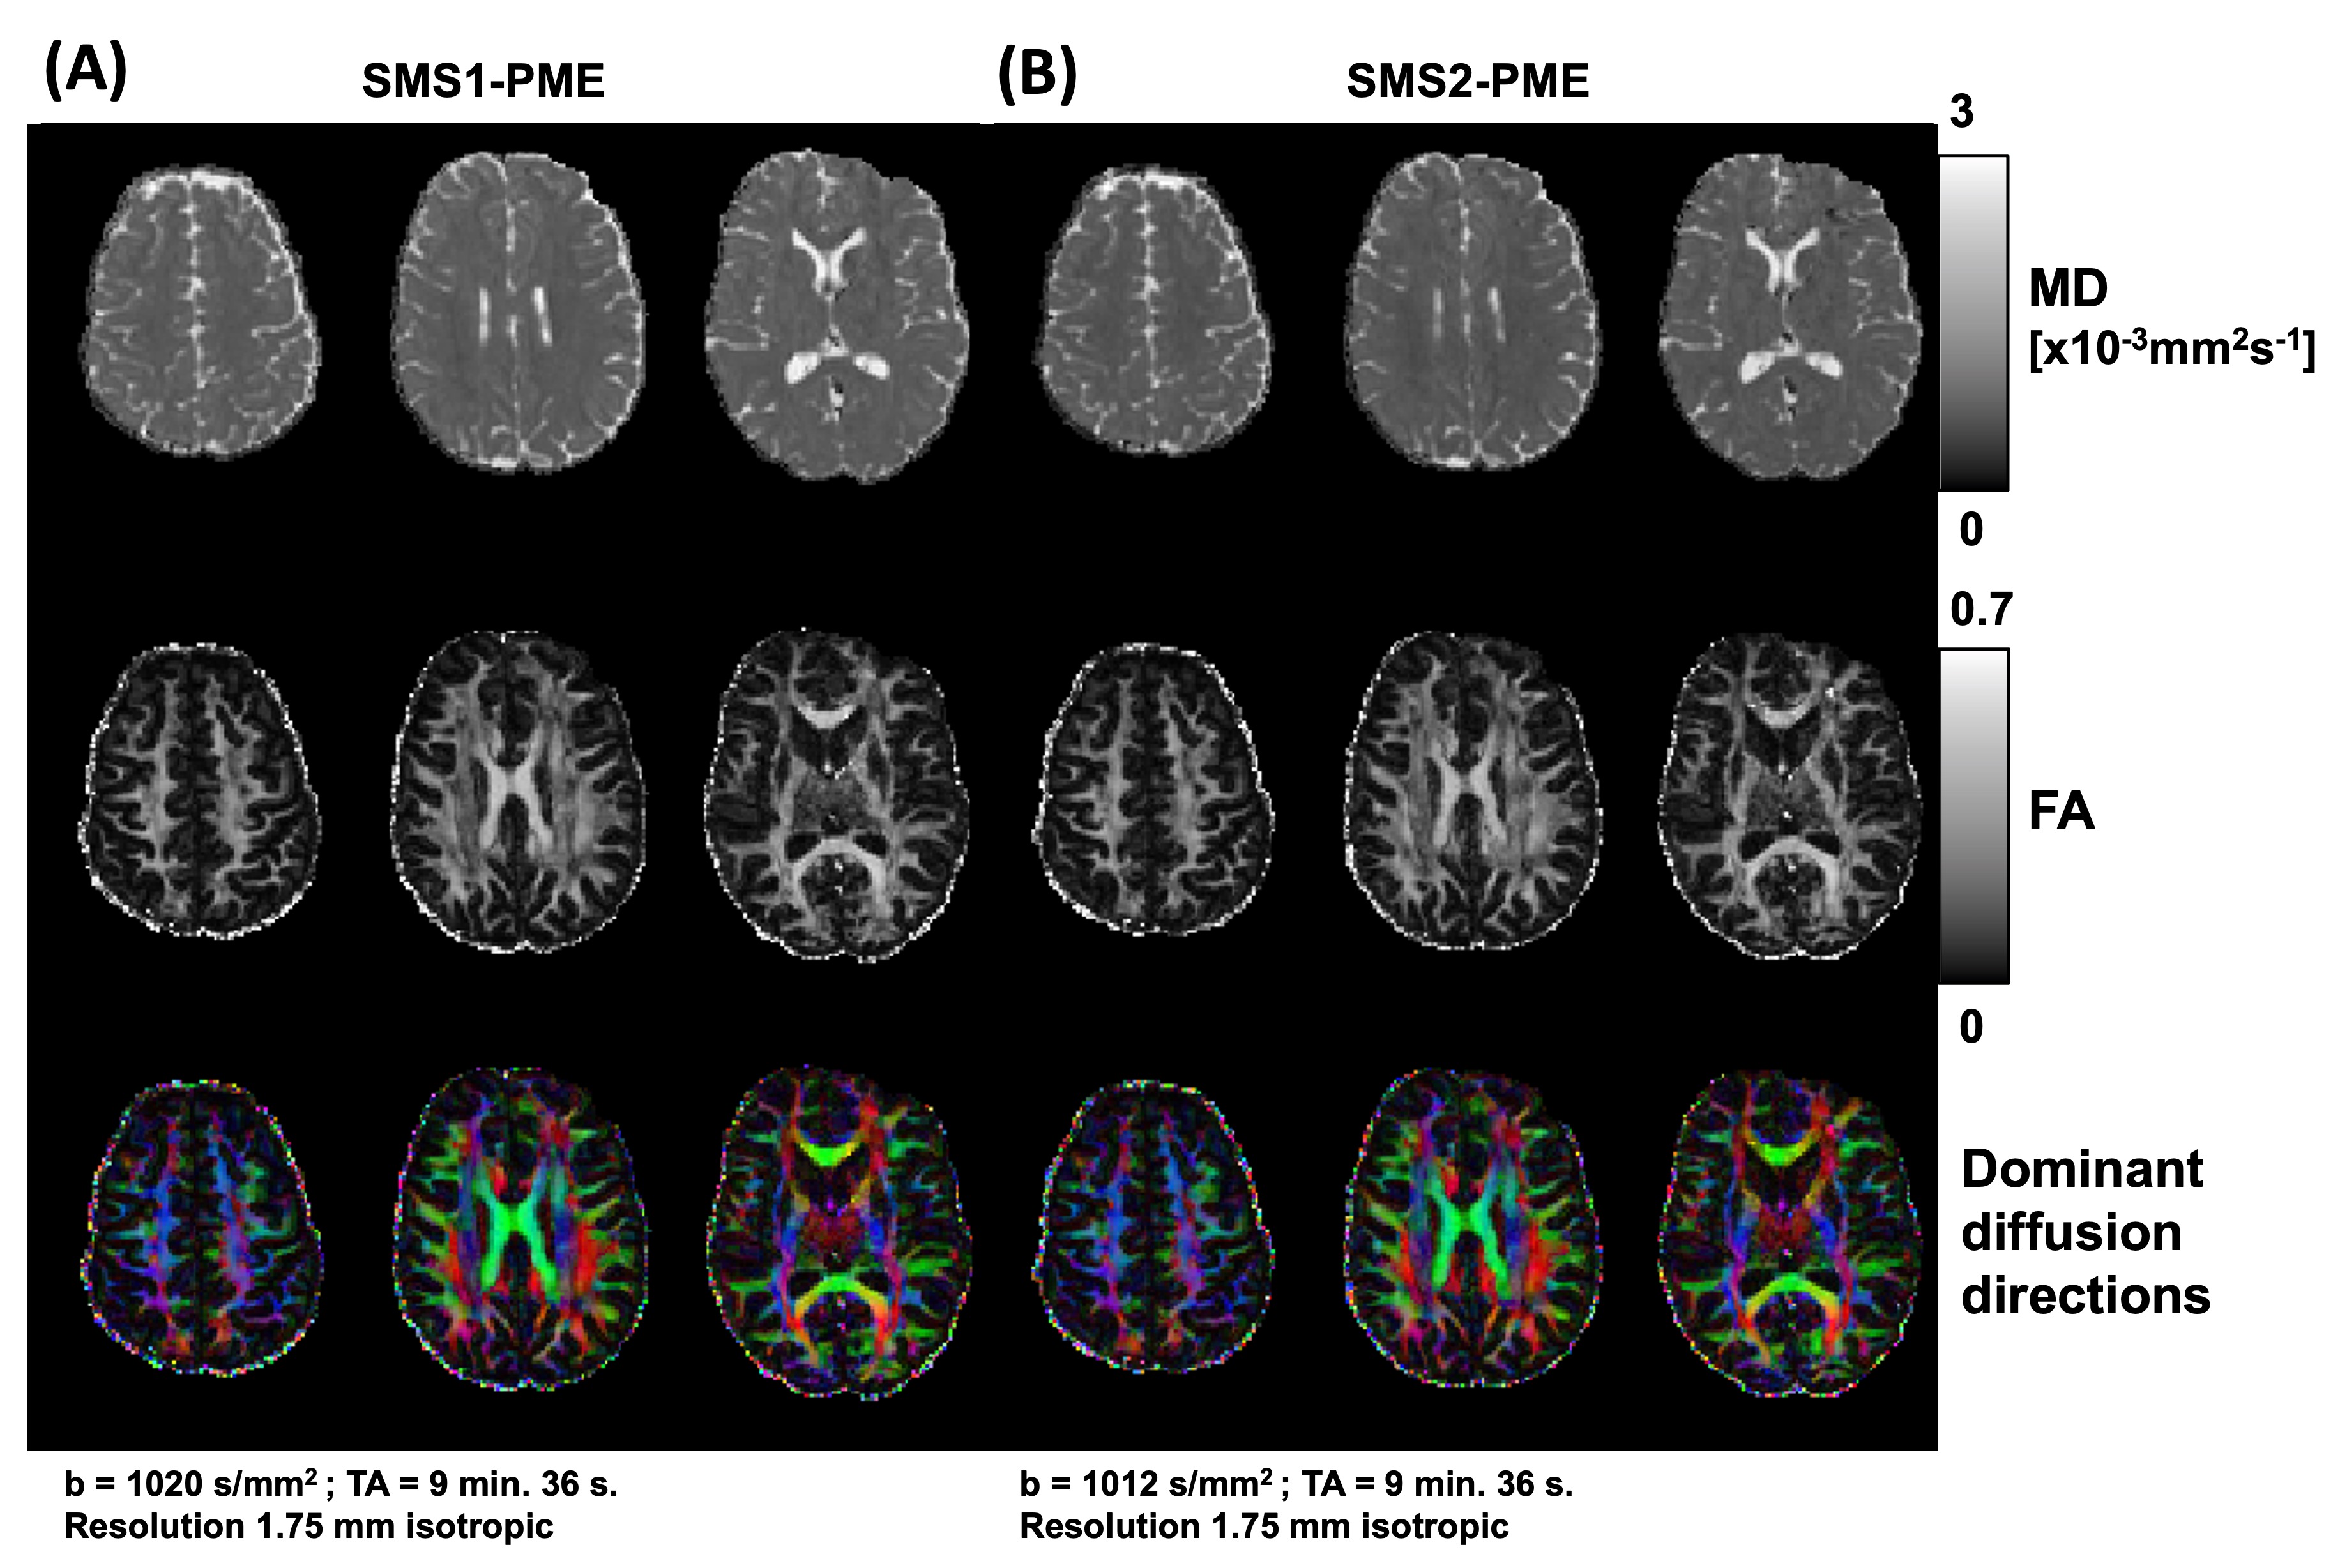
Figure 5: Comparison of the MD, FA and dominant diffusion directions for SMS1-PME and SMS2-PME for 1.75mm3 data from one of the subjects. (Red: left to right, green: anterior to posterior, blue: superior to inferior).