0949
Isotropic 3D Sub-millimeter MRI of the Vocal Fold Oscillation with Sub-millisecond Temporal Resolution1Radiology, Medical Physics, University Medical Center Freiburg, Freiburg, Germany, 2Institute of Musicians' Medicine, University Medical Center Freiburg, Freiburg, Germany
Synopsis
Keywords: New Trajectories & Spatial Encoding Methods, Data Acquisition
Motivation: Several diseases influence the human vocal fold oscillation which can currently only be studied with superficial stroboscopic imaging.
Goal(s): We aim to develop a technique that allows the full characterization of the vocal fold oscillation with sub-millisecond sub-millimeter resolution.
Approach: ZTE MRI allows to freeze sub-ms dynamic signal changes in k-space. With synchronization data from a microphone, we retrospectively gate ZTE MRI data of the larynx acquired during singing using a total variation constraint in the time domain to reconstruct the vocal fold motion.
Results: 3D vocal fold oscillations can be visualized with ultra-high spatial (0.8mm) and temporal (670μs) resolution.
Impact: This work aims to improve the understanding of the VF oscillation under various physiological and pathological conditions, and might have applications in 3D dynamic MRI of other oscillatory body motions.
Introduction
Various techniques have been developed to measure of the vocal fold (VF) oscillation1-5. However, due to the restricted anatomical access in the larynx, these methods only measure particular aspects such as the caudal surface3, the layered structure4 or the tissue velocity5. A holistic picture of the oscillation will further our understanding of the origin of voice and may guide therapeutic decisions when tumor resection is required6. Dynamic MRI of the VF oscillation requires high temporal resolution due to the high oscillation frequencies ($$$f=100-1600$$$Hz). Such sequences have been developed in recent years, using either rapid phase or frequency encoding7-9. In this work, we leverage the fast encoding of zero echo time (ZTE) MRI to develop a 3D-imaging technique that captures the vocal fold oscillations with sub-millimeter isotropic spatial and sub-millisecond temporal resolution.Methods & Materials
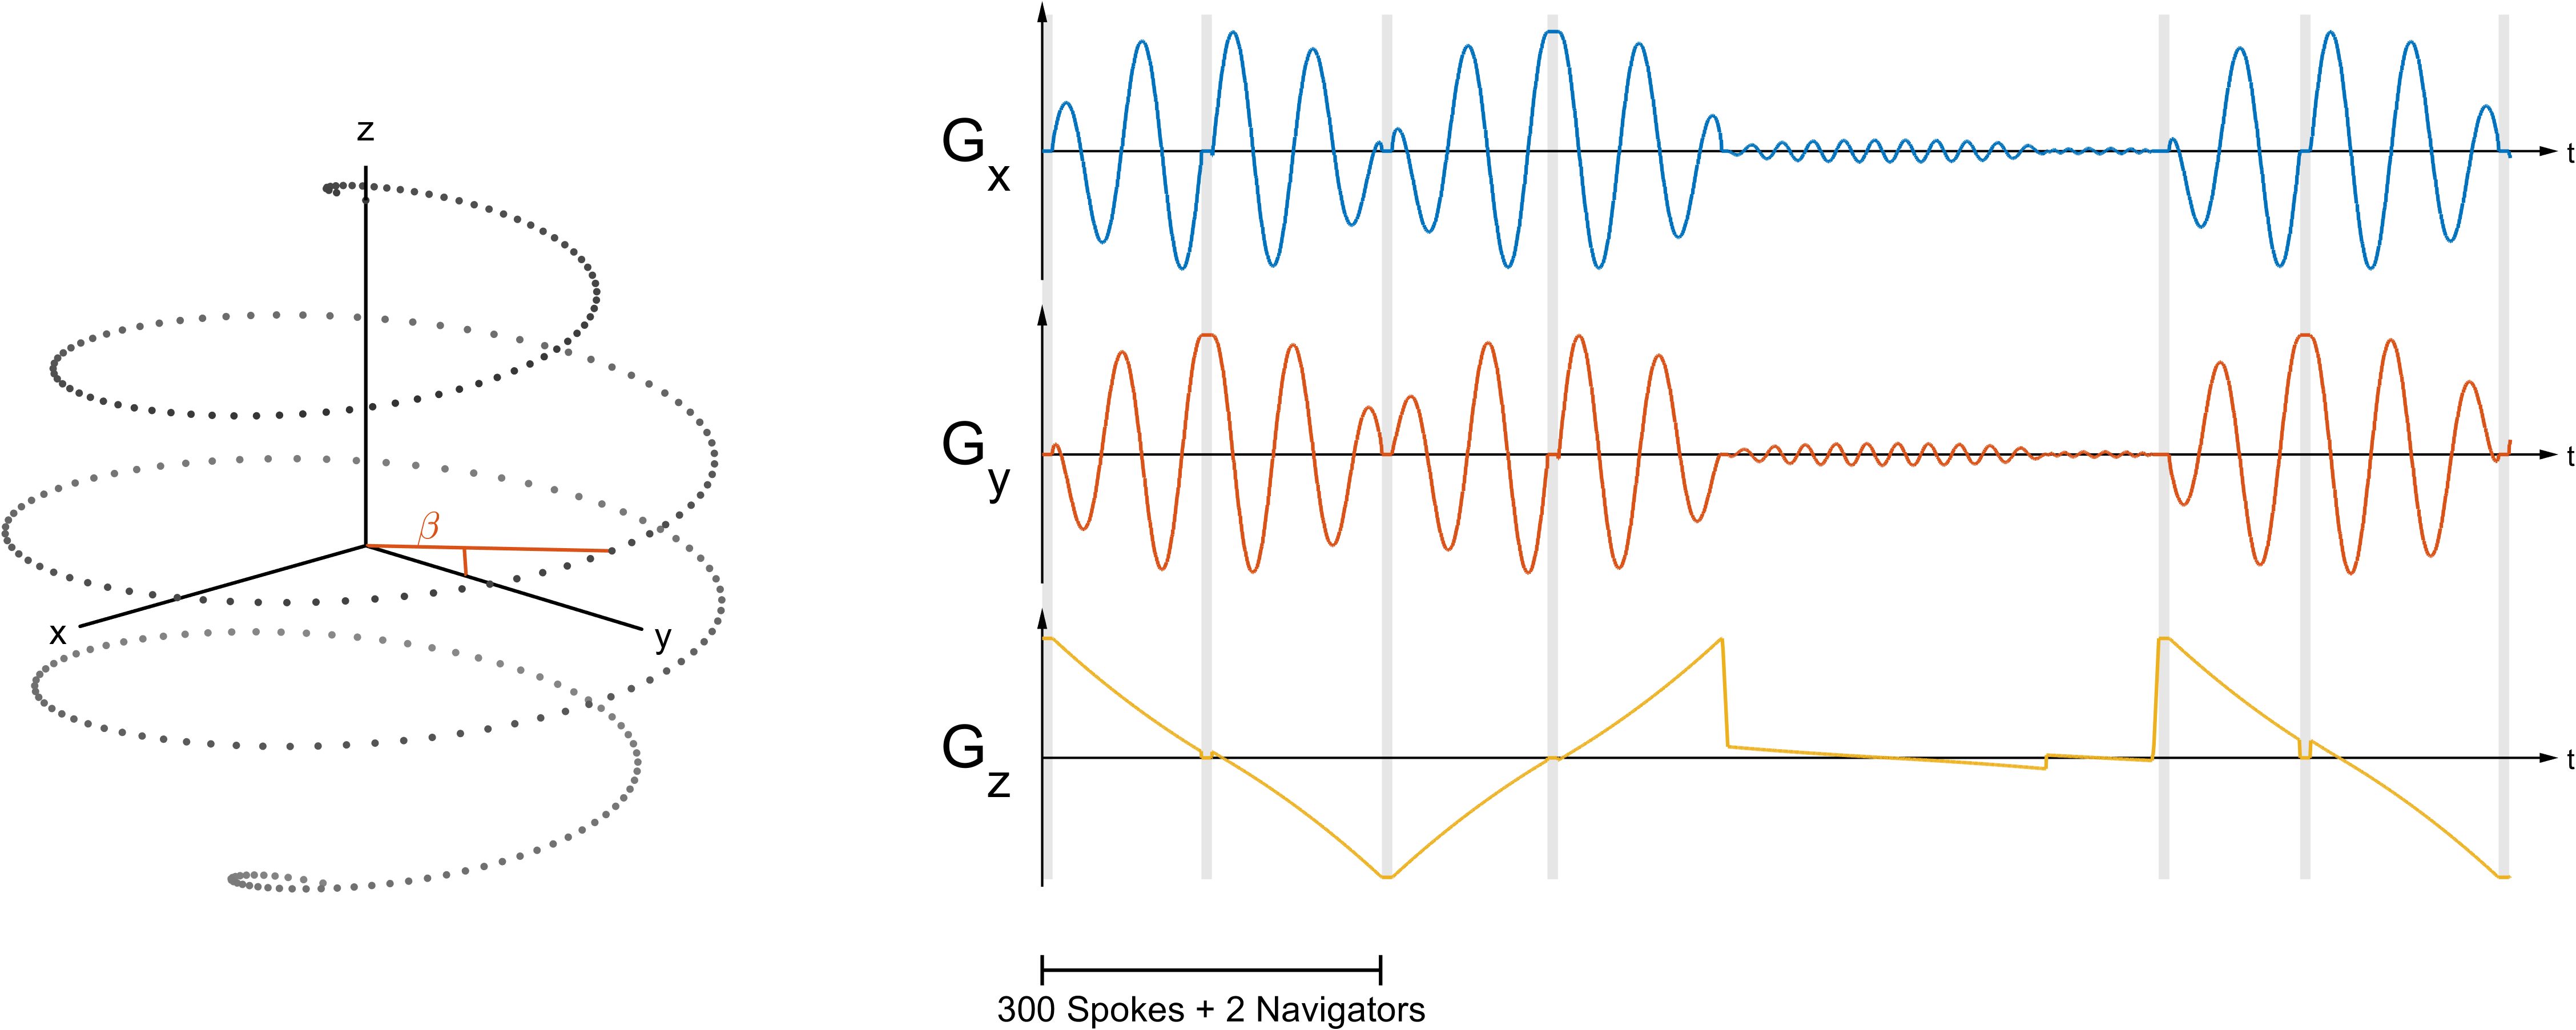
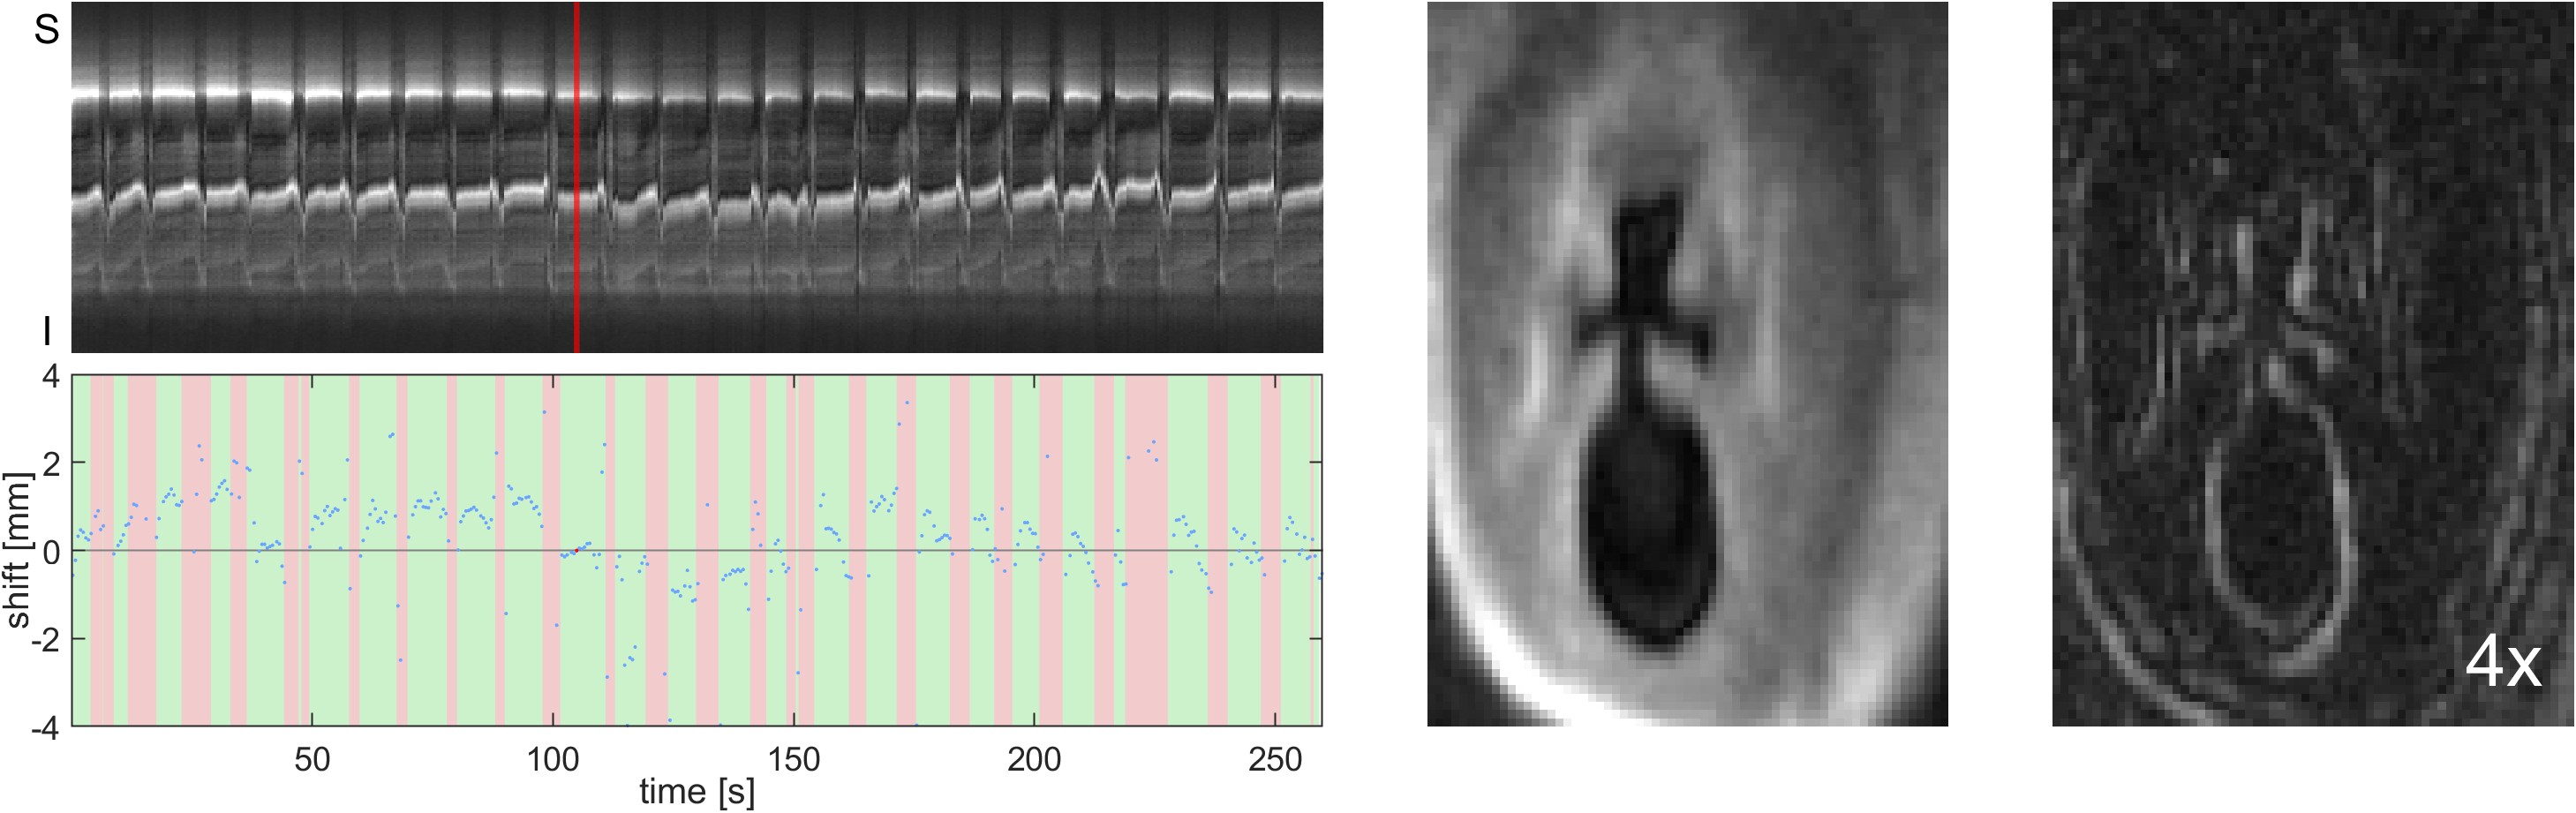
In the newly developed ZTE sequence, a gradient strength of $$$G_1=23,6$$$mT/m was constantly applied and data were acquired during 640μs along each spoke (dead time $$$\delta=30$$$ms, $$$\Delta x=0.8$$$mm, $$$\alpha=3$$$°, TR=0.85ms). The spokes follow a spiral phyllotaxis10 trajectory, where the polar angle, $$$\theta$$$, is increased in 300 steps from $$$\theta=0$$$° (parallel to z-axis) to $$$\theta=\pi$$$ (anti-parallel to z-axis). Thus, additional z-projections can be acquired every 255ms without additional gradient switching. These are used as a navigator, as the larynx can move by several millimeters during the measurement (especially in SI direction)8. The larynx is much less mobilein RL- and AP- directions andprojections in x- and y-direction are acquired only every 510ms. Each navigator is compared to a reference navigator using phase only cross correlation11,12 to correct the measured data prior to reconstruction. The measurements were interleaved with a second acquisition using lower gradients ($$$G_2=2,2$$$mT/m, $$$G_3=0,6$$$mT/m) to acquire the central k-space volume. During MRI in a 3T system (Siemens PRISMA), the volunteers’ larynx was positioned close to the isocenter to reduce artifacts caused by the finite duration of the rectangular excitation pulse (t=12ms). Small displacements of the VFs from the isocenter (r=24mm) were corrected by adjusting the frequency of the RF pulse for each projection13. For MR-signal reception, a single-channel loop coil (d=7cm) was placed on the larynx, and volunteers were asked to sing during the 4min 20s long ZTE acquisition at a constant frequency of ($$$f=150$$$Hz) with intermittent breathing at will. To synchronize the VF motion with the MRI, we measured the sound pressure, $$$p(t)$$$, generated at the mouth with a single-channel microphone. To suppress the gradient noise, a low-pass Butterworth filter (6th order, $$$f_0=180$$$Hz) was applied to the sound signal. The VF motion phase was obtained from a fit of a sine function to $$$p(t)$$$ for each acquisition. Using this phase, data are sorted into 10 phases (frames) using a total variation constraint along the temporal dimension (BART14).Result
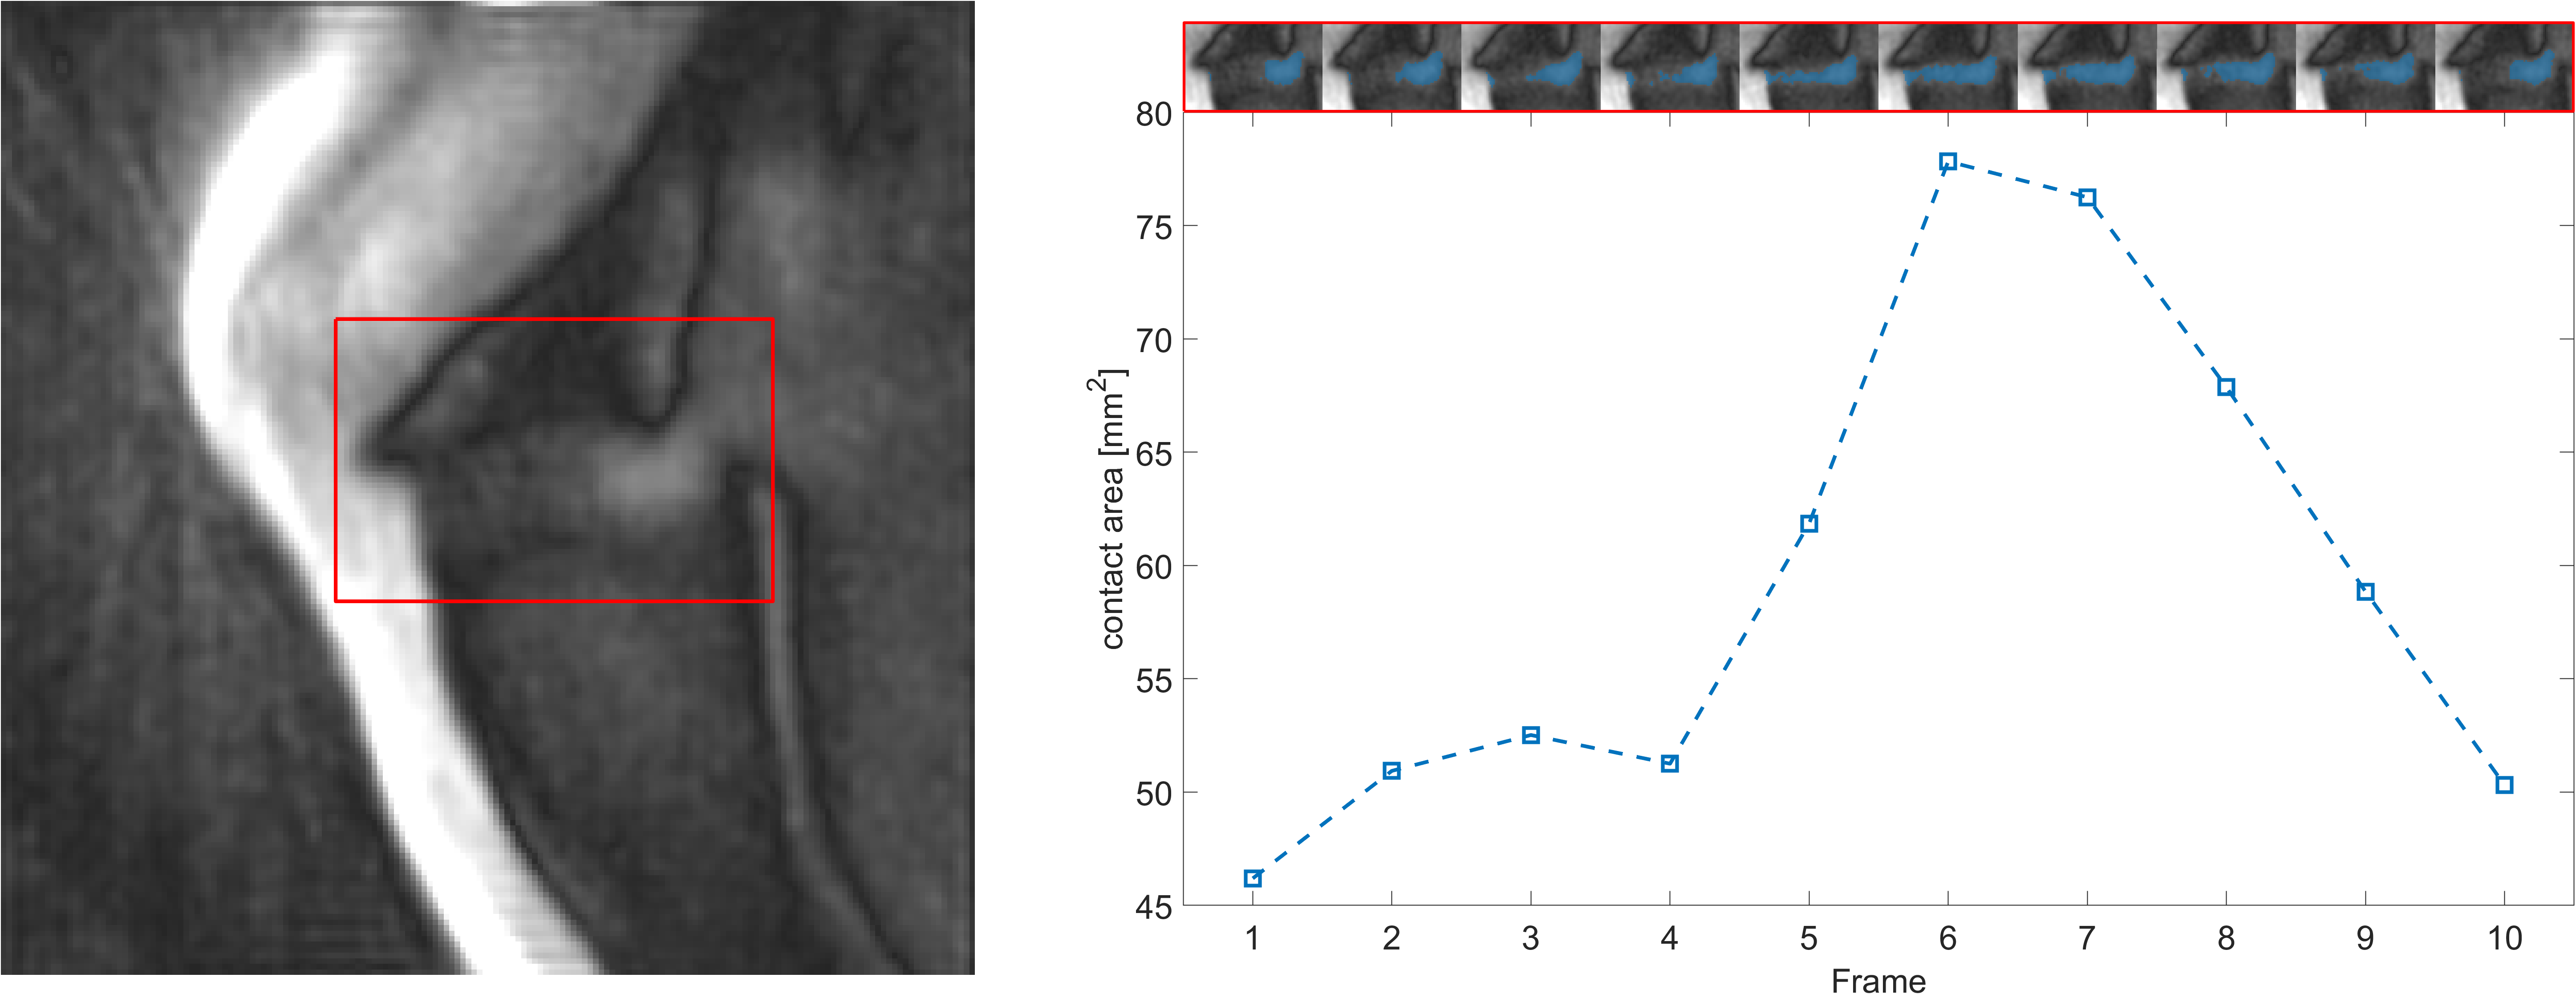
During Phonation the SI-displacement of the larynx was between –4mm and +3mm (std=0.8mm), and the VF oscillation frequency was 149±2Hz, yielding a temporal resolution of 671μs per frame (Figure 3). Transverse images of the larynx show a wide opening of up to 2.4mm across the glottis, and the coronal view shows a vertical displacement of 1mm. From the sagittal slices we could estimate the variation of contact area between 46 and 78mm2 in a male volunteer (26y, 80kg). Figure 5 shows a model of the reconstructed inner larynx surface obtained from the data by thresholding.Discussion
In this work we for the first time measure VF oscillations in humans with a full ultra-high spatio-temporal 3D+t resolution. The ZTE technique is beneficial for this measurement as it provides a very short encoding time, but it intrinsically has a low tissue contrast. However, for VF motion studies the boundary between the VF tissue and the air in the glottis can be clearly visualized. A higher spatio-temporal resolution is currently limited by the unwanted slice selection of the RF pulse which could be reduced by modulating its phase. The silent nature of ZTE makes it the ideal candidate for speech and singing research. In voice research, the access to the vocal folds is limited, requires unpleasant insertion of a laryngoscope into the pharynx and can be prone to perspective distortion15. In contrast, MRI allows the extraction of VF contact area, which is notoriously difficult to measure in-vivo, and provides exact anatomical information as well as other functional parameters of the entire VF oscillation.Acknowledgements
Grant support from the Deutsche Forschungsgemeinschaft (DFG) under grant numbers FI 2803/1-1 and TR 1491/4-1 is gratefully acknowledged.References
[1] M. J. Oertel, “Laryngostroboscopische Beobachtungen über die Bildung der Register bei der menschlichen Stimme,” Centralbl Med Wiss, vol. 16, pp. 99–101, 1878.
[2] J. G. Švec and H. K. Schutte, “Videokymography: High-speed line scanning of vocal fold vibration,” Journal of Voice, vol. 10, no. 2, pp. 201–205, Jan. 1996, doi: 10.1016/S0892-1997(96)80047-6.
[3] G. Luegmair, D. D. Mehta, J. B. Kobler, and M. Döllinger, “Three-Dimensional Optical Reconstruction of Vocal Fold Kinematics Using High-Speed Video With a Laser Projection System,” IEEE Transactions on Medical Imaging, vol. 34, no. 12, pp. 2572–2582, Dec. 2015, doi: 10.1109/TMI.2015.2445921.
[4] C. A. Coughlan et al., “In vivo cross-sectional imaging of the phonating larynx using long-range Doppler optical coherence tomography,” Sci Rep, vol. 6, no. 1, Art. no. 1, Mar. 2016, doi: 10.1038/srep22792.
[5] Y. W. Shau, C. L. Wang, F. J. Hsieh, and T. Y. Hsiao, “Noninvasive assessment of vocal fold mucosal wave velocity using color doppler imaging,” Ultrasound Med Biol, vol. 27, no. 11, Art. no. 11, Nov. 2001, doi: 10.1016/s0301-5629(01)00453-7.
[6] P. Schultz, “Vocal fold cancer,” European Annals of Otorhinolaryngology, Head and Neck Diseases, vol. 128, no. 6, Art. no. 6, Dec. 2011, doi: 10.1016/j.anorl.2011.04.004.
[7] J. Fischer, T. Abels, A. C. Özen, M. Echternach, B. Richter, and M. Bock, “Magnetic resonance imaging of the vocal fold oscillations with sub-millisecond temporal resolution,” Magnetic Resonance in Medicine, vol. 83, no. 2, Art. no. 2, 2020, doi: 10.1002/mrm.27982.
[8] J. Fischer et al., “Sub-millisecond 2D MRI of the vocal fold oscillation using single-point imaging with rapid encoding,” Magn Reson Mater Phy, Sep. 2021, doi: 10.1007/s10334-021-00959-4.
[9] Z. Zhong et al., “Visualization of Human Aortic Valve Dynamics Using Magnetic Resonance Imaging with Sub-Millisecond Temporal Resolution,” Journal of Magnetic Resonance Imaging, vol. 54, no. 4, pp. 1246–1254, 2021, doi: 10.1002/jmri.27603.
[10] D. Piccini, A. Littmann, S. Nielles-Vallespin, and M. O. Zenge, “Spiral phyllotaxis: The natural way to construct a 3D radial trajectory in MRI,” Magnetic Resonance in Medicine, vol. 66, no. 4, pp. 1049–1056, 2011, doi: 10.1002/mrm.22898.
[11] C. D. Kuglin and D. C. Hines, “The Phase Correlation Image Alignment Method,” in Proc. IEEE 1975 Int. Conf. Cybernet. Society, New York, 1975, pp. 163–165. [Online]. Available: http://boutigny.free.fr/Astronomie/AstroSources/Kuglin-Hines.pdf
[12] A. Reichert, M. Bock, S. Reiss, C. G. Overduin, J. J. Fütterer, and A. J. Krafft, “Simultaneous slice excitation for accelerated passive marker tracking via phase-only cross correlation (POCC) in MR-guided needle interventions,” Magn Reson Mater Phy, vol. 31, no. 6, Art. no. 6, Dec. 2018, doi: 10.1007/s10334-018-0701-0.
[13] S. Ilbey, M. Jung, U. Emir, M. Bock, and A. C. Özen, “Characterizing Off-center MRI with ZTE,” Zeitschrift für Medizinische Physik, Oct. 2022, doi: 10.1016/j.zemedi.2022.09.002.
[14] M. Uecker et al., “Berkeley Advanced Reconstruction Toolbox,” in In Proc. Intl. Soc. Mag. Reson. Med., Toronto, 2015, p. 2486. [Online]. Available: http://index.mirasmart.com/ismrm2015/PDFfiles/2486.pdf [15] R. Veltrup, S. Kniesburges, and M. Semmler, “Influence of Perspective Distortion in Laryngoscopy,” Journal of Speech, Language, and Hearing Research, vol. 66, no. 9, pp. 3276–3289, Sep. 2023, doi: 10.1044/2023_JSLHR-23-00027.
Figures
Two views of the reconstructed inner wall of the larynx. Left: Top view onto the vocal plane, similar to a laryngoscopy. Right. Rotation in the AP-RL plane around the larynx. In both orientations the onset of the glottal opening at the anterior side is clearly visible.