0940
Characterization of neurite and soma organization in the in vivo spinal cord with diffusion MRI1Vanderbilt University Medical Center, Nahville, TN, United States, 2CUBRIC, School of Psychology, Cardiff University, Cardiff, United Kingdom, 3Department of Applied Mathematics and Computer Science, Technical University of Denmark, Lyngby, Denmark, 4Vanderbilt University, Nashville, TN, United States
Synopsis
Keywords: Microstructure, Spinal Cord, Spinal cord; soma; microstructure; modeling; diffusion
Motivation: Multicompartment models of diffusion MRI have proven valuable in the brain.
Goal(s): However, application of these models in the spinal cord (SC) remains relatively understudied.
Approach: Here, we address challenges related to acquisition and image processing in order to apply the Soma and Neurite Density Imaging (SANDI) model in the human SC in 11 healthy subjects.
Results: We show that SANDI captures differences between white and gray matter tissue types and across the functionally relevant white matter pathways and gray matter architectures and has the potential to act as a biomarker for biomedical applications.
Impact: We show that the Soma and Neurite Density Imaging (SANDI) diffusion model is a feasible method to characterize both white and gray matter tissue microstructure of the in vivo human spinal cord on clinical scanners.
Introduction
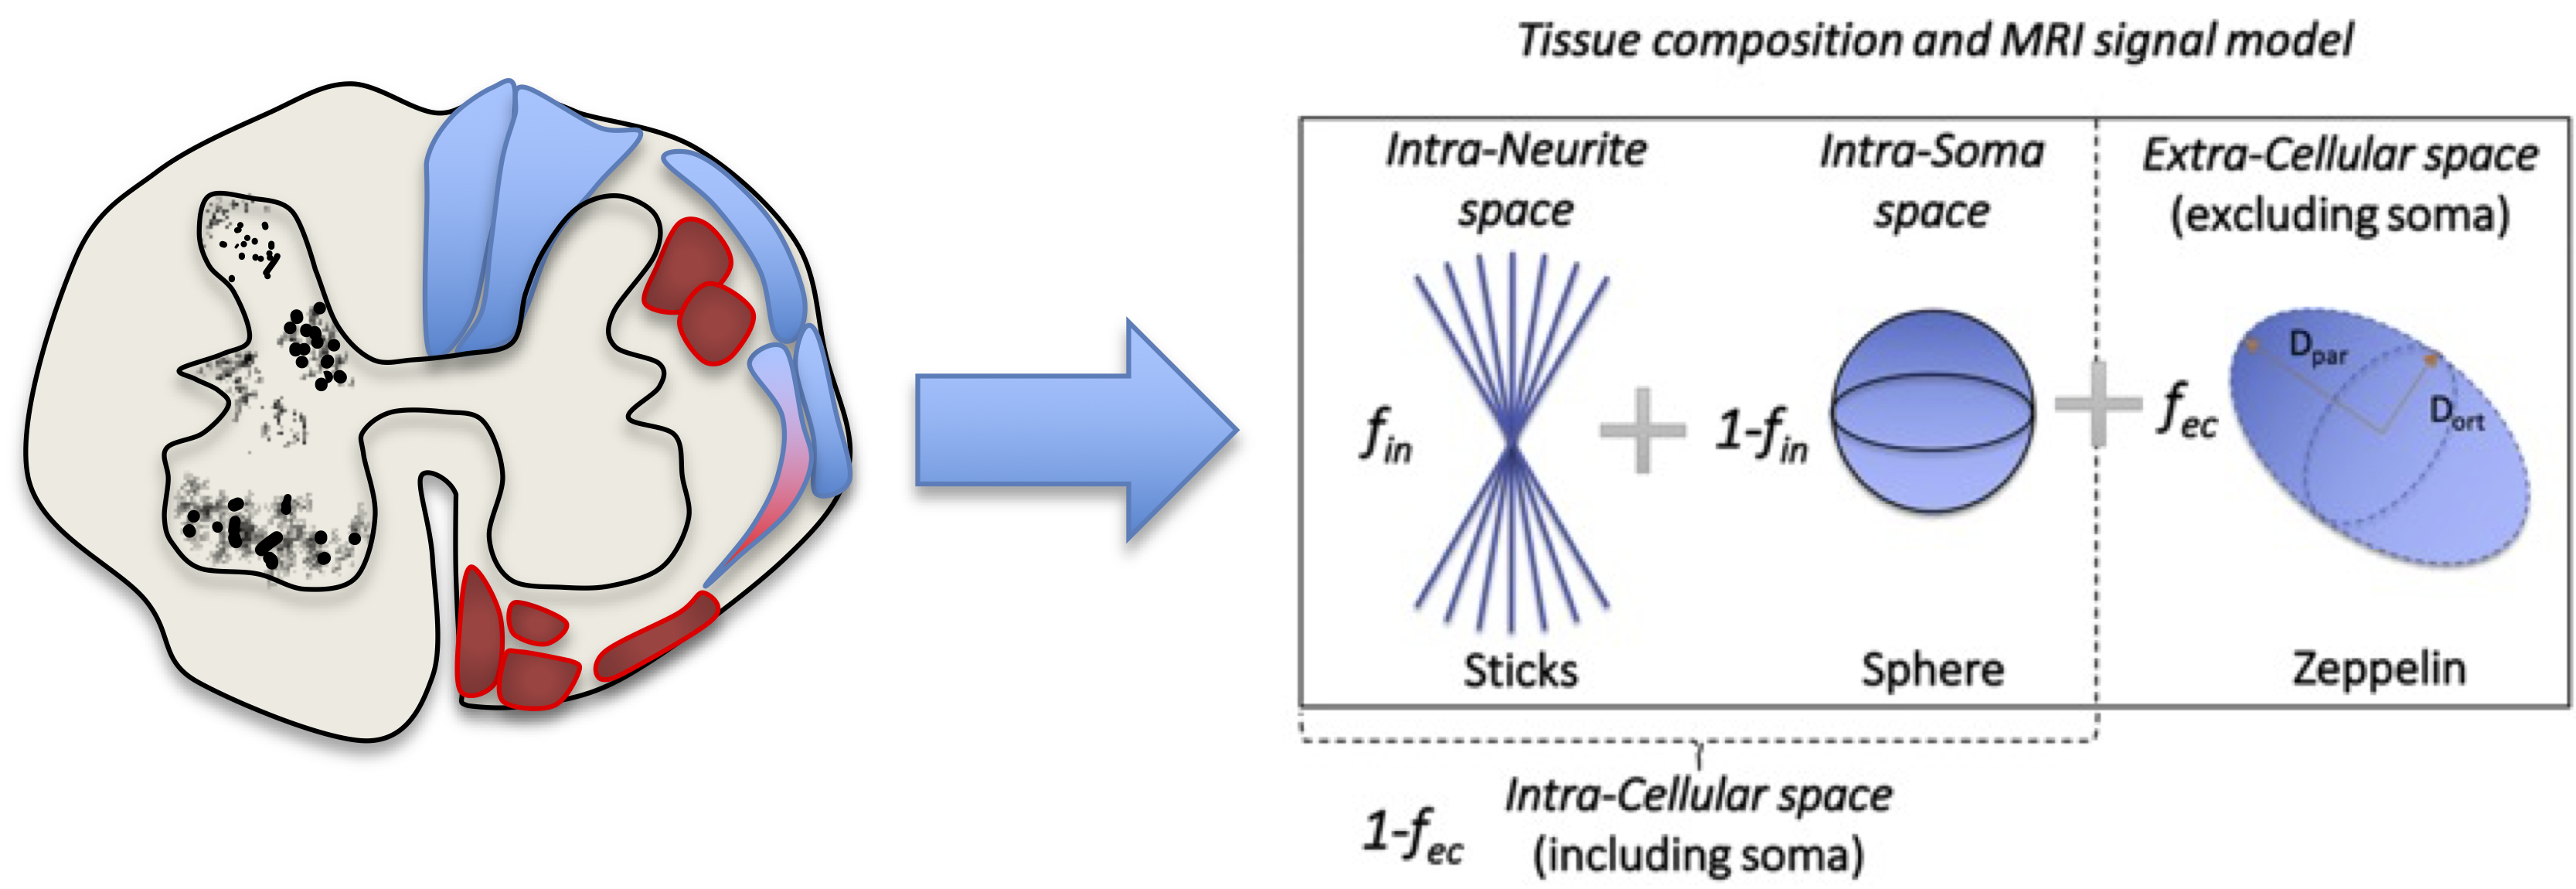
Multicompartment tissue modeling using diffusion MRI has proven valuable in the brain, offering novel contrasts sensitive to the cellular level microstructure. Recently, the Soma And Neurite Density Imaging (SANDI) model has been proposed to capture features of both white and gray matter tissue microenvironments [1]. SANDI provides maps of soma and neurite signal fractions (Figure 1), as well as soma size, that mirrors contrasts obtained from direct optical imaging of histological samples.The translation of this model to the spinal cord (SC) would be invaluable for studying neurodegenerative and immunological diseases, or traumatic injuries, that affect this structure. However, there are several challenges to application in the cord, including a long scan time with demanding high b-value acquisitions, respiratory and cardiac motion that causes artifacts in SC diffusion images, the low SNR of SC diffusion images, and the lack of preprocessing pipelines optimized for SC imaging [2, 3]. Here, we propose a clinically feasible 16-minute acquisition [4] which allows characterization of both white and gray matter microstructure. We show representative maps on 11 healthy controls and characterize the SANDI-derived contrasts within and across both tissue types.
Methods
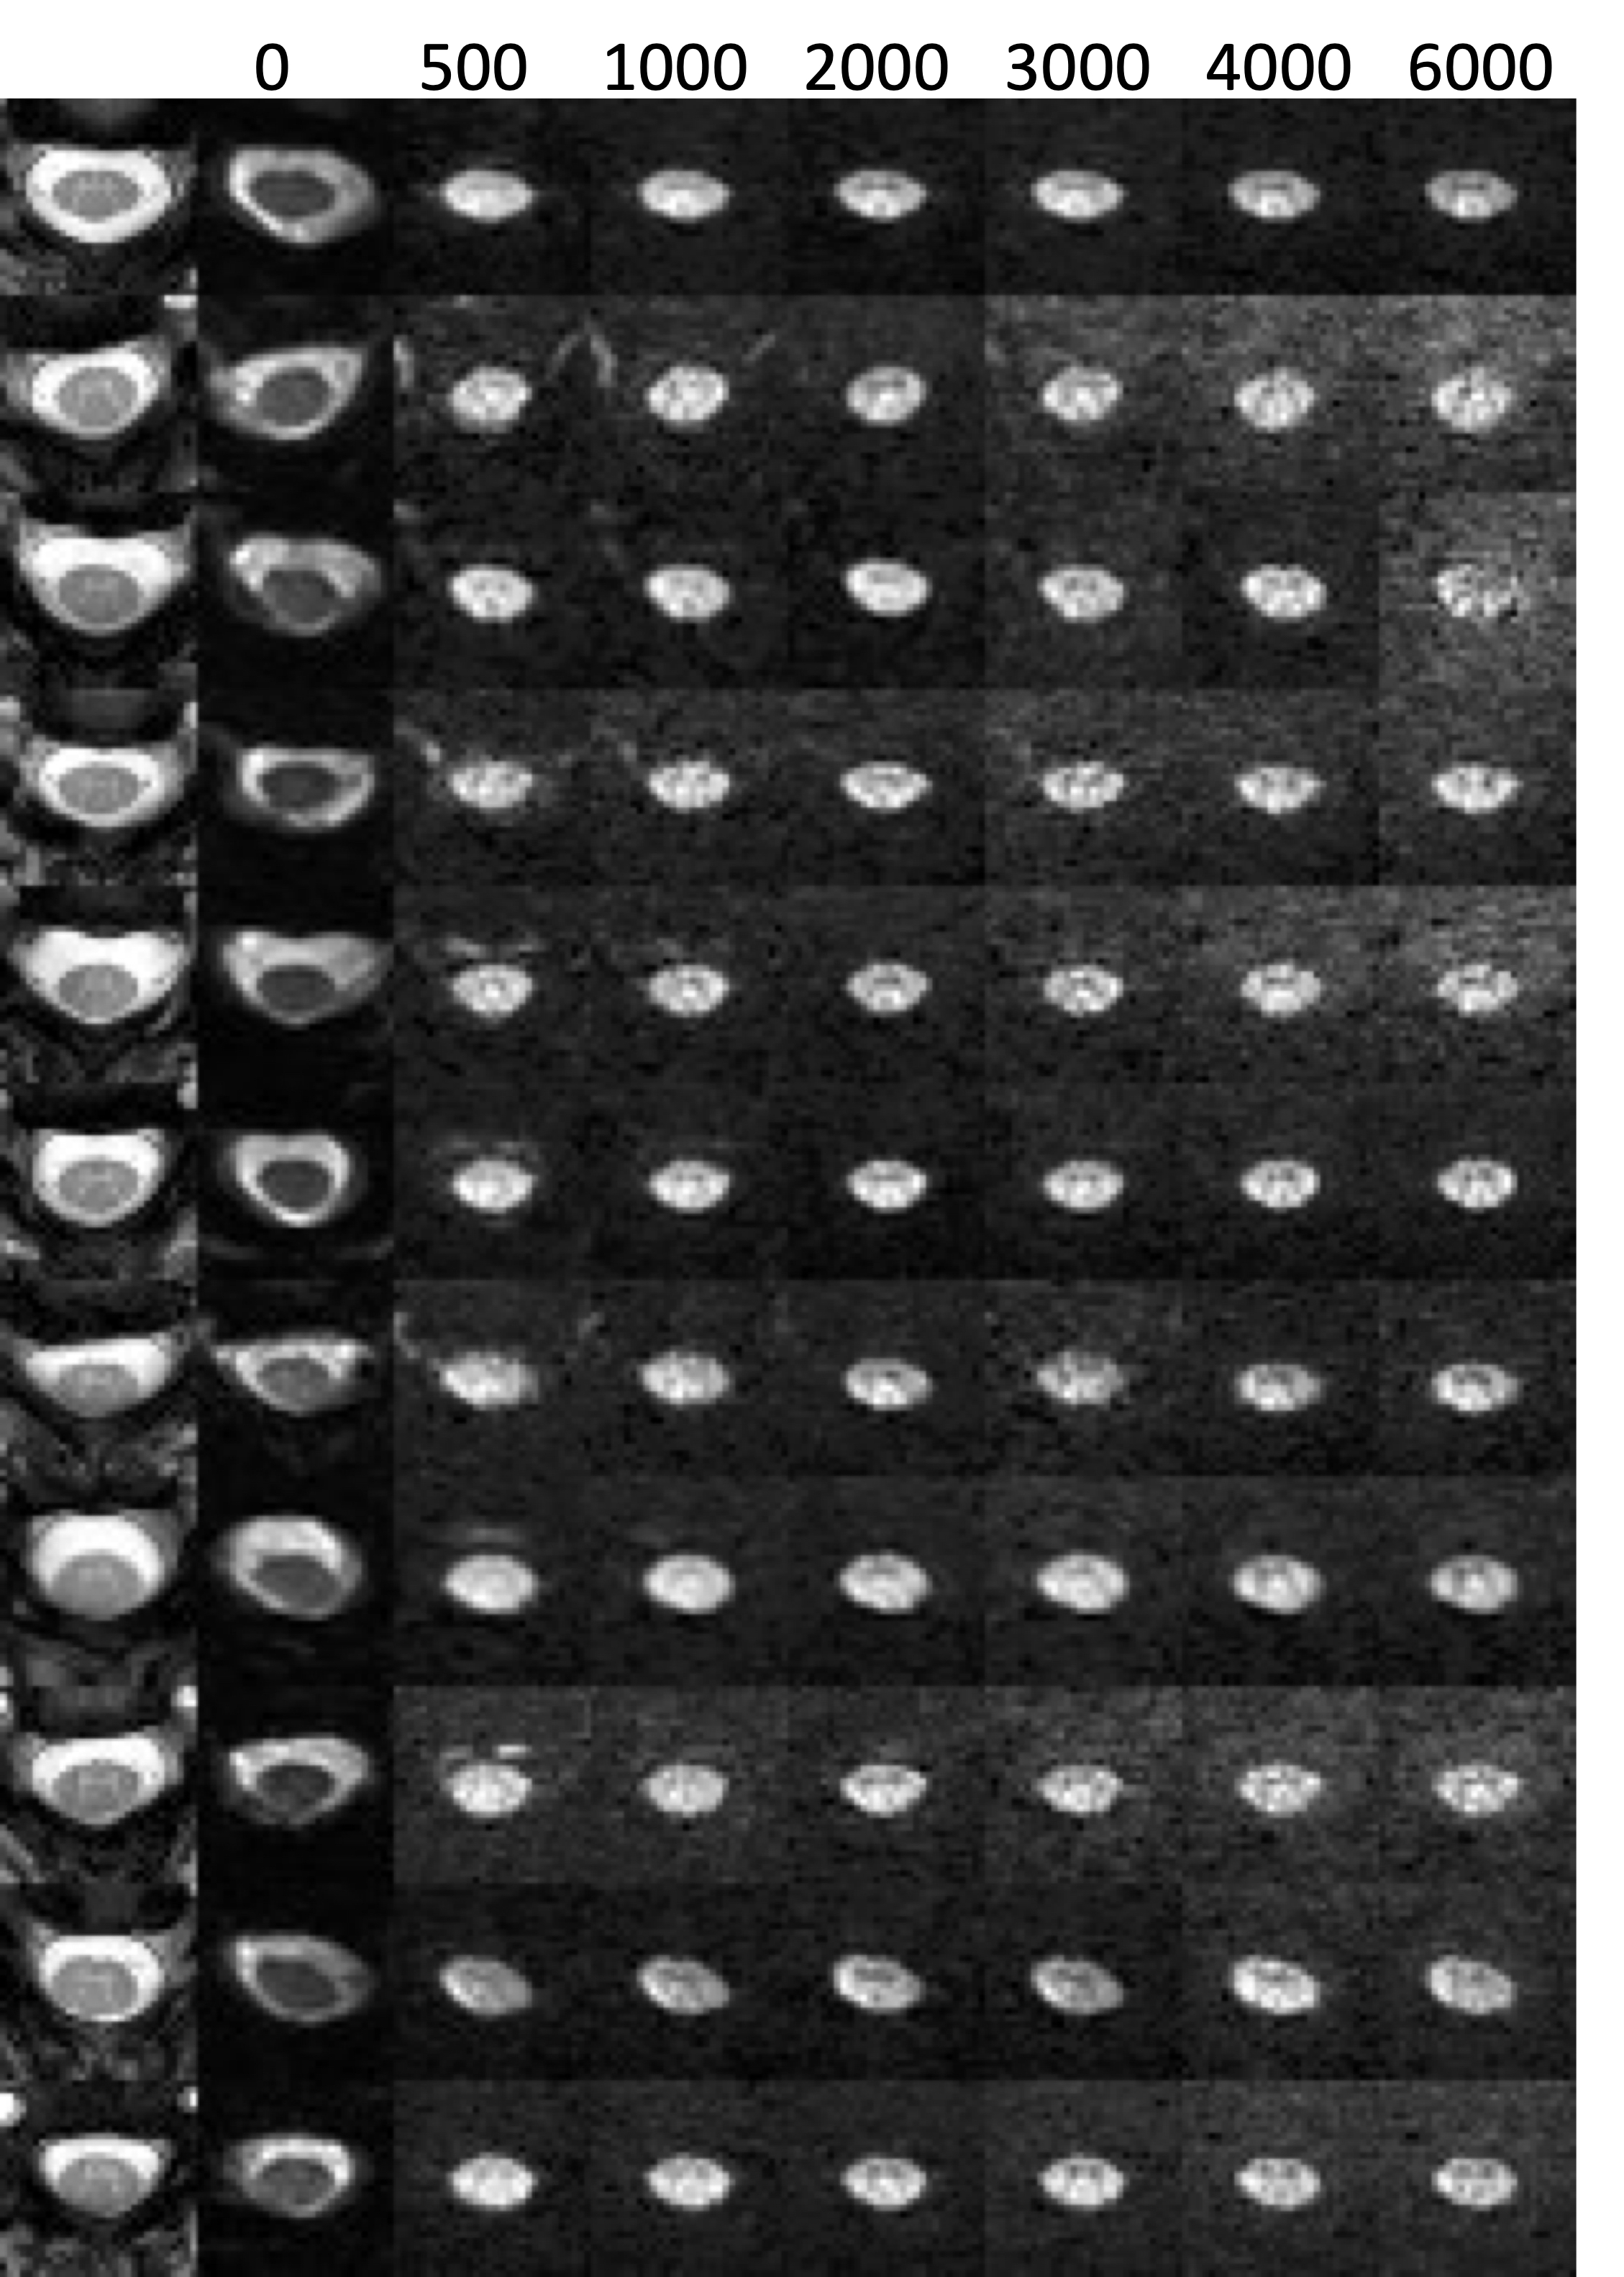
Data acquisitionThe scan cohort consisted of N=11 healthy volunteers. All scanning was performed on a 3T Philips Ingenia with 80mT/m gradients. Acquisitions included a high-resolution multi-echo gradient echo (mFFE) (TR/TE/ΔTE=700/8.0/9.2ms, α=28 degrees, slices=14) for co-registration and to serve as a reference image. The diffusion sequences consisted of a spin echo with single-shot EPI readout (TR/TE=4400/100ms, resolution=1.1x1.1mm2, slice thickness=5mm, partial Fourier=0.693, slices=14, time=16 minutes, duration/separation=24/51ms). Images were centered between C3/C4. A multi-shell acquisition was used with b-values 100, 500, 1000, 2000, 3000, 4000, and 6000 (at 8, 8, 16, 24, 32, 40, 48 directions, respectively) with 22 b=0 volumes. Here, two innovations were needed, including removing cardiac triggering to maximize acquisition per time [5] and minimizing the number of directions per shell to minimize scan time while maintaining robust fitting [6].
Data Preprocessing
Diffusion data were denoised and Rician bias corrected with variance-stabilizing transformation and optimal singular-value manipulation [7]. Motion correction was performed using Spinal Cord Toolbox [8]. An additional denoising algorithm, Patch2Self [9, 10], was performed, which further attenuates residual motion and mitigates signal dropout due to its patch-based regression [11]. This resulted in high quality, high signal-to-noise ratio images for all subjects at all b-values (Figure 2).
SANDI modeling
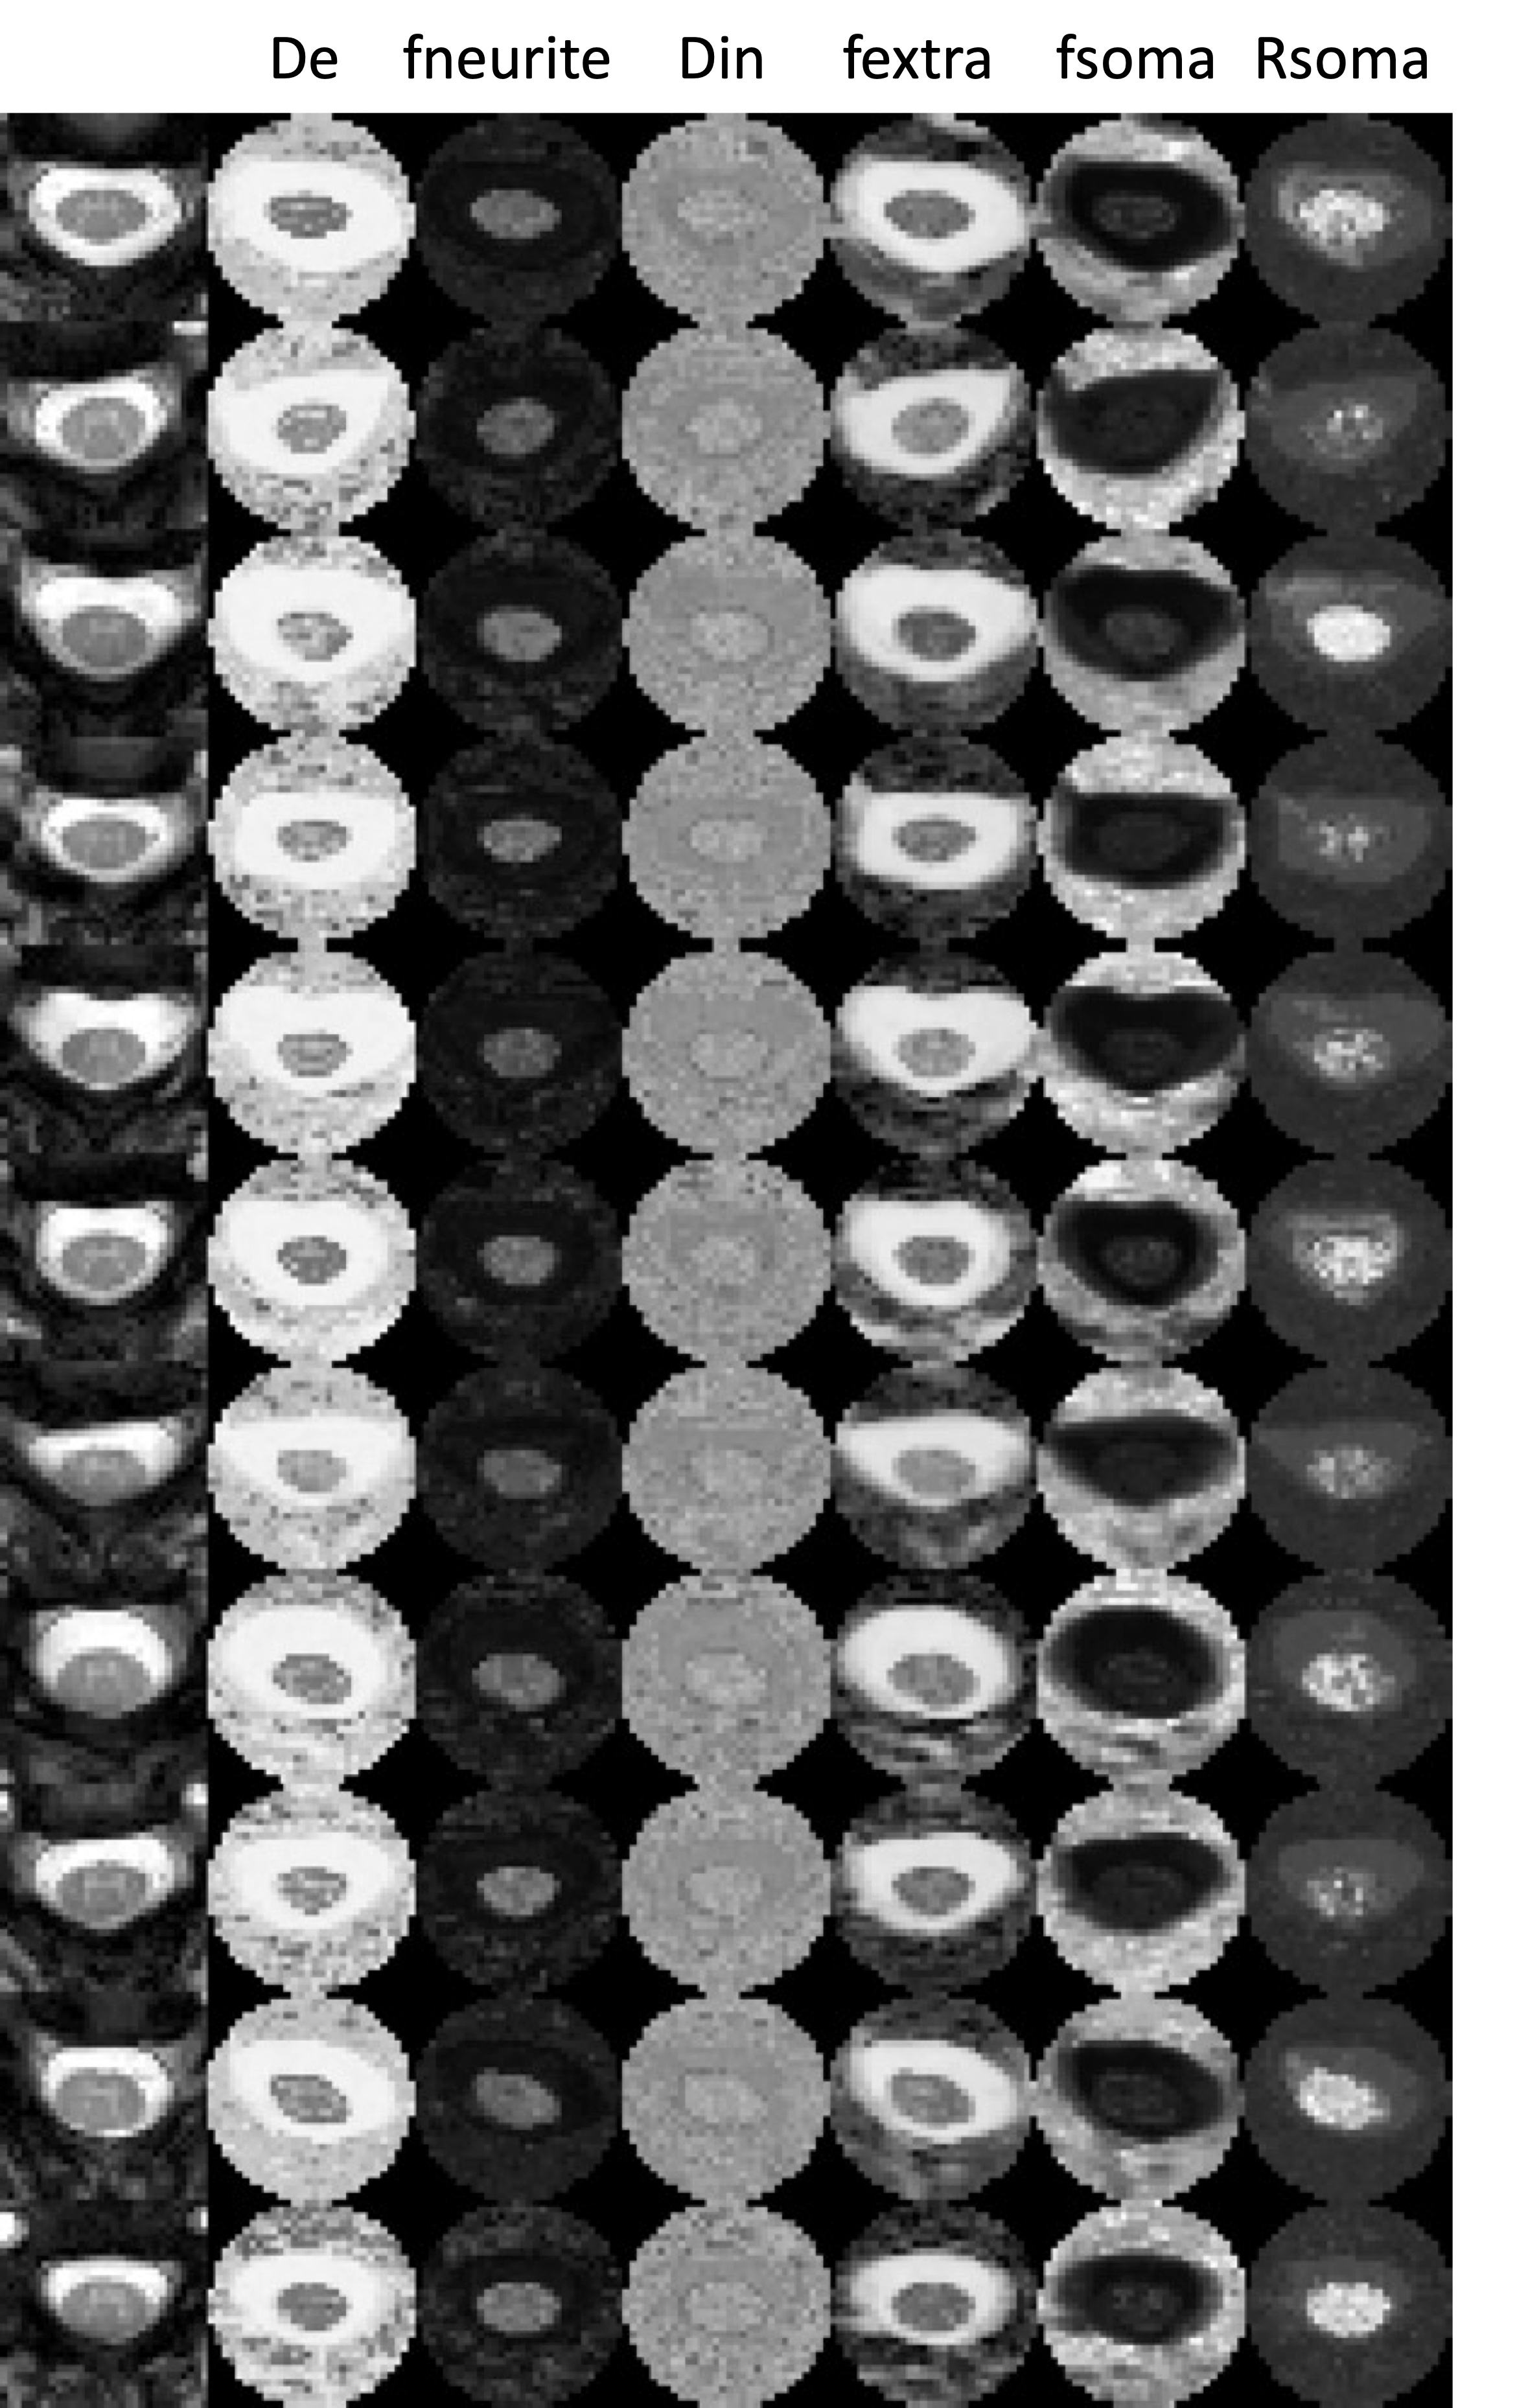
SANDI modeling was performed using the SANDI Matlab Toolbox (https://github.com/palombom/SANDI-Matlab-Toolbox-Latest-Release). This resulted in derived measures of extracellular diffusivity (De), neurite signal fraction (fneurite), intraneurite diffusivity (Din), extracellular signal fraction (fextra), soma signal fraction (fsoma), and soma radii (Rsoma). The average value of each metric was extracted from both white and gray matter, as well as across ascending/descending white matter pathways and the dorsal/intermediate/ventral horns, defined by the PAM50 SC atlas [12].
Results
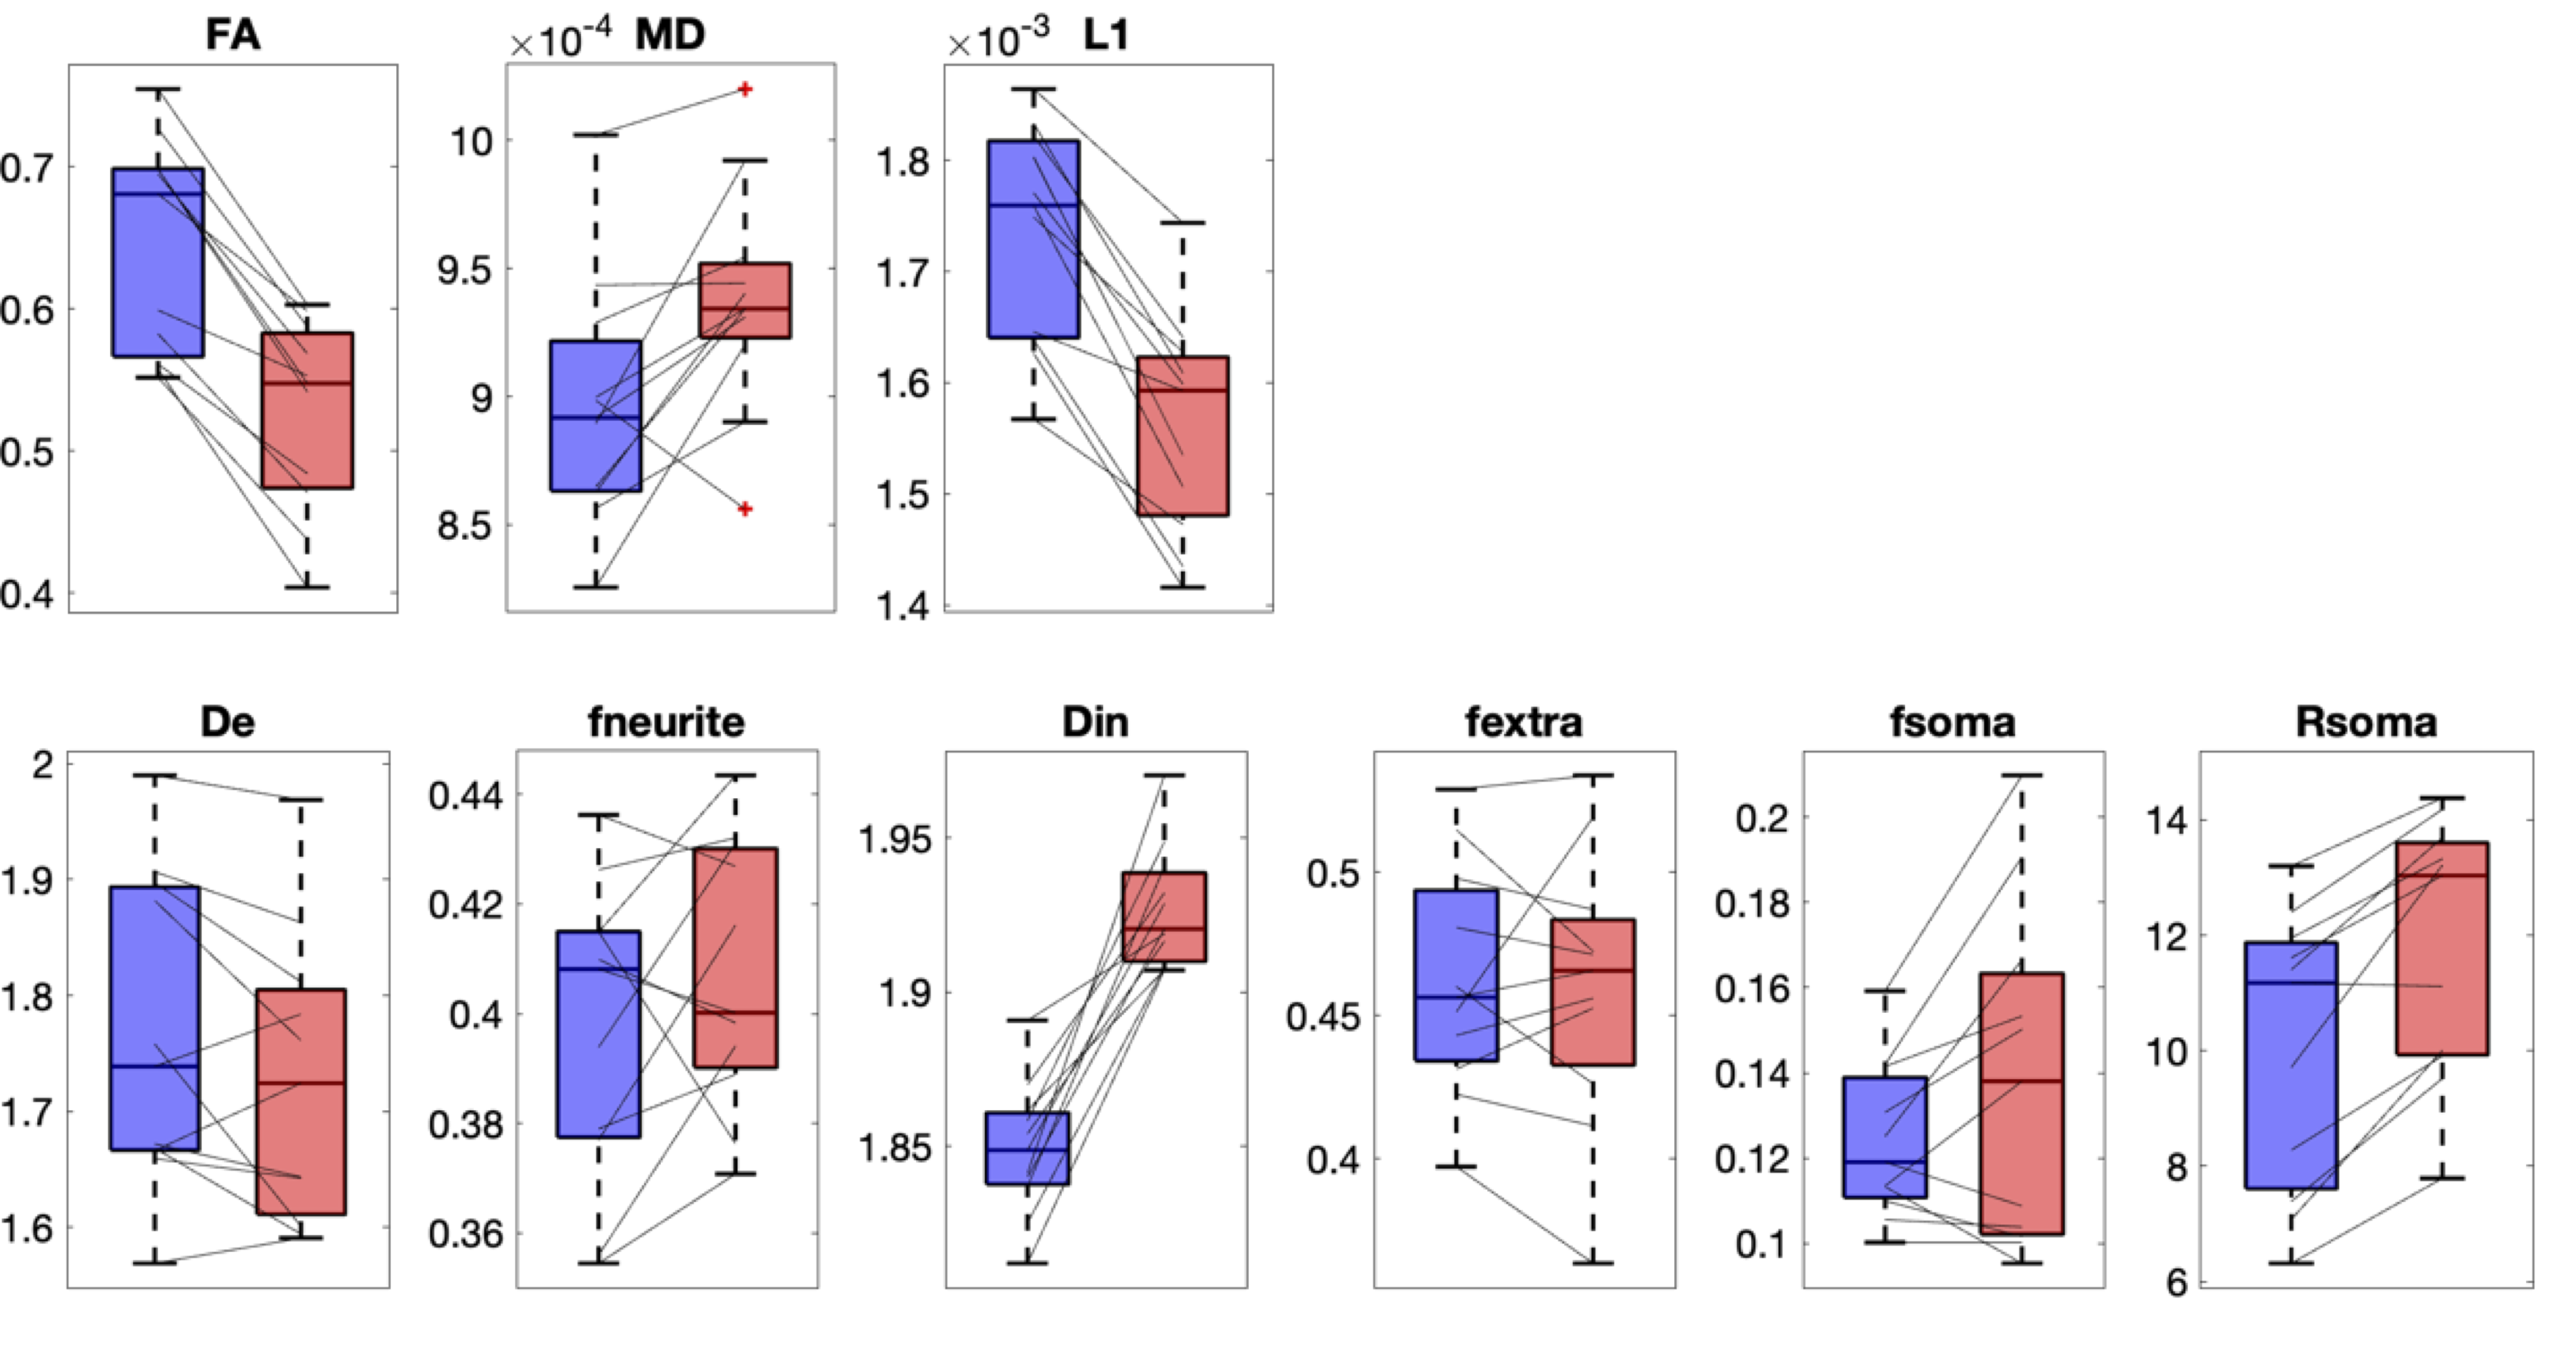
Figure 3 shows SANDI parameter maps for all 11 subjects. White and gray matter contrast is most visible in diffusivities (De, Din), and soma maps (fsoma, Rsoma) – although large partial volume effects are apparent, contrast is reasonable within the cord and within ranges observed in the brain.Figure 4 plots white matter and gray matter averaged values of diffusion tensor metrics and SANDI metrics. In agreement with qualitative observations, white matter has a reduced Din, increased De, and decreased fsom and Rsoma. The contrast with largest differences is Din. Here, DTI is shown as a benchmark, where all three metrics have clear white/gray matter contrasts.
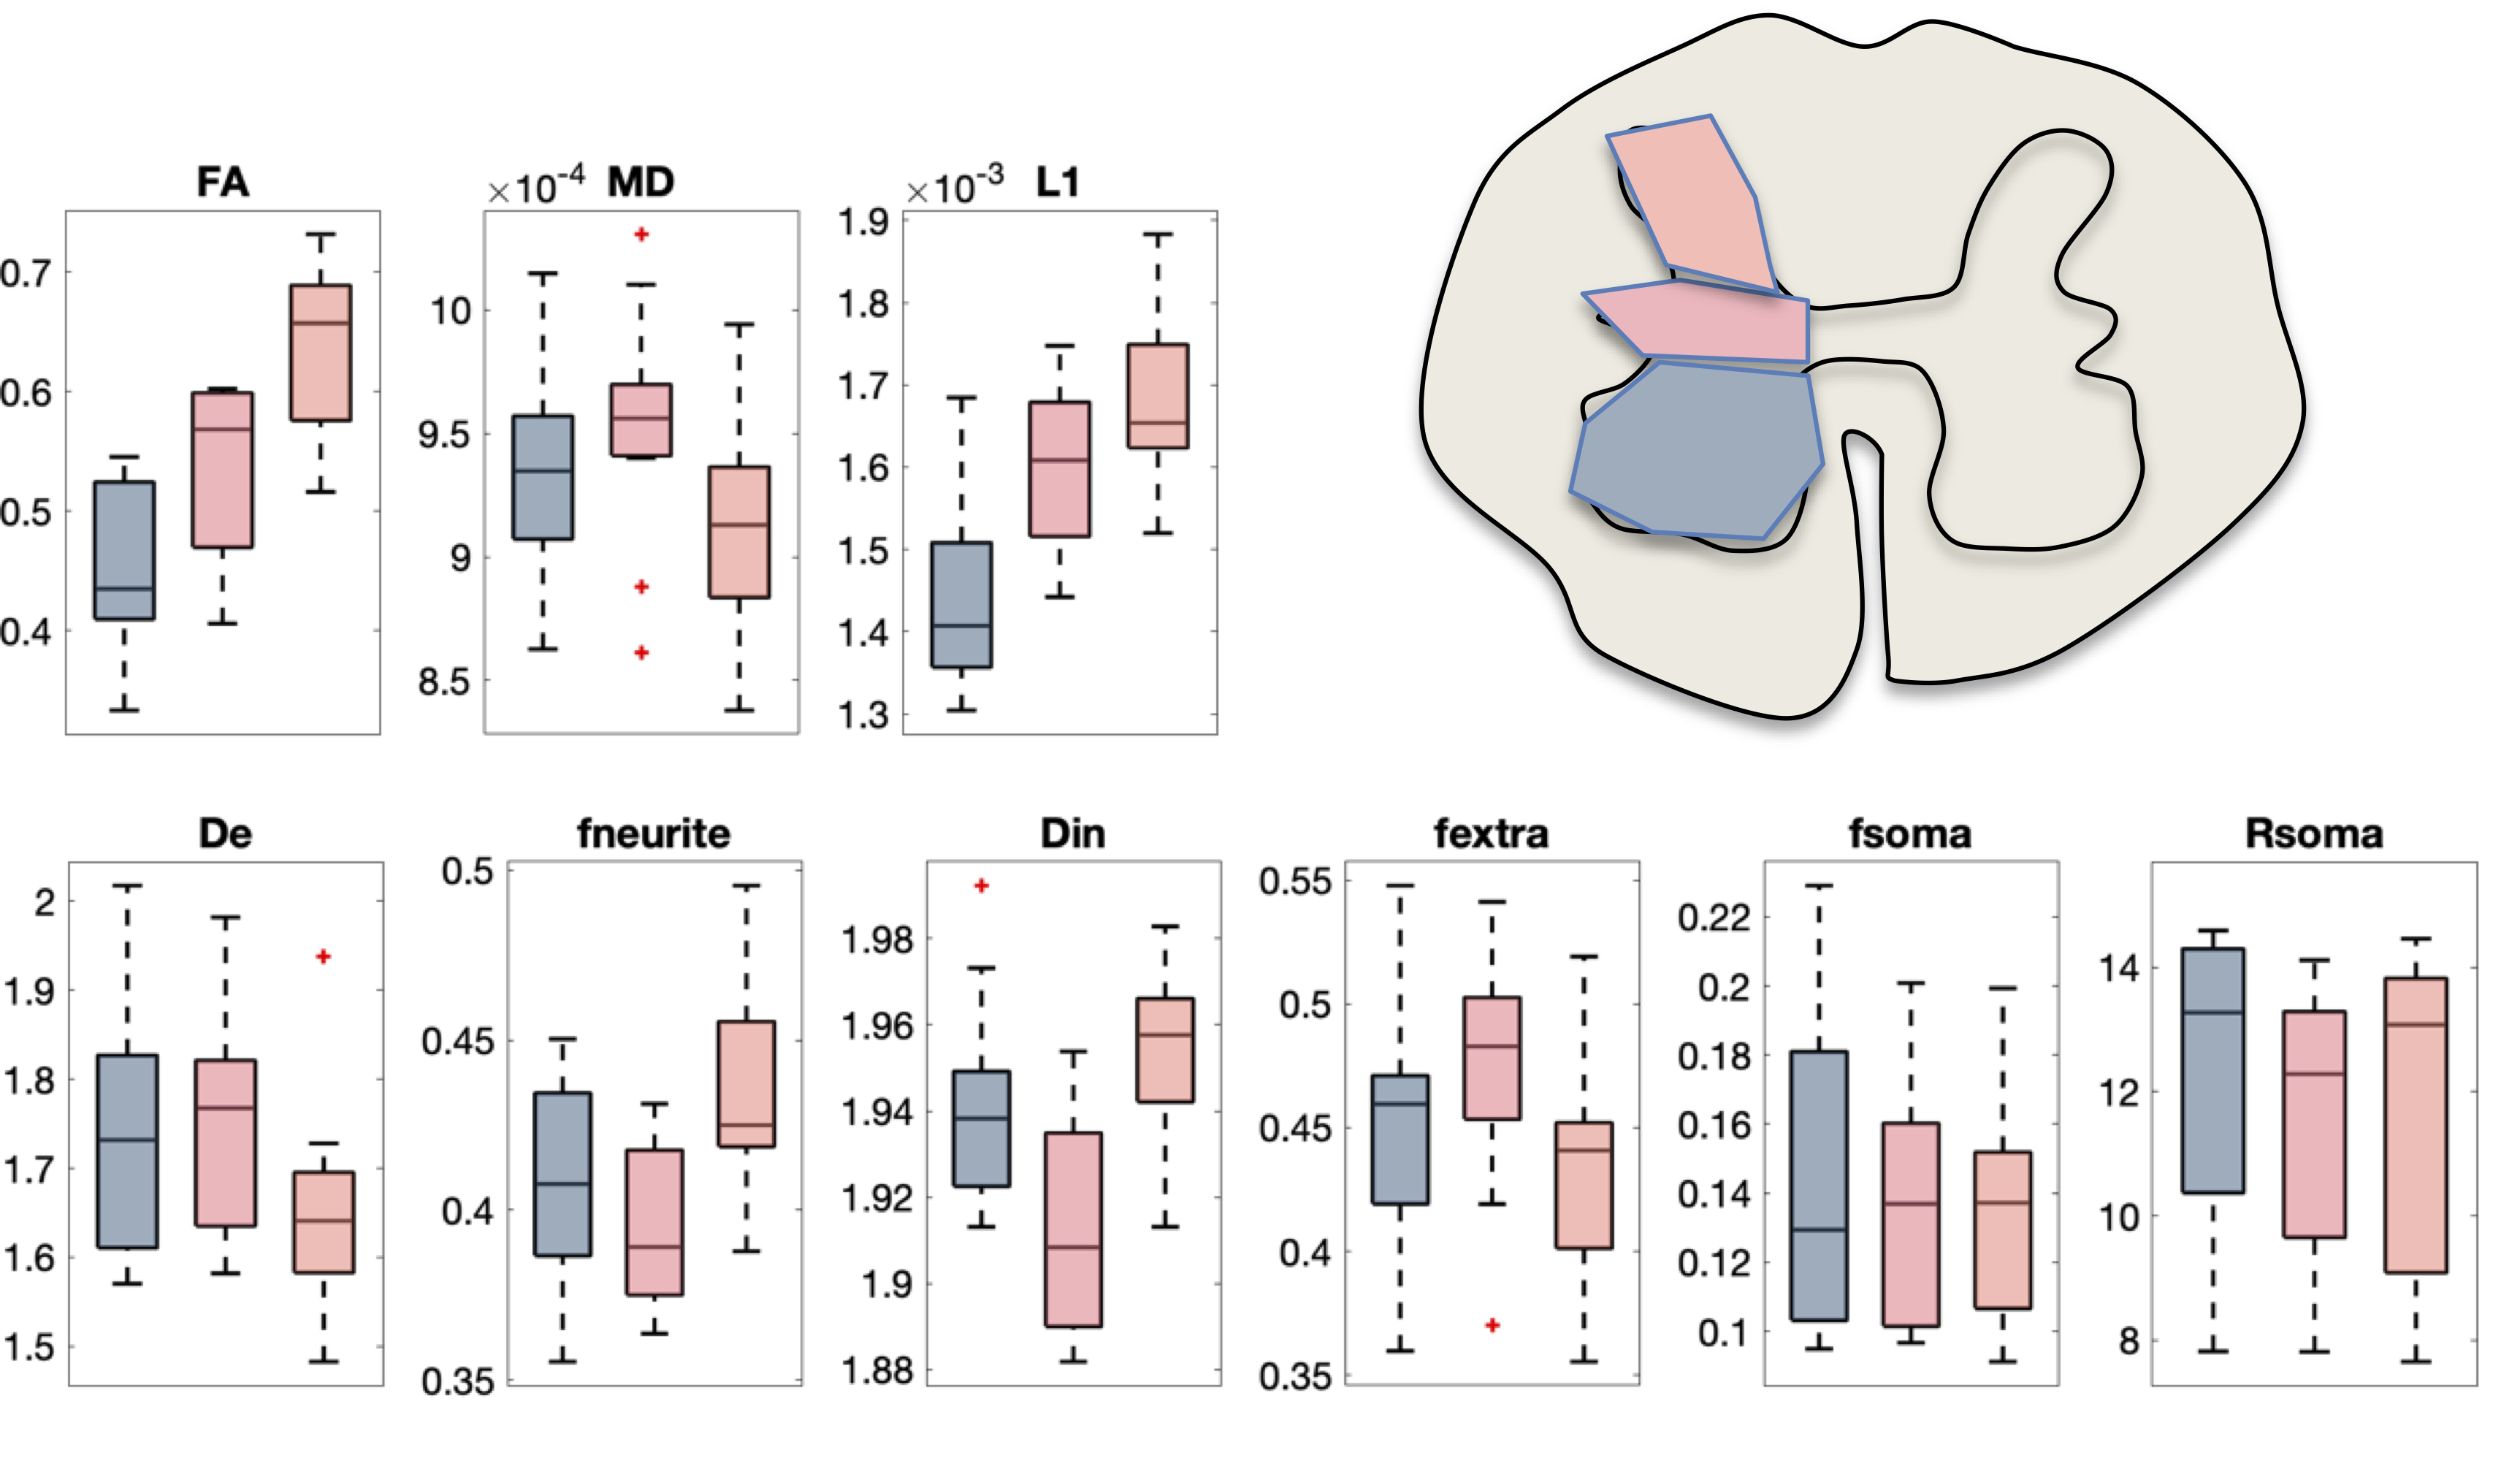
Variation across the gray matter regions are visible in Figure 5. Notably, the dorsal horn has lowest De and fextra, and greatest fneurite and Din.
Discussion
We implemented a clinically feasible diffusion protocol for the in vivo human SC that enables modeling of the white and gray matter tissue microstructure with the SANDI model. Changes in acquisition (removing cardiac triggering, reducing number of directions), and advanced preprocessing (denoising, motion correction, and further denoising) resulted in relatively high-fidelity images that facilitated SANDI contrast with visible white and gray matter differences and quantitative differences across the gray matter tissues. For example, differences in locations of sensory synapses (dorsal horn) and motor cell bodies (ventral horn), along with branching nerve roots are expected to result in different microstructural environments across these structures. Future work should investigate the reproducibility of these metrics, along cord variation, alterations in SC disease and pathology, and impact of inter-compartmental exchange due to long diffusion times.Acknowledgements
NIH K01EB030039 (KO), K01EB032898 (KS), 5R01NS109114 (SS), 5R01NS117816 (SS) and 5R01NS104149 (SS), R01EB017230 (BL).References
1. Palombo, M., et al., SANDI: A compartment-based model for non-invasive apparent soma and neurite imaging by diffusion MRI. Neuroimage, 2020. 215: p. 116835.
2. Schilling, K.G., et al. Investigating multi-compartment diffusion MRI models in the cervical spinal cord ofmultiple sclerosis patients. in International Society of Magnetic Resonance in Medicine. 2021.
3. Cohen-Adad, J., et al., Generic acquisition protocol for quantitative MRI of the spinal cord. Nat Protoc, 2021.
4. Schiavi, S., et al., Mapping tissue microstructure across the human brain on a clinical scanner with soma and neurite density image metrics. Hum Brain Mapp, 2023. 44(13): p. 4792-4811.
5. Kurt, G.S., et al., Influence of preprocessing, distortion correction and cardiac triggering on the quality of diffusion MR images of spinal cord. bioRxiv, 2023: p. 2023.09.26.559530.
6. Schilling, K.G., et al., Minimal number of sampling directions for robust measures of the spherical mean diffusion weighted signal: Effects of sampling directions, b-value, signal-to-noise ratio, hardware, and fitting strategy. Magn Reson Imaging, 2022. 94: p. 25-35.
7. Ma, X., K. Ugurbil, and X. Wu, Denoise magnitude diffusion magnetic resonance images via variance-stabilizing transformation and optimal singular-value manipulation. Neuroimage, 2020. 215: p. 116852.
8. De Leener, B., et al., SCT: Spinal Cord Toolbox, an open-source software for processing spinal cord MRI data. Neuroimage, 2017. 145(Pt A): p. 24-43.
9. Schilling, K.G., et al., Denoising of diffusion MRI in the cervical spinal cord - effects of denoising strategy and acquisition on intra-cord contrast, signal modeling, and feature conspicuity. Neuroimage, 2023. 266: p. 119826.
10. Fadnavis, S., J. Batson, and E. Garyfallidis, Patch2Self: denoising diffusion MRI with self-supervised learning. arXiv preprint arXiv:2011.01355, 2020.
11. Pizzolato, M., E.J. Canales-Rodriguez, M. Andersson, and T.B. Dyrby, Axial and radial axonal diffusivities and radii from single encoding strongly diffusion-weighted MRI. Med Image Anal, 2023. 86: p. 102767.
12. De Leener, B., et al., PAM50: Unbiased multimodal template of the brainstem and spinal cord aligned with the ICBM152 space. Neuroimage, 2018. 165: p. 170-179.
Figures