0934
Investigation of the time- and frequency-dependence of diffusion kurtosis in the human brain with pulsed and oscillating gradient experiments1Institute for Biomedical Engineering, ETH Zurich and University of Zurich, Zurich, Switzerland
Synopsis
Keywords: DWI/DTI/DKI, Microstructure, Kurtosis, OGSE, PGSE, Frequency dependence, Time dependence, Human brain
Motivation: Investigation of the time- and frequency-dependence of diffusion kurtosis, a valuable probe of microstructure and exchange, is becoming feasible in humans due to advances of gradient hardware.
Goal(s): To provide more data regarding time- and frequency-dependent diffusion kurtosis in the human brain.
Approach: Diffusion MRI with pulsed and oscillating gradients (PGSE/OGSE) at different but partially overlapping diffusion times using a head gradient insert and spiral readouts.
Results: Biphasic kurtosis behavior (i.e., increase with time in the short-time range and decrease with time in the long-time range covered by OGSE/PGSE, respectively) was observed, with an explainable mismatch between both sequences in the overlapping range.
Impact: Studying the time- and frequency-dependence of diffusion kurtosis using both PGSE and OGSE experiments over a range of diffusion times and length scales can provide valuable information about brain tissue complexity, heterogeneity, and inter-compartmental water exchange.
Introduction
Diffusion kurtosis imaging (DKI) assesses the non-Gaussianity of the diffusive displacements of water molecules, providing valuable microstructural information about biological tissues complementary to conventional DWI.1 Such experiments typically employ the pulsed gradient spin-echo (PGSE) sequence,2 but the oscillating gradient spin-echo (OGSE) sequence,3 in which the diffusion-sensitizing gradient waveforms sinusoidally oscillate, can be used to probe shorter effective diffusion times (Δeff) than are achievable in PGSE experiments.By using both diffusion encoding methods, the frequency dependence or, correspondingly, the Δeff dependence of diffusion kurtosis, can be studied, aiding our understanding of tissue complexity and processes like inter-compartmental water exchange.4,5 Such dependency has been extensively studied using preclinical scanners.4,6,7 However, due to gradient demands, this relationship has only been explored by few studies in the human brain.5,8,9 In this work, we investigate the frequency and diffusion time dependence of axial, mean, and radial kurtosis (AK, MK, and RK, respectively) in the in vivo human brain using a high-performance gradient insert10 with OGSE and PGSE sequences over an extended yet overlapping range of frequencies and Δeff.
Methods
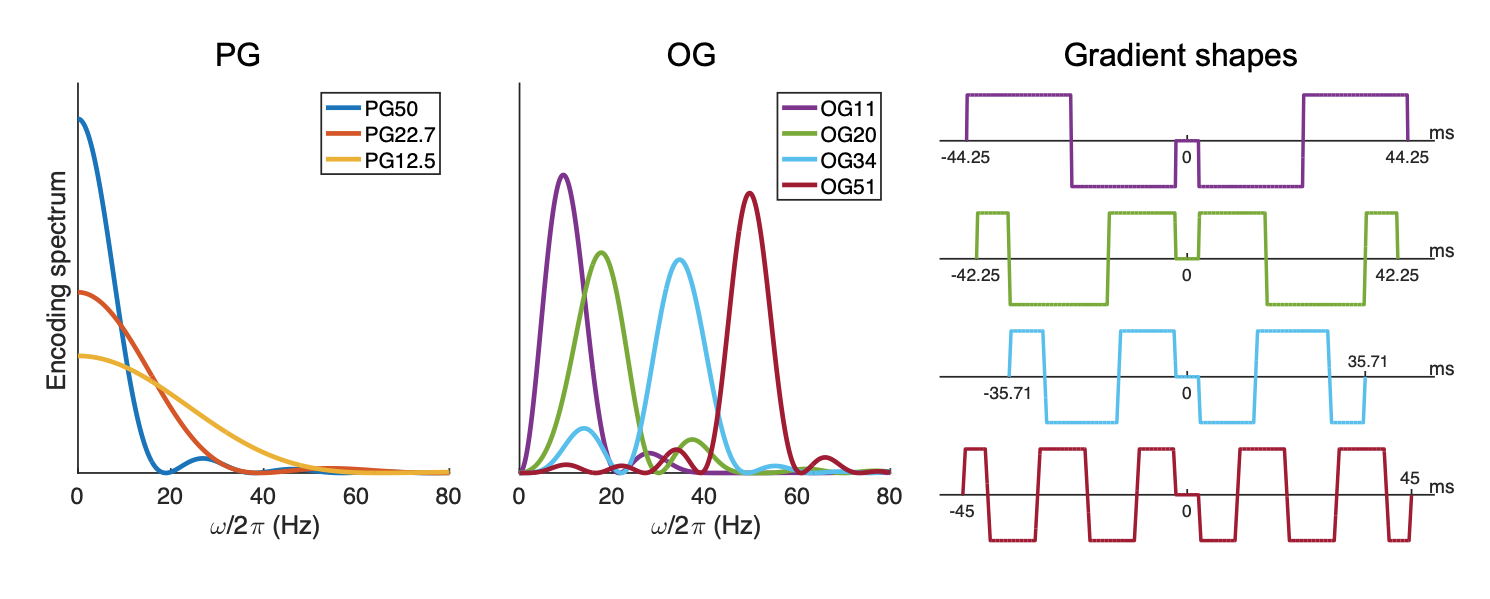
Scanning was performed using a Philips 3T Achieva system (Philips Healthcare, Best, the Netherlands) equipped with a high-performance gradient insert coil (Gmax = 200 mT/m)10 on two healthy volunteers. Each volunteer was scanned using four OGSE and three PGSE protocols with spiral readouts. Each protocol consisted of a three-shell acquisition with b-values of 500, 1000 and 2000 s/mm2 and 15, 15, and 32 diffusion directions, respectively. The centroid frequencies of the OGSE waveforms11,12 were 11, 20, 34, and 51 Hz (Figure 1). The Δeff of the PGSE waveforms were 12.5, 22.7 and 50 ms, calculated using $$$\Delta_{eff}=\Delta-\frac{\delta}{3}$$$; the 22.7 and 12.5 ms PGSE measurements correspond in terms of Δeff to OGSE at 11 and 20 Hz,13 respectively. Other imaging parameters were: 20 slices, spatial resolution = 2×2×3 mm3, interslice gap = 2 mm, TE/TR = 97/6000 ms, two and four b = 0 acquisitions for each protocol for the two subjects.The raw reconstructed images were processed using the DESIGNER pipeline,14 including: denoising,15 unringing,16 rigid body registration, and Rician bias correction.17 AK, MK, and RK were computed from fitted diffusion kurtosis tensors.18 Global white and gray matter masks were generated using FSL’s FAST.19 White and gray matter ROIs were segmented using the JHU DTI-based white-matter atlas20 and the Harvard-Oxford cortical and subcortical structural atlas.21
Results
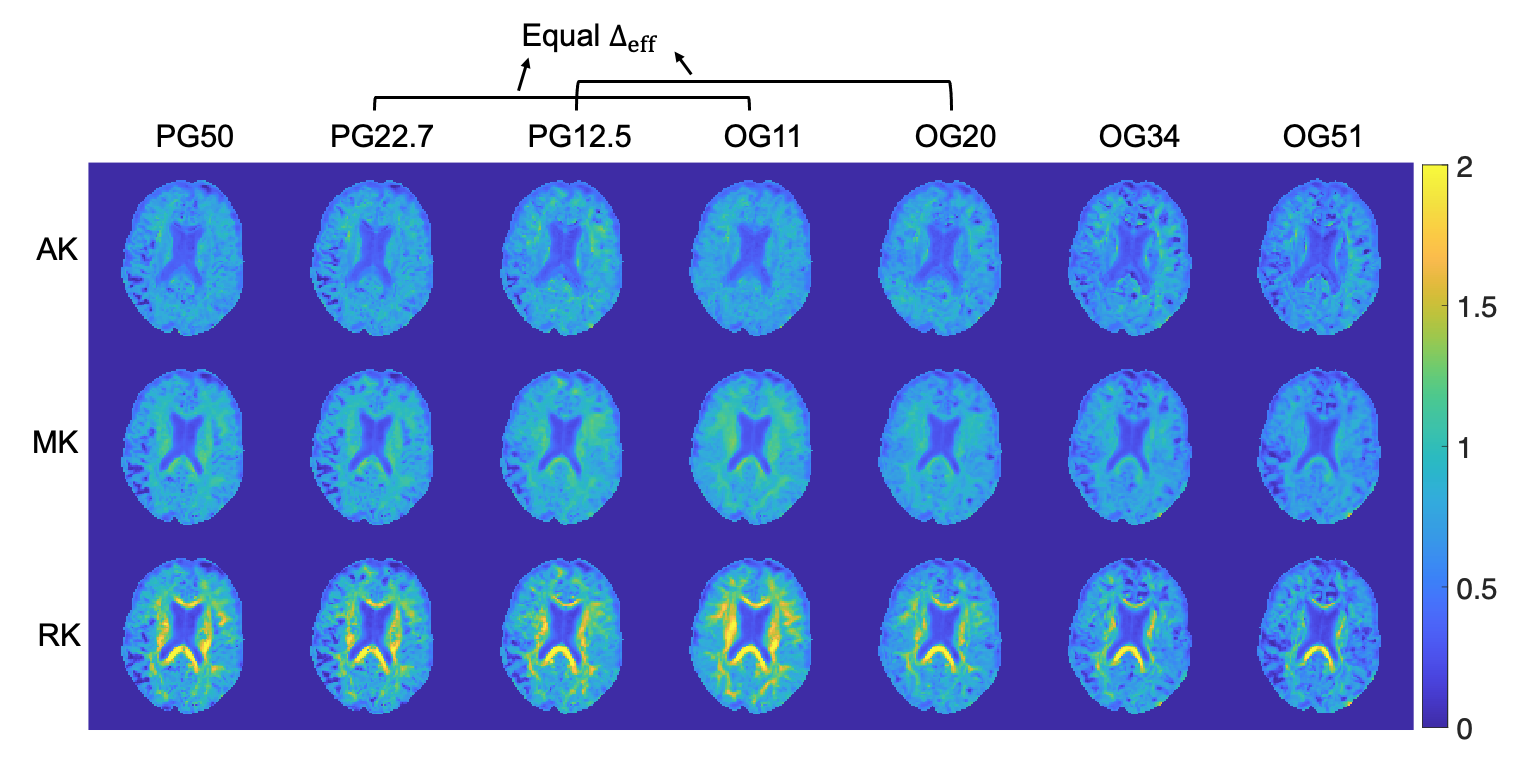
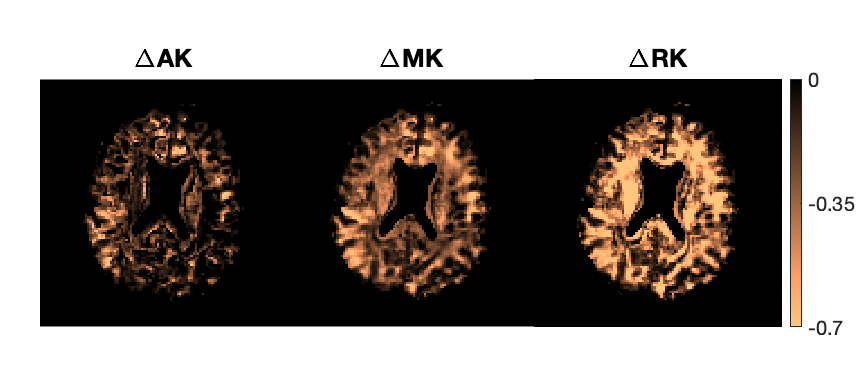
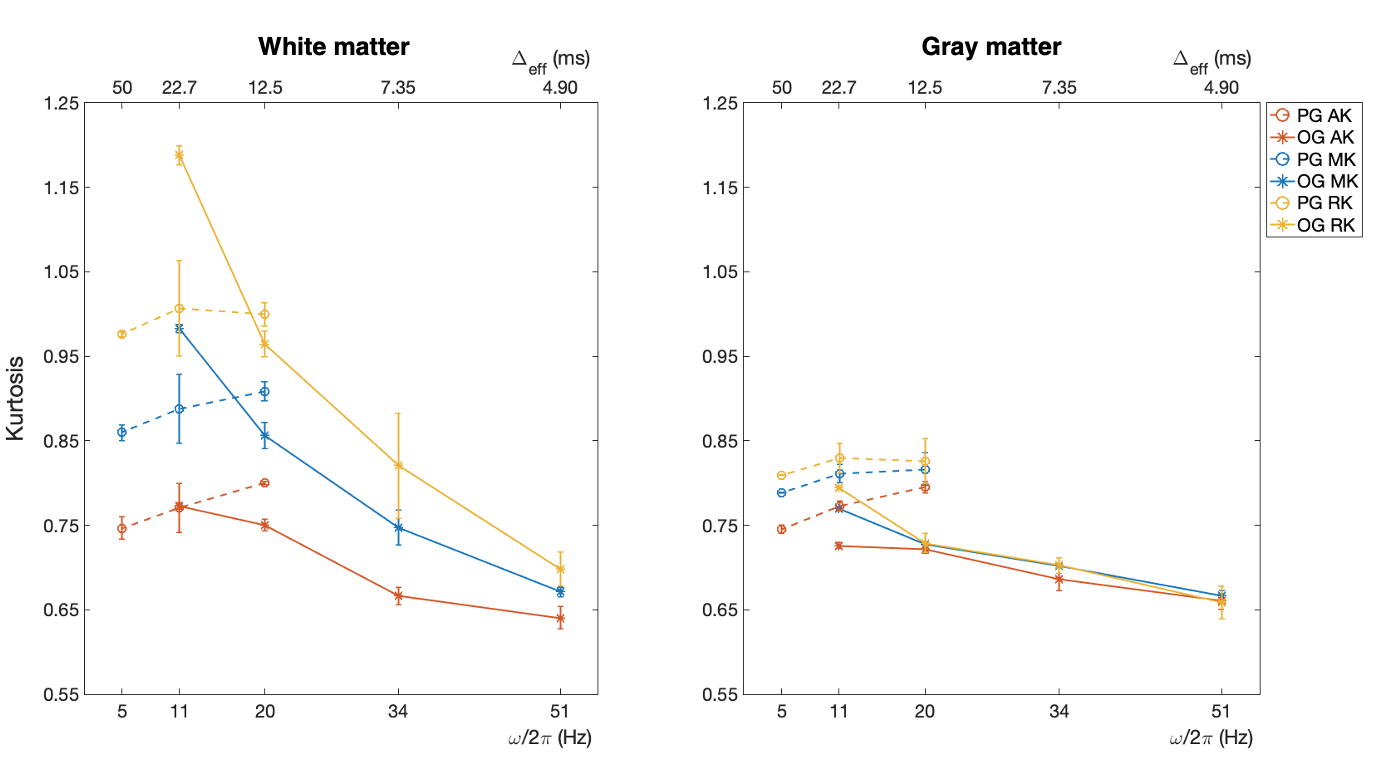
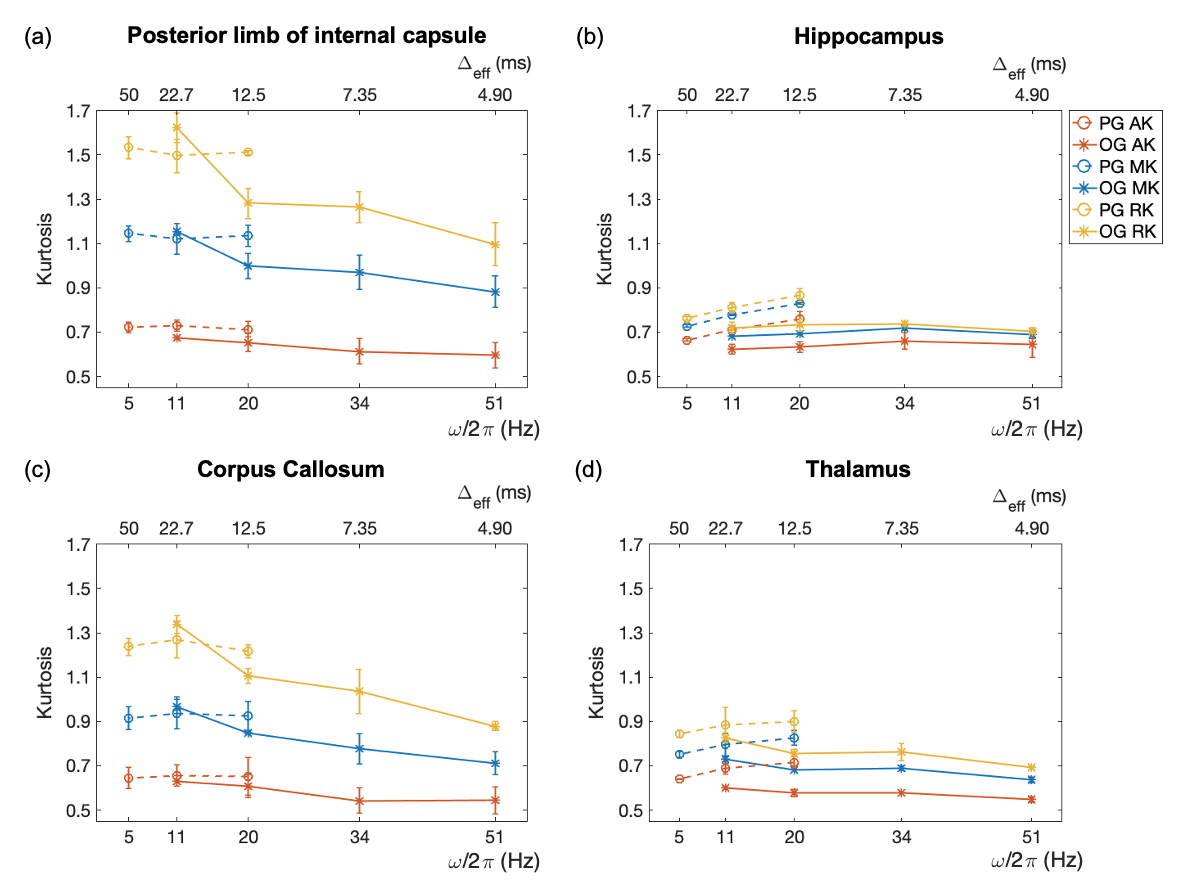
Figure 2 shows AK, MK, and RK maps for a representative slice from the seven protocols. Figure 3 displays kurtosis difference maps between the OG51 and OG11 protocols.Figure 4 plots kurtosis values versus frequency and Δeff for global white and gray matter. Figure 5 plots the same variables for two white matter ROIs (posterior limb of internal capsule and corpus callosum) and two gray matter ROIs (hippocampus and thalamus).
Discussion and Conclusion
White matter shows a significantly higher RK than AK across all probed diffusion times (Figures 2 and 4), indicating anisotropic tissue structure. For gray matter, the smaller difference between RK and AK indicates less anisotropic tissue than white matter. For both white and gray matter, kurtosis decreases with increasing OGSE frequency from 11 Hz to 51 Hz, implying fewer interactions of water molecules with restrictions and more Gaussian diffusive displacements. Additionally, AK displays the steepest decrease, whereas RK displays the shallowest decrease. Notably, the contributions to non-zero kurtosis at 51 Hz include the residual interactions at short diffusion times and the existence of multiple compartments within each imaging voxel.In Figures 4 and 5, discrepancies are present in measured kurtosis values at the same Δeff using PGSE and OGSE sequences. One explanation is the inadequacy in the $$$\Delta_{eff}=\frac{1}{4f}$$$ convention.13 In the presence of exchange, differences in gradient shapes will also cause differences in kurtosis estimations at a given Δeff.4,22
In Figure 5, the kurtosis values of the posterior limb of the internal capsule and corpus callosum measured using PGSE sequences are only weakly time-dependent, suggesting rather slow inter-compartmental water exchange and a small effect of coarse graining on the tissue structure. However, for the hippocampus and thalamus, which exhibit faster exchange,23,24 biphasic kurtosis behavior can be clearly observed. Such behavior also exists in global white and gray matter (Figure 4); similar findings were reported only in rat brains.4 The initial increase in kurtosis with decreasing Δeff demonstrates the homogenizing effect of both exchange and coarse graining of disordered structure at long diffusion times.5 As Δeff further decreases below the exchange time, structural disorder determines the behavior of kurtosis, which starts to decrease because the interactions of water molecules with restrictions become more scarce.
Acknowledgements
No acknowledgement found.References
1. Jensen JH, Helpern JA, Ramani A, Lu H, Kaczynski K. Diffusional kurtosis imaging: the quantification of non-gaussian water diffusion by means of magnetic resonance imaging. Magn Reson Med. 2005;53(6):1432-1440.
2. Stejskal EO, Tanner JE. Spin Diffusion Measurements: Spin Echoes in the Presence of a Time-Dependent Field Gradient. J Chem Phys. 1965;42(1):288-292.
3. Schachter M, Does MD, Anderson AW, Gore JC. Measurements of restricted diffusion using an oscillating gradient spin-echo sequence. J Magn Reson. 2000;147(2):232-237.
4. Portnoy S, Flint JJ, Blackband SJ, Stanisz GJ. Oscillating and Pulsed Gradient Diffusion Magnetic Resonance Microscopy Over an Extended b-Value Range: Implications for the Characterization of Tissue Microstructure. Magn Reson Med. 2013;69(4):1131-1145.
5. Lee HH, Papaioannou A, Novikov DS, Fieremans E. In vivo observation and biophysical interpretation of time-dependent diffusion in human cortical gray matter. Neuroimage. 2020;222:117054.
6. Pyatigorskaya N, Le Bihan D, Reynaud O, Ciobanu L. Relationship between the Diffusion Time and the Diffusion MRI Signal Observed at 17.2 Tesla in the Healthy Rat Brain Cortex. Magn Reson Med. 2014;72(2):492-500.
7. Aggarwal M, Smith MD, Calabresi PA. Diffusion-time dependence of diffusional kurtosis in the mouse brain. Magn Reson Med. 2020;84(3):1564-1578.
8. Borsos KB, Tse DHY, Dubovan PI, Baron CA. Tuned bipolar oscillating gradients for mapping frequency dispersion of diffusion kurtosis in the human brain. Magn Reson Med. 2023;89(2):756-766.
9. Dai E, Zhu A, Yang GK, et al. Frequency-dependent diffusion kurtosis imaging in the human brain using an oscillating gradient spin echo sequence and a high-performance head-only gradient. Neuroimage. 2023:120328.
10. Weiger M, Overweg J, Rosler MB, et al. A high-performance gradient insert for rapid and short-T-2 imaging at full duty cycle. Magn Reson Med. 2018;79(6):3256-3266.
11. Hennel F, Michael ES, Pruessmann KP. Improved gradient waveforms for oscillating gradient spin-echo (OGSE) diffusion tensor imaging. NMR Biomed. 2021;34(2):e4434.
12. Michael ES, Hennel F, Pruessmann KP. Evaluating diffusion dispersion across an extended range of b-values and frequencies: Exploiting gap-filled OGSE shapes, strong gradients, and spiral readouts. Magn Reson Med. 2022;87(6):2710-2723.
13. Does MD, Parsons EC, Gore JC. Oscillating gradient measurements of water diffusion in normal and globally ischemic rat brain. Magn Reson Med. 2003;49(2):206-215.
14. Ades-Aron B, Veraart J, Kochunov P, et al. Evaluation of the accuracy and precision of the diffusion parameter EStImation with Gibbs and NoisE removal pipeline. Neuroimage. 2018;183:532-543.
15. Veraart J, Novikov DS, Christiaens D, Ades-Aron B, Sijbers J, Fieremans E. Denoising of diffusion MRI using random matrix theory. Neuroimage. 2016;142:384-396.
16. Kellner E, Dhital B, Kiselev VG, Reisert M. Gibbs-Ringing Artifact Removal Based on Local Subvoxel-Shifts. Magn Reson Med. 2016;76(5):1574-1581.
17. Koay CG, Basser PJ. Analytically exact correction scheme for signal extraction from noisy magnitude MR signals. J Magn Reson. 2006;179(2):317-322.
18. Veraart J, Sijbers J, Sunaert S, Leemans A, Jeurissen B. Weighted linear least squares estimation of diffusion MRI parameters: Strengths, limitations, and pitfalls. Neuroimage. 2013;81:335-346.
19. Zhang YY, Brady M, Smith S. Segmentation of brain MR images through a hidden Markov random field model and the expectation-maximization algorithm. IEEE Trans Med Imaging. 2001;20(1):45-57.
20. Mori S, Wakana S, Van Zijl PCM, Nagae-Poetscher LM. MRI atlas of human white matter. Elsevier; 2005.
21. Desikan RS, Ségonne F, Fischl B, et al. An automated labeling system for subdividing the human cerebral cortex on MRI scans into gyral based regions of interest. Neuroimage. 2006;31(3):968-980.
22. Ning LP, Nilsson M, Lasic S, Westin CF, Rathi Y. Cumulant expansions for measuring water exchange using diffusion MRI. J Chem Phys. 2018;148(7).
23. Chakwizira A, Zhu A, Foo T, Westin CF, Szczepankiewicz F, Nilsson M. Diffusion MRI with free gradient waveforms on a high-performance gradient system: Probing restriction and exchange in the human brain. Neuroimage. 2023;283:120409.
24. Jelescu IO, de Skowronski A, Geffroy F, Palombo M, Novikov DS. Neurite Exchange Imaging (NEXI): A minimal model of diffusion in gray matter with inter-compartment water exchange. Neuroimage. 2022;256:119277.
25. Gamper U, Boesiger P, Kozerke S. Diffusion imaging of the in vivo heart using spin echoes-considerations on bulk motion sensitivity. Magn Reson Med. 2007;57(2):331-337.
Figures