0933
Towards quantifying Gray Matter “micro-connectivity”: the measurable impact of dendritic spines on metabolite diffusion1Cardiff University Brain Research Imaging Centre (CUBRIC), School of Psychology, Cardiff University, Cardiff, United Kingdom, 2School of Computer Science and Informatics, Cardiff University, Cardiff, United Kingdom
Synopsis
Keywords: Microstructure, Microstructure, brain, diffusion, microstructure, metabolites, DW-MRS, spines, gray matter, simulation
Motivation: Dendritic spines are fine microstructures increase the complexity of brain cells. Spines are characteristic morphological feature of neurons and their density can change with pathological conditions.
Goal(s): Quantification of dendritic spines in gray matter in human brain using diffusion-weighted MR spectroscopy
Approach: Using Monte-Carlo diffusion simulations for metabolites, to investigate how a dMRS signal is sensitive to the dendritic spines.
Results: Our findings suggests potential biomarkers for characterizing dendritic spines in human brain gray matter using diffusion-weighted MR spectroscopy
Impact: This work establishes a benchmark for spine sensitivity and quantification. Also it offers potential dMRS acquisition parameters for spine detection in human brain.
Introduction
The brain gray matter (GM) exhibits highly heterogeneous and complex microstructures that can be probed by diffusion-weighted MRS (dMRS) in-vivo1–4. Several works have already investigated the effect of cell body size/density5,6; cell processes branching6–8, undulation9, beading10 and orientation dispersion7,11 on dMRS measurements.However, only a few works12,13 have investigated the potential effects of secondary structures like dendritic spines. Dendritic spines play a crucial role in synapse development and plasticity in both healthy and pathological conditions14–16. But it is still unclear what the impact of dendritic spine is on metabolites dMRS signal and whether we can measure it in typical human acquisitions.
Here we aim to answer these questions by investigating the impact of dendritic spine density on dMRS measurements using numerical simulations.
Methods
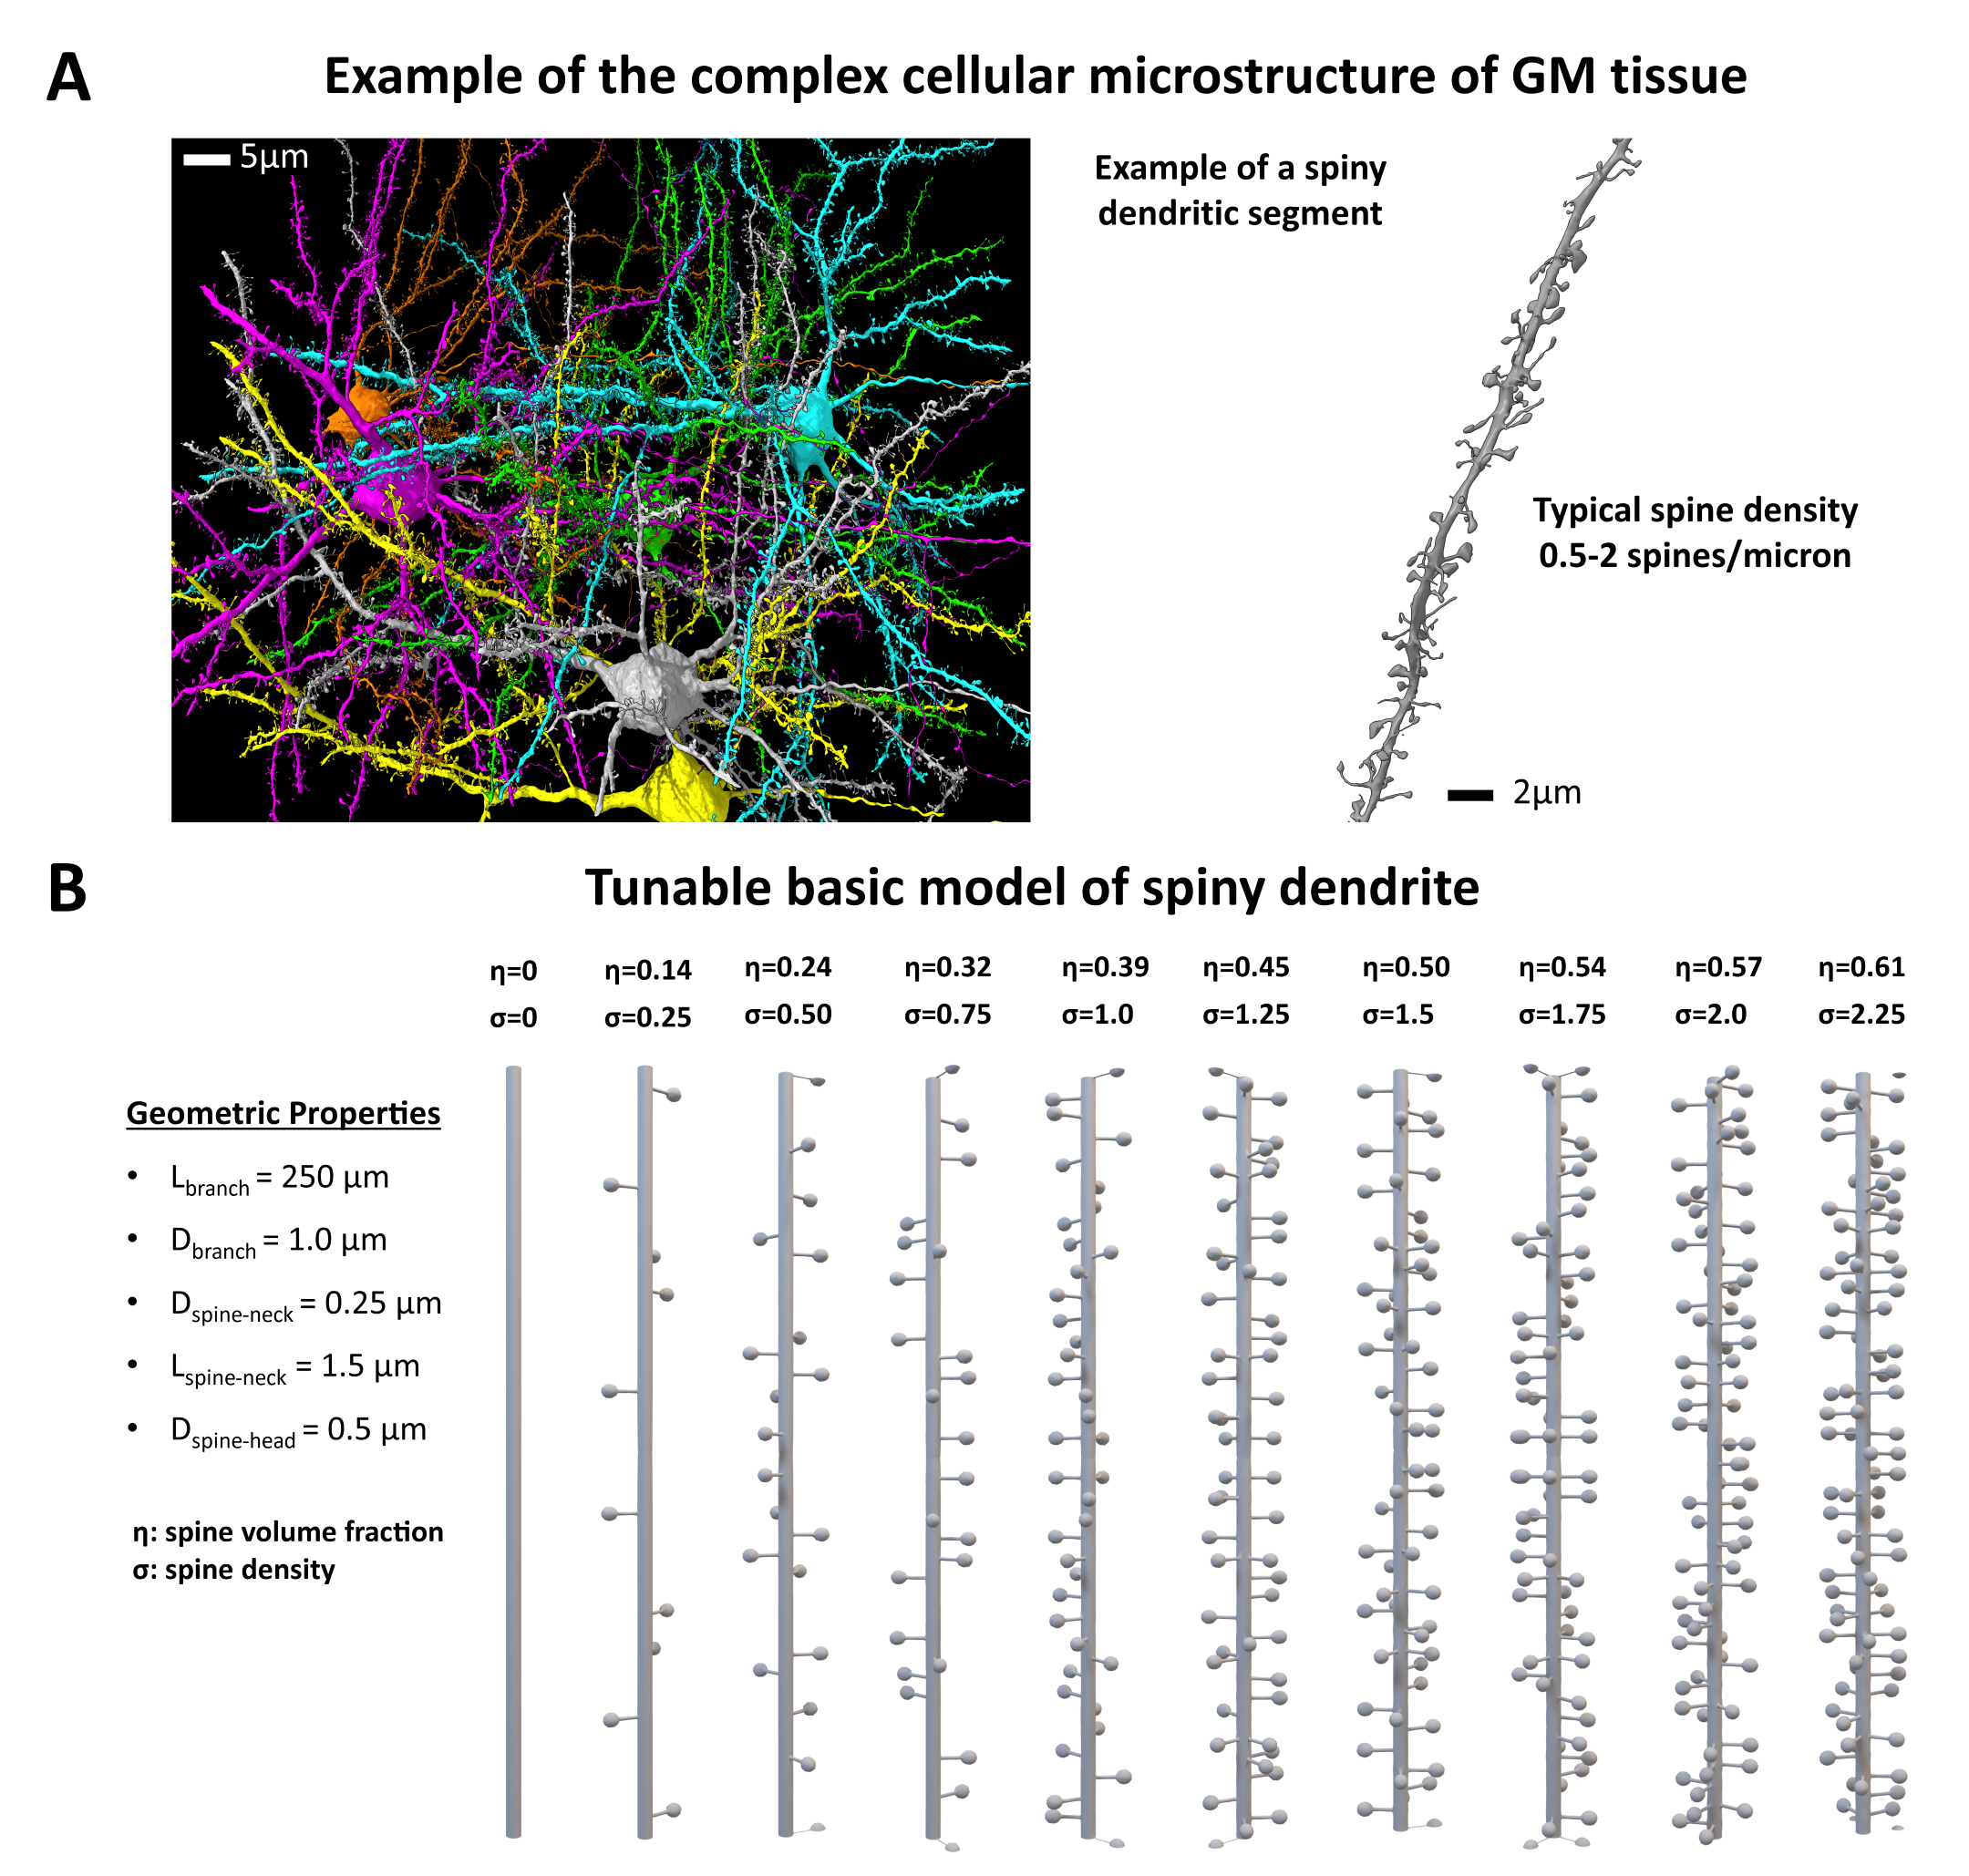
Spiny Dendritic MeshesSkeletons for ten spiny branches were built on MATLAB R2022a17 (MathWorks) involving functions from the Trees-Toolbox18 and then surface meshed using Python Blender API v2.7919. Spine density $$$σ$$$ was varied from 0 to 2.25μm-1. The branch length was 250μm with a diameter of 1μm. The spines having diameter of 1μm, were connected to the main branch with a cylindrical neck having a diameter of 0.25μm and a length of 1.5μm. Notably, any of these features can be changed arbitrarily, but here we focused on spine density and purposely varied only that. Moreover, to investigate the impact of undulation and beading in addition to spine, we also added undulation and beading with period [0-8] and amplitude [0-3]μm, respectively.
Diffusion Simulations & Data Analysis
All diffusion Monte-Carlo simulations were performed using DisimPy20 with periodic boundary conditions. The number of spins 106 and time steps 2000 were determined by the Monte-Carlo21,22; intra-branch diffusivity was 0.35μm2/ms (typical value for N-acetyl-aspartate, NAA23).
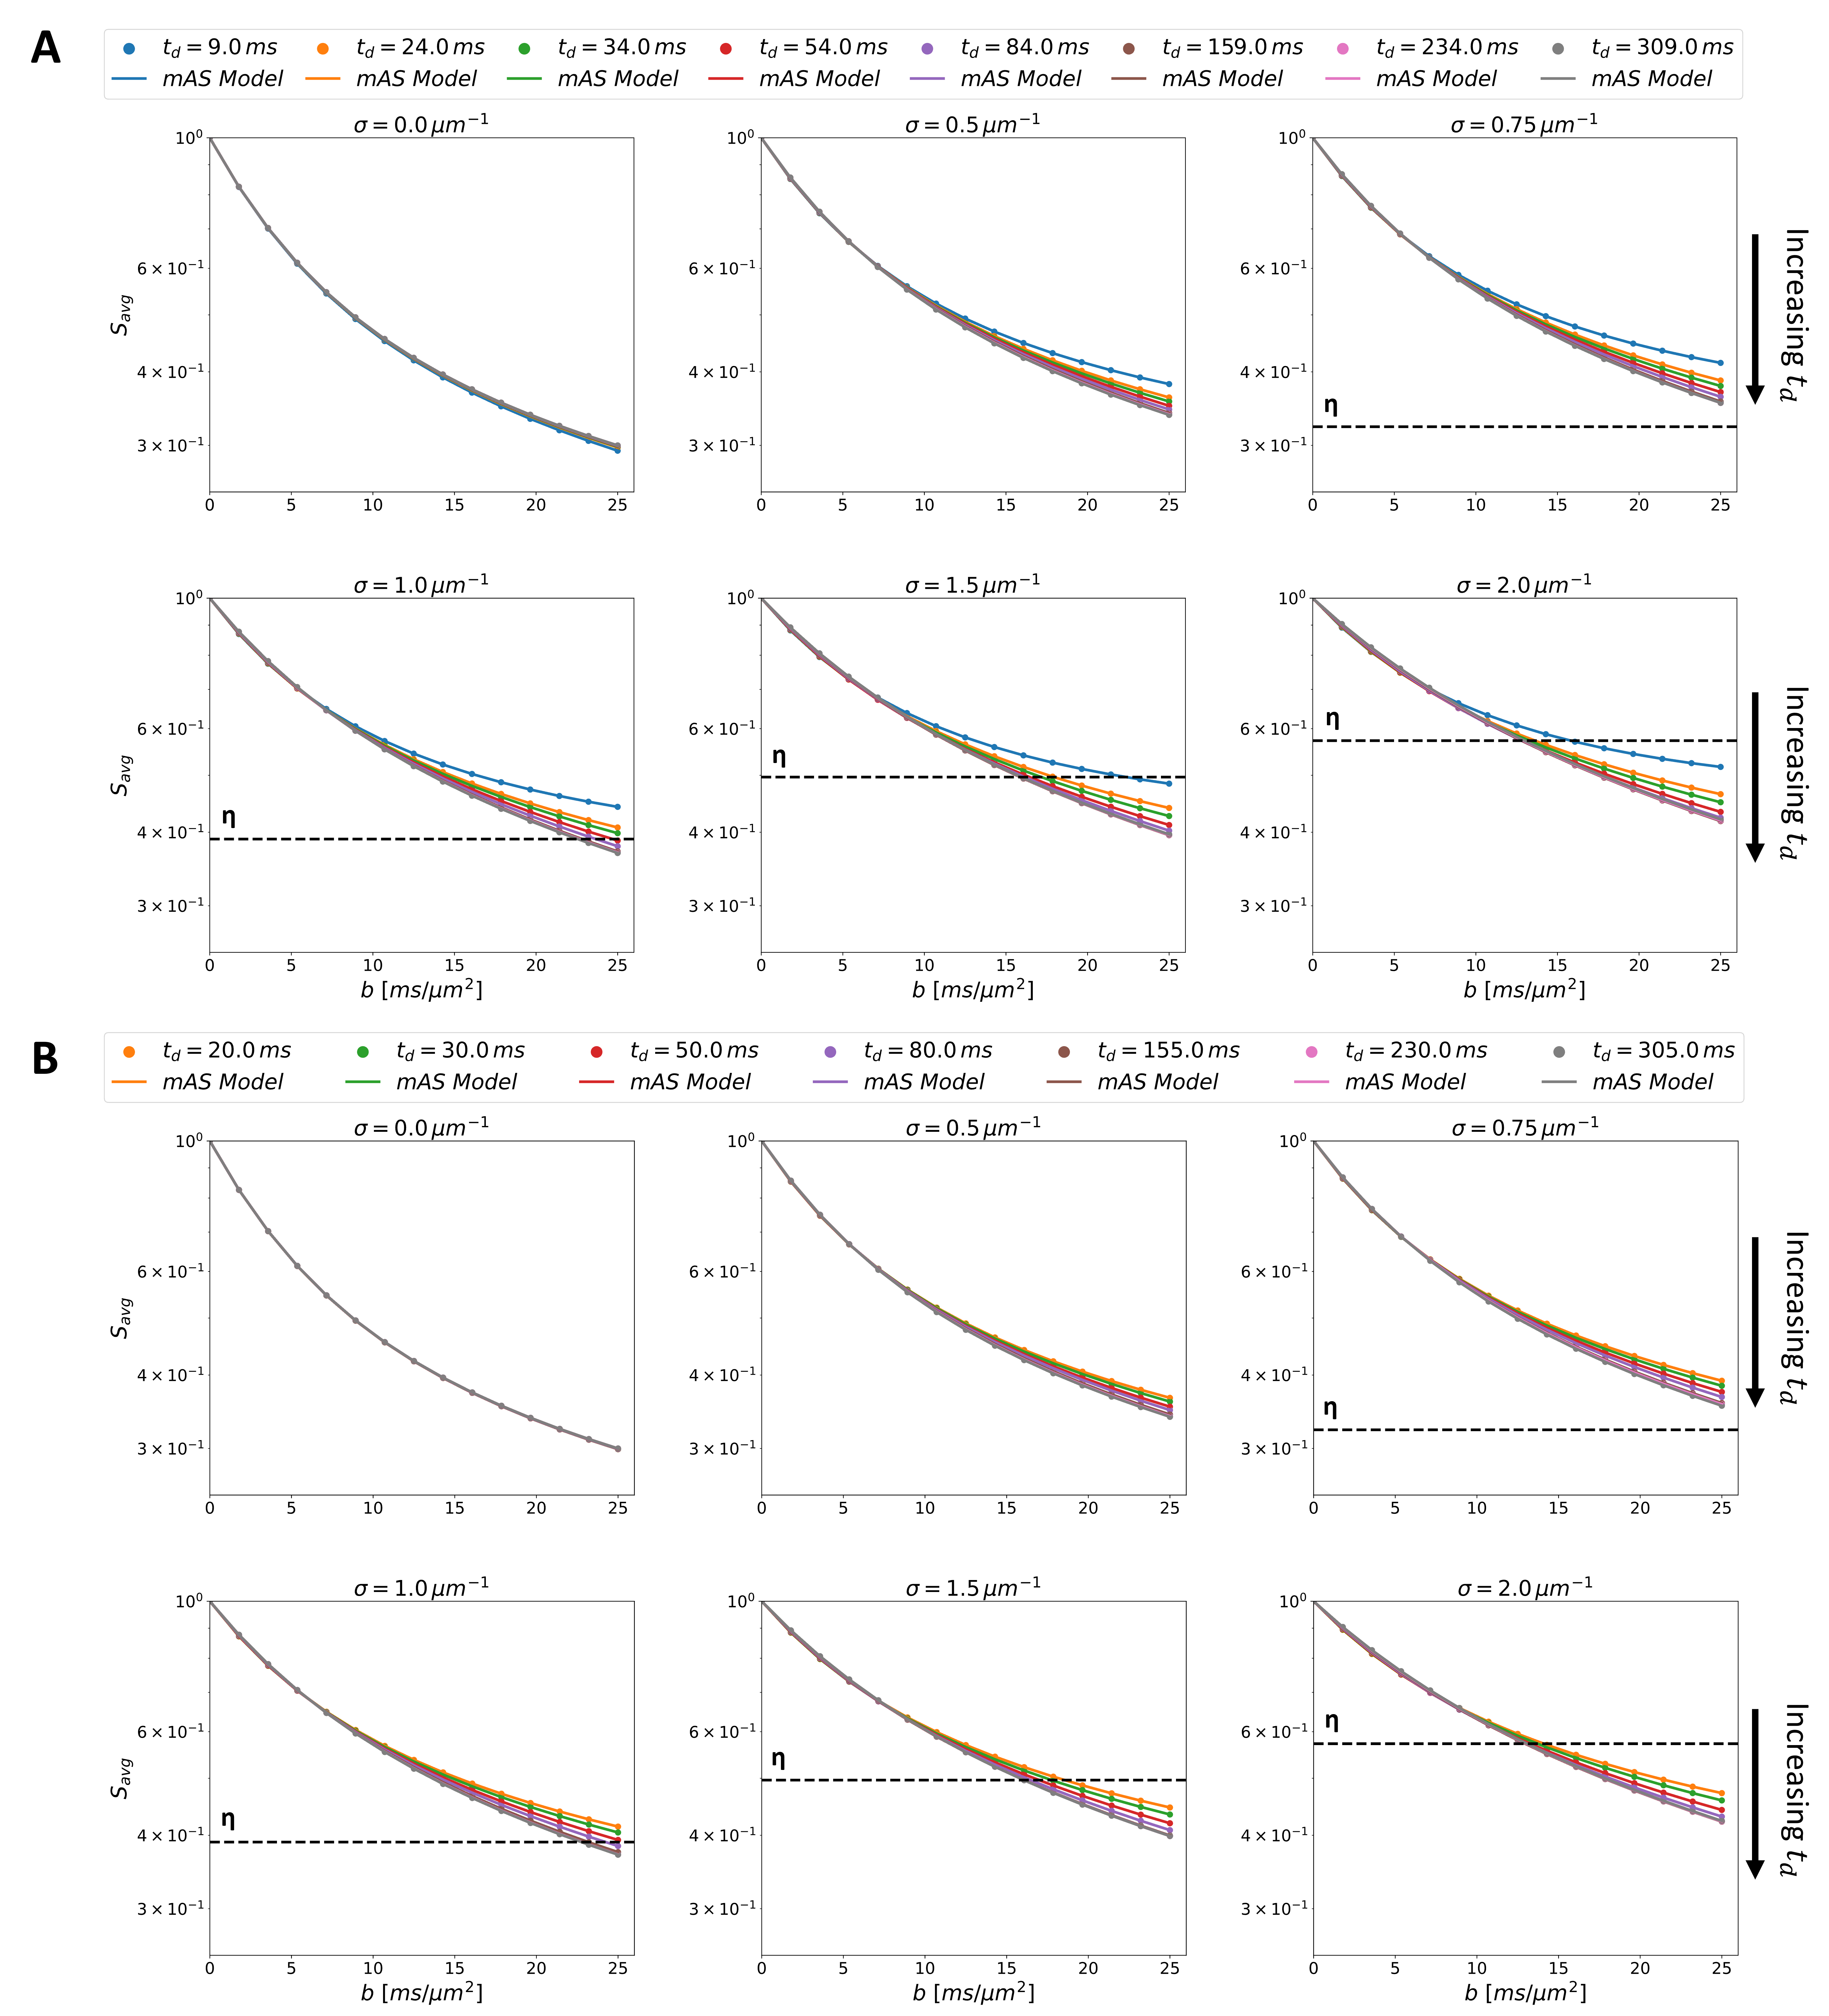
We simulated 15 different pulsed gradient schemes with combinations of eight gradients separations($$$\Delta$$$= [10, 25, 35, 55, 85, 160, 235, 310] ms), two gradients ($$$\delta$$$= [3, 15] ms), 128 directions and b-values up to 25ms/μm2.
To characterize the hindering/restricting effect of spines on metabolites diffusion, we used a modified astro-sticks model (mAS)2,24,25. This model is based on randomly-oriented sticks with effective intra-stick axial diffusivity $$$D_{eff}(D_{intra},K_{intra},b,\theta)=D_{intra}(1-K_{intra}D_{intra}b\cos^2\theta)$$$, where $$$\theta$$$ is the angle between the branch direction and the diffusion gradient direction, $$$D_{intra}$$$ is the metabolite intra-stick apparent axial diffusivity, and $$$K_{intra} is the metabolite intra-stick apparent axial kurtosis, accommodating non-Gaussian diffusion due to spines hindering/restriction24,25. The numerical integration yields the corresponding powder-averaged signal13,26,27:
$$S/S_0 = \int^1_0e^{bD_{eff}\cos^2\theta}d(\cos\theta)$$
Results
Exemplary pyramidal cells from adult rat brain cortex28 are illustrated in Fig.1A alongside a typical spiny dendritic segment. For comparison, our spiny dendrite substrates are shown in Fig.1B, including the geometric properties.Fig.2 depicts the simulated diffusion signals for all diffusion times, $$$t_d$$$, with both $$$\delta$$$ conditions. The mAS model fits perfectly the metabolite signals, as illustrated in Fig.2. The horizontal lines are the spine volume fractions ($$$\eta$$$) illustrated to highlight intracellular exchange between compartments (i.e. spines and main dendrite), which is prominent for $$$\sigma$$$>0.75.
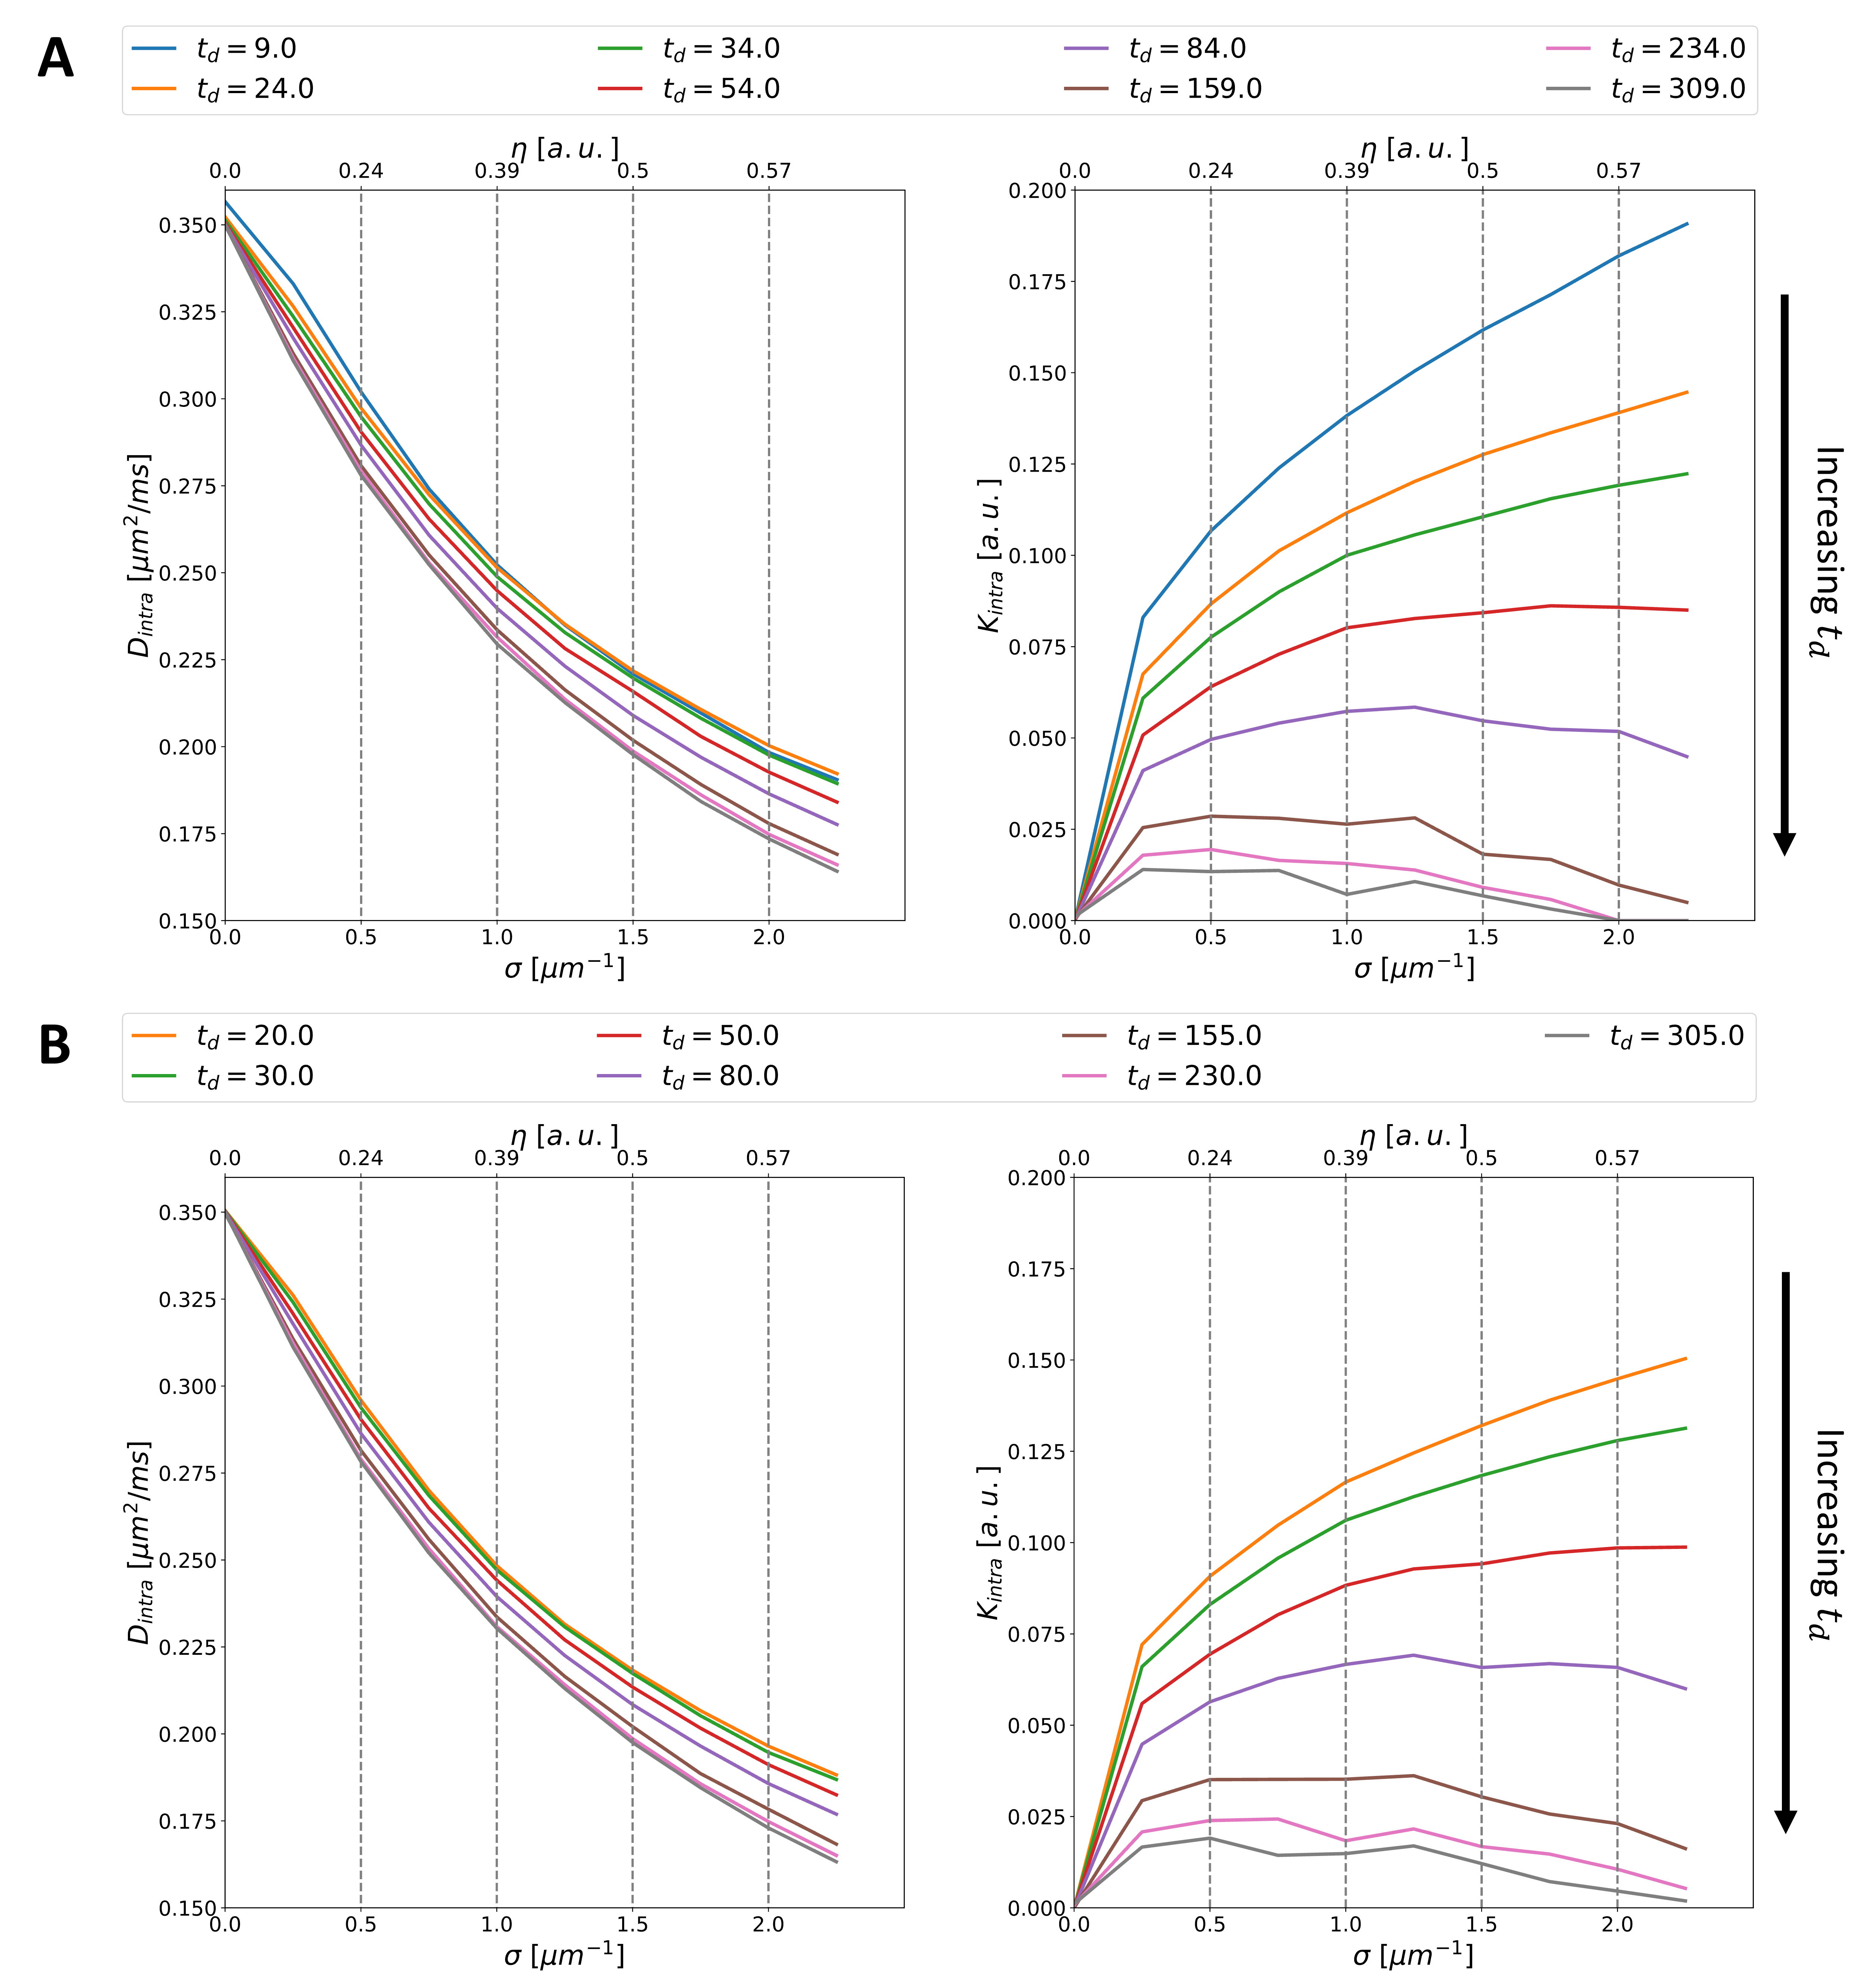
Fig.3 presents estimated $$$D_{intra}$$$ and $$$K_{intra}$$$ values as a function of (and corresponding $$$\eta$$$ values).
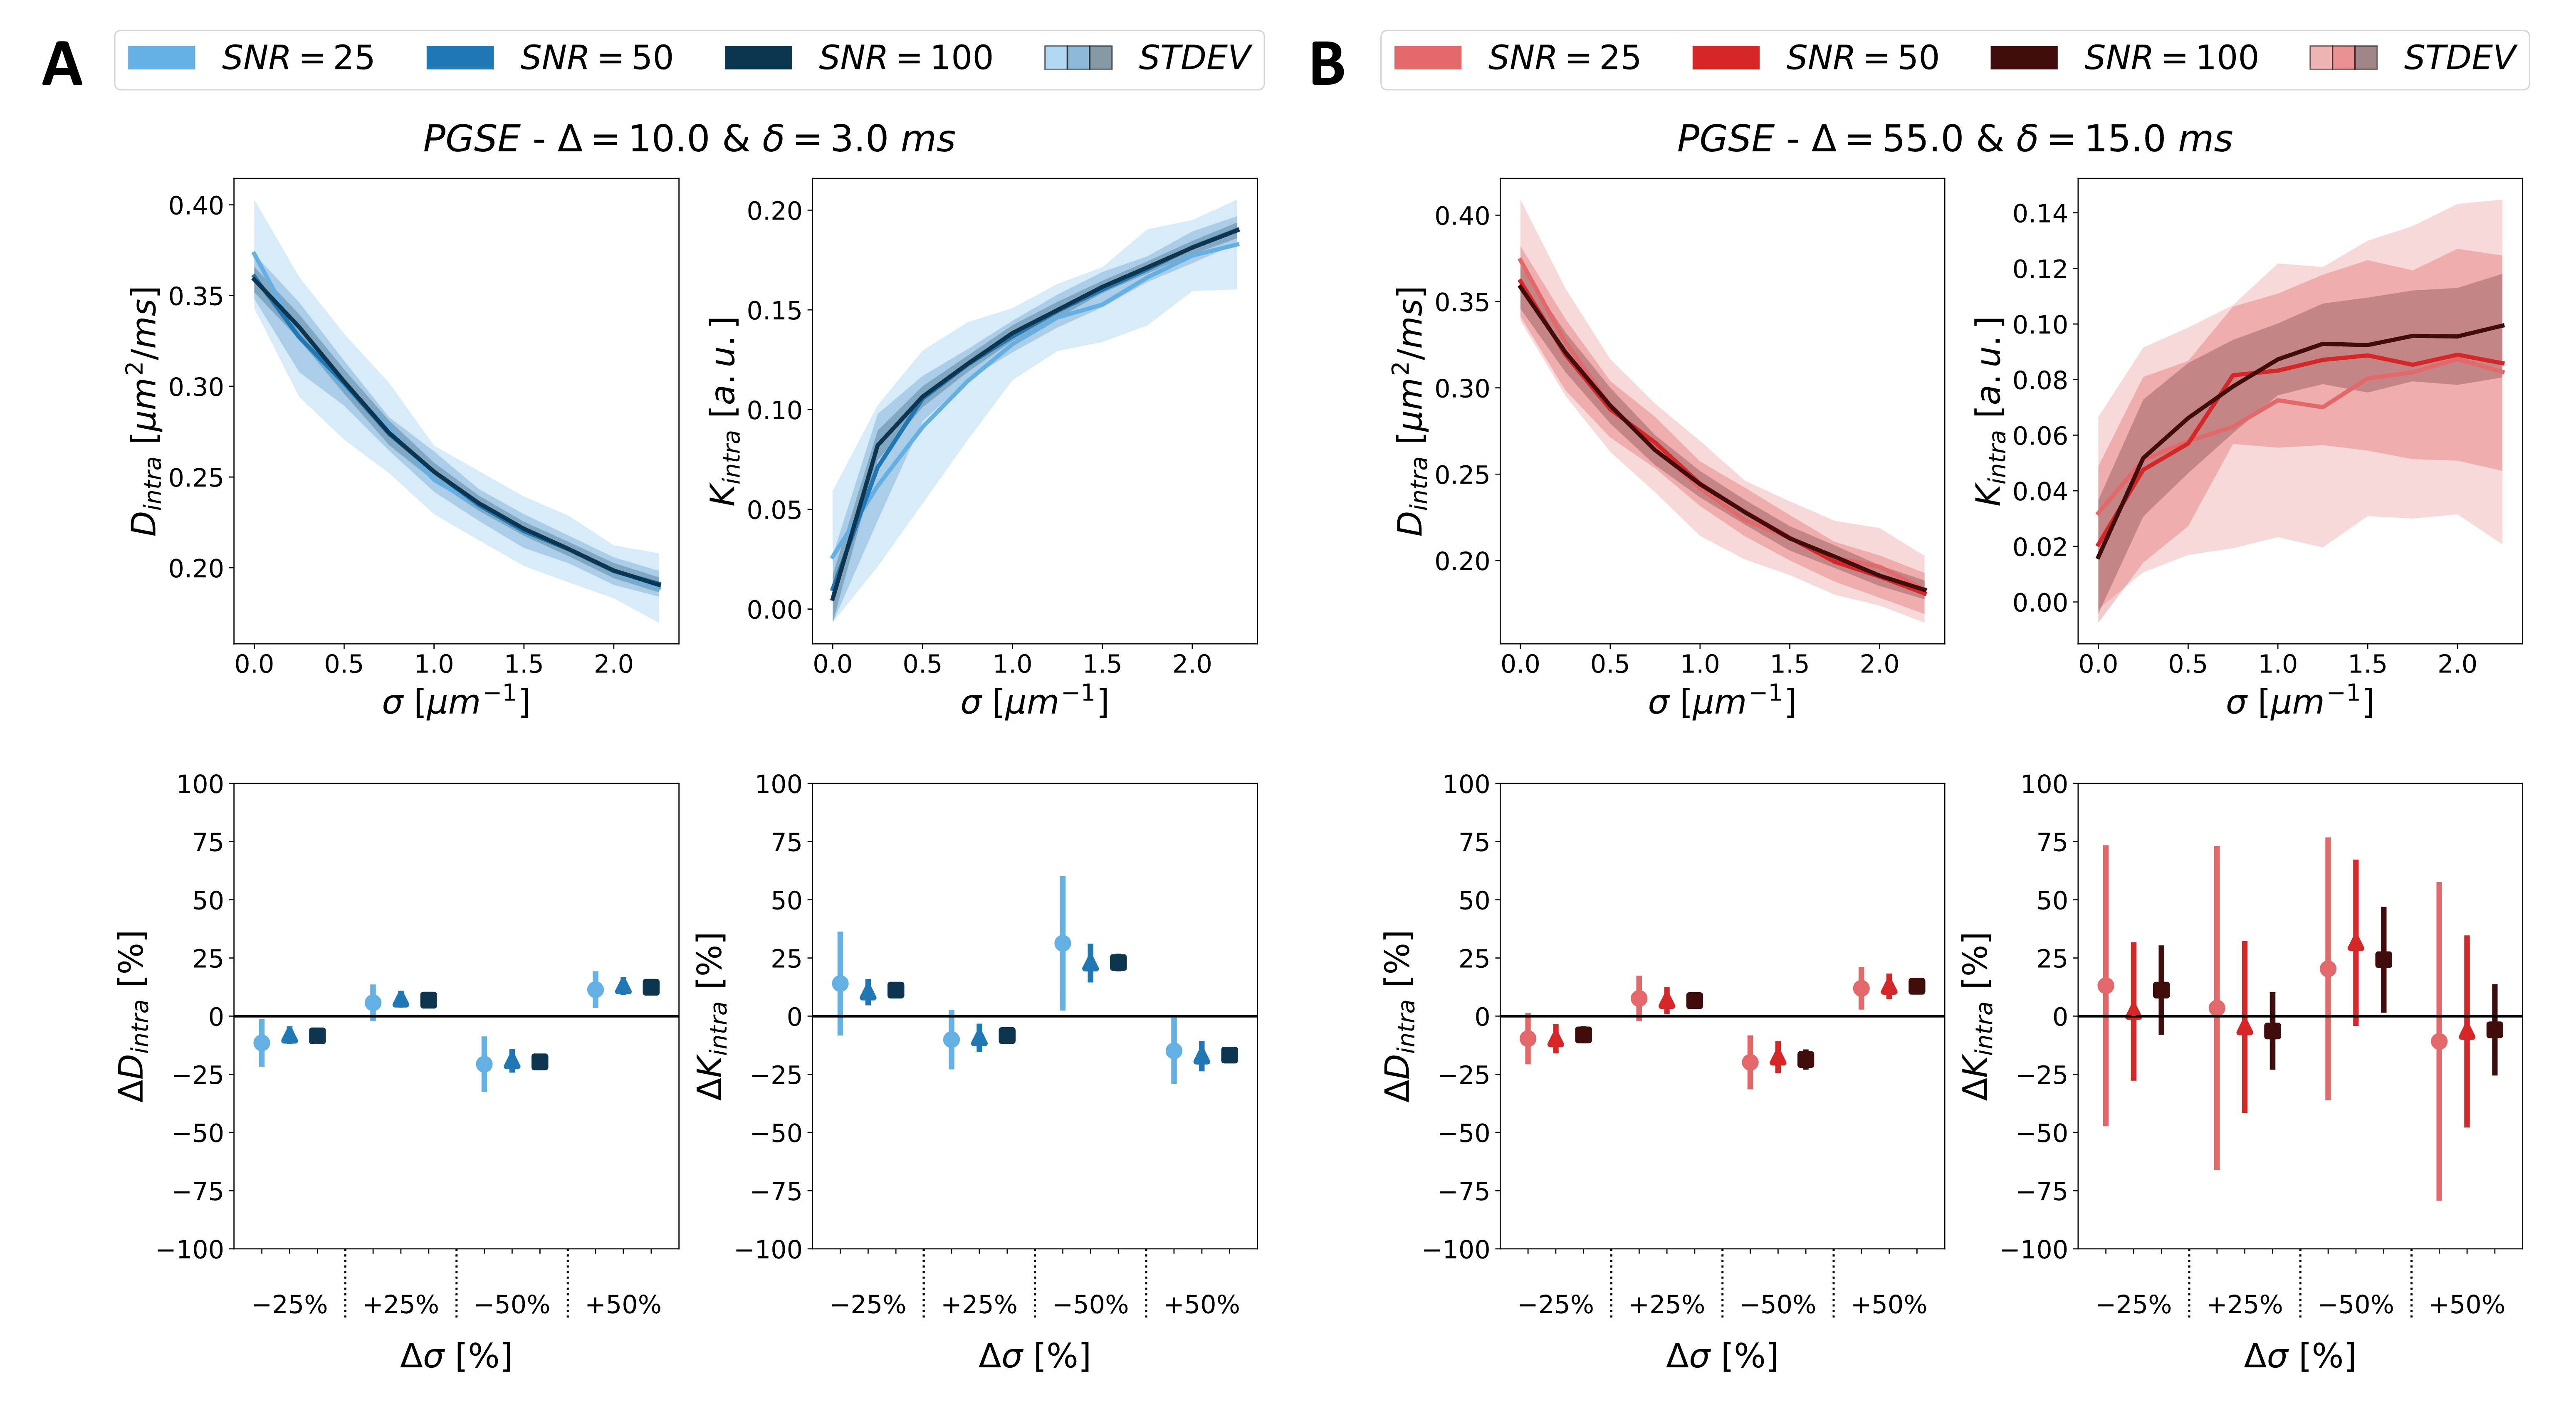
The sensitivity analysis of spines on the dendritic branches is reported in Fig.4 for ideal (A) and clinically feasible (B) acquisitions. At the top of each panel, the mean values of $$$D_{intra}$$$ & $$$K_{intra}$$$ obtained from noise-induced signals at different SNR levels are illustrated as a function of $$$\sigma$$$. At the bottom, the relative changes in $$$D_{intra}$$$ & $$$K_{intra}$$$ driven by corresponding percentage changes of (i.e. +-25%; +-50%) from a given reference value of $$$\sigma$$$=1μm-1 are reported.
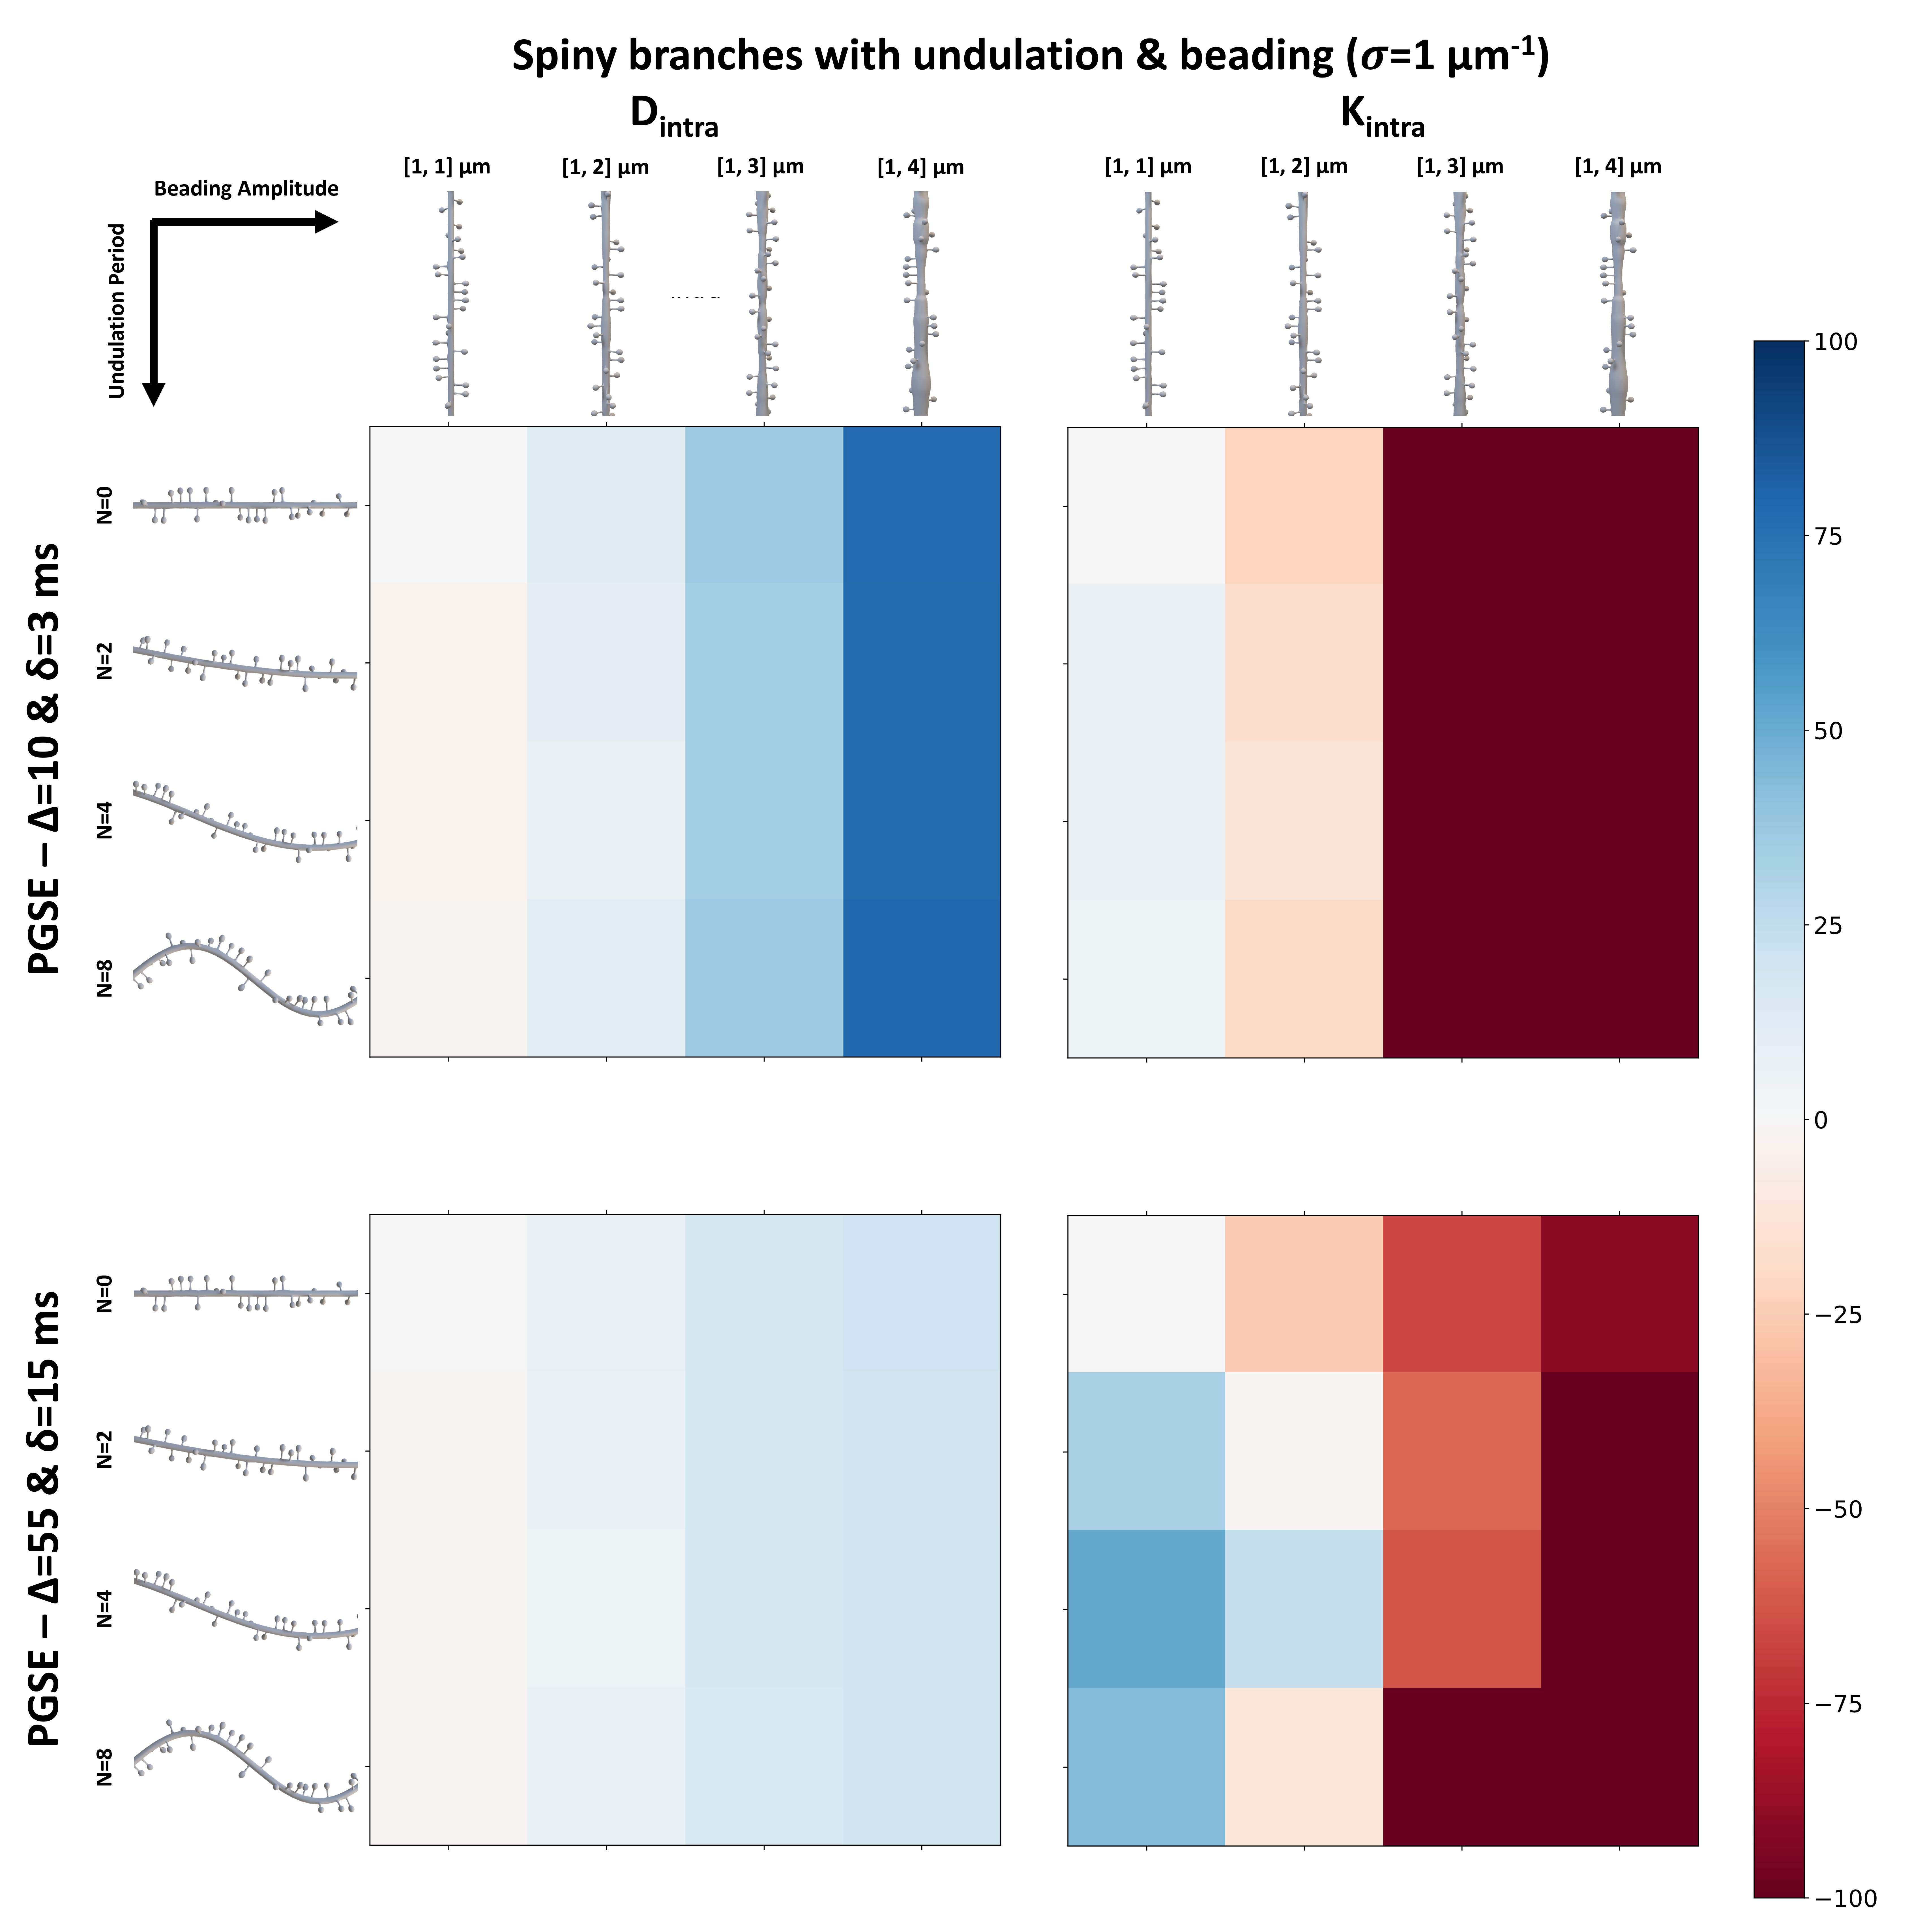
Fig.5 shows the relative changes in $$$D_{intra}$$$ & $$$K_{intra}$$$ obtained as in Fig.4 but from undulated and beaded spiny branches for the reference =1μm-1 for short (B) and fat (C) pulse schemes; ideal (top row) and clinically feasible (bottom row) cases.
Discussion
For changes in $$$\sigma$$$ from the typical value 1μm-1 observed in pathologies like essential tremor (~-25%)14 and autism (~+50%)16, $$$D_{intra}$$$ & $$$K_{intra}$$$ from the mAS model show measurable changes for the ideal acquisition at $$$t_d$$$=9ms. For the pulse scheme used in clinical human studies13,26, only changes in $$$D_{intra}$$$ remain measurable, while changes in $$$K_{intra}$$$ require SNR>100 to be measurable.Noteworthy, undulations and beading overall lead to further decreasing $$$D_{intra}$$$ and increasing $$$K_{intra}$$$. However, this effect is minimal (~+-10%) for realistic values of beading amplitude (1-2μm) and undulation period (0-4), and even less (~+-5%) for clinically feasible pulse schemes.
Conclusion
This study suggests that metabolite diffusion as measured by dMRS can be sensitive to spine density and that $$$D_{intra}$$$ & $$$K_{intra}$$$ from the mAS model can be promising imaging markers of GM ‘micro-connectivity’ in healthy and diseased brain.Acknowledgements
• This work, KS and MP are supported by UKRI Future Leaders Fellowship (MR/T020296/2).References
1. Novikov DS, Kiselev VG, Jespersen SN. On modeling. Magn Reson Med. 2018;79(6):3172-3193. doi:10.1002/mrm.27101
2. Ligneul C, Najac C, Döring A, et al. Diffusion-weighted MR spectroscopy: consensus, recommendations and resources from acquisition to modelling. Published online May 18, 2023. Accessed July 11, 2023. https://arxiv.org/abs/2305.10829v1
3. Ronen I, Valette J. Diffusion-weighted magnetic resonance spectroscopy. eMagRes. 2015;4(4):733-750. doi:10.1002/9780470034590.emrstm1471
4. Palombo M, Shemesh N, Ronen I, Valette J. Insights into brain microstructure from in vivo DW-MRS. Neuroimage. 2018;182:97-116. doi:10.1016/J.NEUROIMAGE.2017.11.028
5. Palombo M, Ianus A, Guerreri M, et al. SANDI: A compartment-based model for non-invasive apparent soma and neurite imaging by diffusion MRI. Neuroimage. 2020;215:116835. doi:10.1016/J.NEUROIMAGE.2020.116835
6. Ianus A, Alexander DC, Zhang H, Palombo M. Mapping complex cell morphology in the grey matter with double diffusion encoding MR: A simulation study. Neuroimage. 2021;241:118424. doi:10.1016/J.NEUROIMAGE.2021.118424
7. Vincent M, Palombo M, Valette J. Revisiting double diffusion encoding MRS in the mouse brain at 11.7T: Which microstructural features are we sensitive to? Neuroimage. 2020;207:116399. doi:10.1016/J.NEUROIMAGE.2019.116399
8. Palombo M, Ligneul C, Najac C, et al. New paradigm to assess brain cell morphology by diffusion-weighted MR spectroscopy in vivo. Proc Natl Acad Sci U S A. 2016;113(24):6671-6676. doi:10.1073/pnas.1504327113
9. Brabec J, Lasič S, Nilsson M. Time-dependent diffusion in undulating thin fibers: Impact on axon diameter estimation. NMR Biomed. 2020;33(3):e4187. doi:10.1002/NBM.4187
10. Budde MD, Frank JA. Neurite beading is sufficient to decrease the apparent diffusion coefficient after ischemic stroke. Proc Natl Acad Sci U S A. 2010;107(32):14472-14477. doi:10.1073/PNAS.1004841107/SUPPL_FILE/PNAS.201004841SI.PDF
11. Lundell H, Najac C, Bulk M, Kan HE, Webb AG, Ronen I. Compartmental diffusion and microstructural properties of human brain gray and white matter studied with double diffusion encoding magnetic resonance spectroscopy of metabolites and water. Neuroimage. 2021;234:117981. doi:10.1016/J.NEUROIMAGE.2021.117981
12. Palombo M, Ligneul C, Hernandez-Garzon E, Valette J. Can we detect the effect of spines and leaflets on the diffusion of brain intracellular metabolites? Neuroimage. 2018;182:283-293. doi:10.1016/J.NEUROIMAGE.2017.05.003
13. Palombo M, Gallea C, Genovese G, Lehéricy S, Branzoli F. Characterizing the fine microstructure of cerebellar and cerebral cortex non-invasively with metabolite diffusion-weighted MRS. In: Proceedings of the Virtual Conference of ISMRM. ; 2020:0846.
14. Louis ED, Lee M, Babij R, et al. Reduced Purkinje cell dendritic arborization and loss of dendritic spines in essential tremor. Brain. 2014;137(12):3142. doi:10.1093/BRAIN/AWU314
15. Hutsler JJ, Zhang H. Increased dendritic spine densities on cortical projection neurons in autism spectrum disorders. Brain Res. 2010;1309:83-94. doi:10.1016/J.BRAINRES.2009.09.120
16. Perez-Cruz C, Nolte MW, Van Gaalen MM, et al. Reduced Spine Density in Specific Regions of CA1 Pyramidal Neurons in Two Transgenic Mouse Models of Alzheimer’s Disease. Journal of Neuroscience. 2011;31(10):3926-3934. doi:10.1523/JNEUROSCI.6142-10.2011
17. The MathWorks Inc. MATLAB version: 9.12.0 (R2022a). Published online 2022.
18. Cuntz H, Forstner F, Borst A, Häusser M. One Rule to Grow Them All: A General Theory of Neuronal Branching and Its Practical Application. PLoS Comput Biol. 2010;6(8):e1000877. doi:10.1371/JOURNAL.PCBI.1000877
19. Blender Online Community. Blender - a 3D modelling and rendering package. Published online 2017.
20. Kerkelä L, Nery F, Hall MG, Clark CA. Disimpy: A massively parallel Monte Carlo simulator for generating diffusion-weighted MRI data in Python. J Open Source Softw. 2020;5(52):2527. doi:10.21105/JOSS.02527 21. Hall MG, Alexander DC. Convergence and Parameter Choice for Monte-Carlo Simulations of Diffusion MRI. IEEE Trans Med Imaging. 2009;28(9):1354-1364. doi:10.1109/TMI.2009.2015756
22. Rafael-Patino J, Romascano D, Ramirez-Manzanares A, Canales-Rodríguez EJ, Girard G, Thiran JP. Robust Monte-Carlo Simulations in Diffusion-MRI: Effect of the Substrate Complexity and Parameter Choice on the Reproducibility of Results. Front Neuroinform. 2020;14:457195. doi:10.3389/FNINF.2020.00008/BIBTEX
23. Palombo M, Ligneul C, Valette J. Modeling diffusion of intracellular metabolites in the mouse brain up to very high diffusion-weighting: Diffusion in long fibers (almost) accounts for non-monoexponential attenuation. Magn Reson Med. 2017;77(1):343-350. doi:10.1002/MRM.26548
24. Sukstanskii AL, Yablonskiy DA. In vivo lung morphometry with hyperpolarized 3He diffusion MRI: Theoretical background. Journal of Magnetic Resonance. 2008;190(2):200-210. doi:10.1016/J.JMR.2007.10.015
25. Yablonskiy DA, Sukstanskii AL. Theoretical models of the diffusion weighted MR signal. NMR Biomed. 2010;23(7):661-681. doi:10.1002/NBM.1520
26. Simsek K, Gallea C, Genovese G, Lehéricy S, Branzoli F, Palombo M. Characterizing the effect of dendritic spines on brain metabolites diffusion in cerebellar and cerebral cortex non-invasively with diffusion-weighted MRS. In: ESMRMB 39th Annual Scientific Meeting. ; 2023:104-105.
27. Palombo M, Shemesh N, Ronen I, Valette J. Insights into brain microstructure from in vivo DW-MRS. Neuroimage. 2018;182:97-116. doi:10.1016/j.neuroimage.2017.11.028
28. MICrONS Explorer. Accessed November 8, 2023. https://www.microns-explorer.org/phase1
Figures