0932
Revealing membrane integrity and cell size from diffusion kurtosis time-dependence1Radiology, Massachusetts General Hospital, Charlestown, MA, United States, 2New York University School of Medicine, New York, NY, United States
Synopsis
Keywords: Simulation/Validation, Microstructure, simulations, validation
Motivation: The non-monotonic dependence of the diffusion kurtosis on diffusion time has been observed in tissue, yet its relation to membrane integrity and tissue geometry remains unknown.
Goal(s): We investigate the relation between the characteristic time tpeak and the tissue parameters, such as cell size, volume fraction and permeability.
Approach: We perform Monte Carlo simulations of diffusion and exchange in randomly, densely packed spheres with varying permeability, cell fractions and sizes, and identify the value of tpeak.
Results: We obtain an empirical, albeit highly accurate relation of tpeak to tissue parameters in a broad parameter range.
Impact: Diffusion-kurtosis time-dependence is sensitive to pathological changes in membrane integrity and cellular structure in diseases, such as ischemic stroke and tumors. Numerical simulations suggest an empirical interpretation of kurtosis time-dependence, offering a novel biomarker for in vivo evaluation of pathology.
Introduction
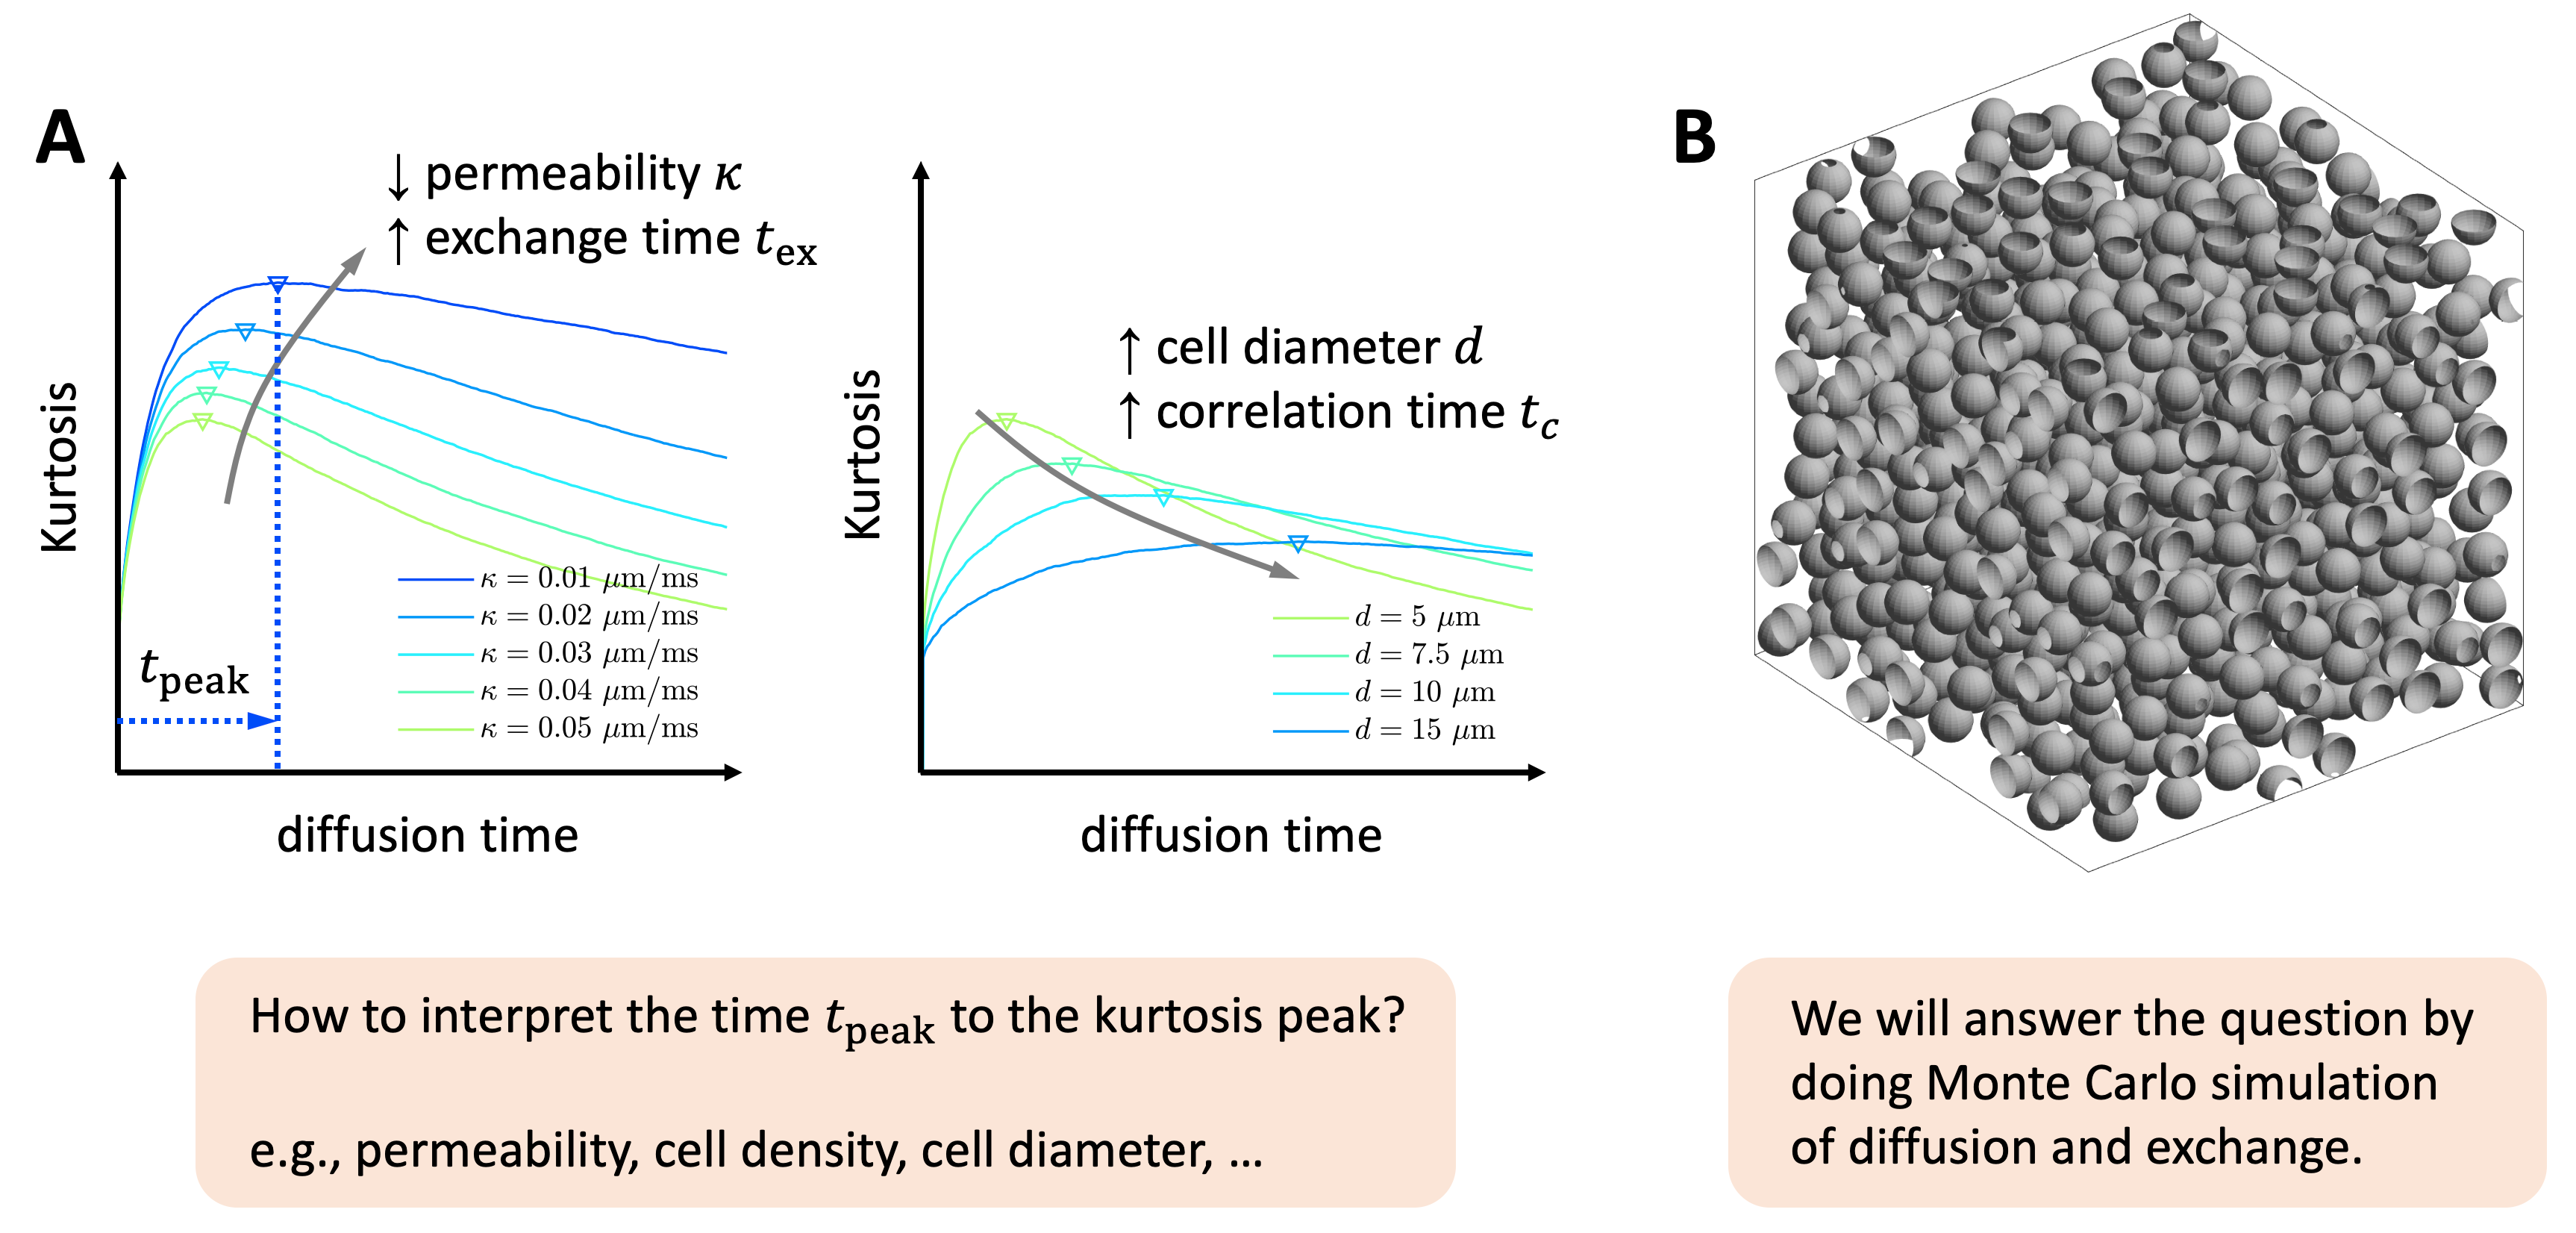
Pathological changes in membrane integrity and cellular structure have been observed in many diseases, such as ischemic stroke [1] and tumors [2]. Diffusion MRI is sensitive to the tissue microstructure at the cellular level [3], enabling the in vivo evaluation of the tissue pathology. For a tissue composed of permeable cells immersed in the extra-cellular space, non-Gaussian diffusion in this tissue model is exemplified by the time($$$t$$$)-dependent kurtosis $$$K(t)$$$ [4-11]. Within the Kärger model framework [4-5], $$$K(t)$$$ monotonically decreases, with a time constant $$$t_{ex}$$$ given by the exchange time. However, in biological tissue, $$$K(t)$$$ initially increases and reaches a peak at the time $$$t=t_{peak}$$$ [8,10]; Kärger model only applies to the kurtosis decrease past the peak [4-6,9,11]. The initial increase in $$$K(t)$$$ occurs on the correlation time scale $$$t_c$$$, the time to diffuse across a cell. These time scales in $$$K(t)$$$ are related with the membrane integrity and tissue geometry [4-11] (Figure 1A). This time $$$t_{peak}$$$ to the kurtosis peak is affected by the membrane permeability $$$\kappa$$$, cell density $$$f$$$, and cell diameter $$$d=2R$$$ with an unknown relationship. To better interpret the physical meaning of $$$t_{peak}$$$, we perform simulations of diffusion and water exchange in-between randomly, densely packed spheres (Figure 1B) in various values of $$$\kappa$$$, $$$f$$$, and $$$d$$$, identify the $$$t_{peak}$$$ in simulated kurtosis, and suggest an empirically relation of $$$t_{peak}$$$ with the above tissue parameters.Methods
Monte Carlo simulations were implemented in CUDA C++ [12] for diffusion and water exchange in-between randomly packed spheres of the same size. To cover a wide range of tissue properties, we varied the sphere diameter $$$d=2R$$$ = [5, 7.5, 10, 15] micron, sphere volume fraction $$$f$$$ = [0.3, 0.4, 0.5, 0.6], and the membrane permeability $$$\kappa$$$ = [0, 0.01, 0.02, 0.03, 0.04, 0.05] $$$\mu$$$m/ms, with red blood cell membrane permeability = 0.03-0.07 $$$\mu$$$m/ms providing an upper limit [13]. We randomly packed 999 spheres in periodic boundary condition for each simulation setup [14], resulting in 4x4x6 = 96 different packing geometries.In each simulation, $$$2\times10^6$$$ random walkers were employed, diffusing $$$2\times10^6$$$ steps with a duration $$$dt=10^{-4}$$$ ms and a step length $$$dx=\sqrt{6D_0dt}$$$, where the intrinsic diffusivity inside the sphere is $$$D_{0,in}$$$ = 1 $$$\mu$$$m$$$^2$$$/ms, and the intrinsic diffusivity outside the sphere is $$$D_{0,out}$$$ = 2 $$$\mu$$$m$$$^2$$$/ms. Mean kurtosis (MK) was calculated via the cumulants of diffusion displacements at diffusion time $$$t\leq$$$ 200 ms. The total calculation time for simulations is 9 days.
Diffusion and exchange time scales are defined as follows: correlation time $$$t_c=R^2/D_{0,in}$$$ is the time to diffuse across the cell once, water exchange time $$$t_{ex}=(1-f)/r_{i\to o}$$$ is the time to exchange between the intra- and extra-cellular space, where the water exchange rate (intra- to extra-cellular space) is $$$r_{i\to o}=\kappa\cdot(S/V)_{in}$$$, and the surface-to-volume ratio of intra-cellular space is $$$(S/V)_{in}=3/R$$$ for the sphere.
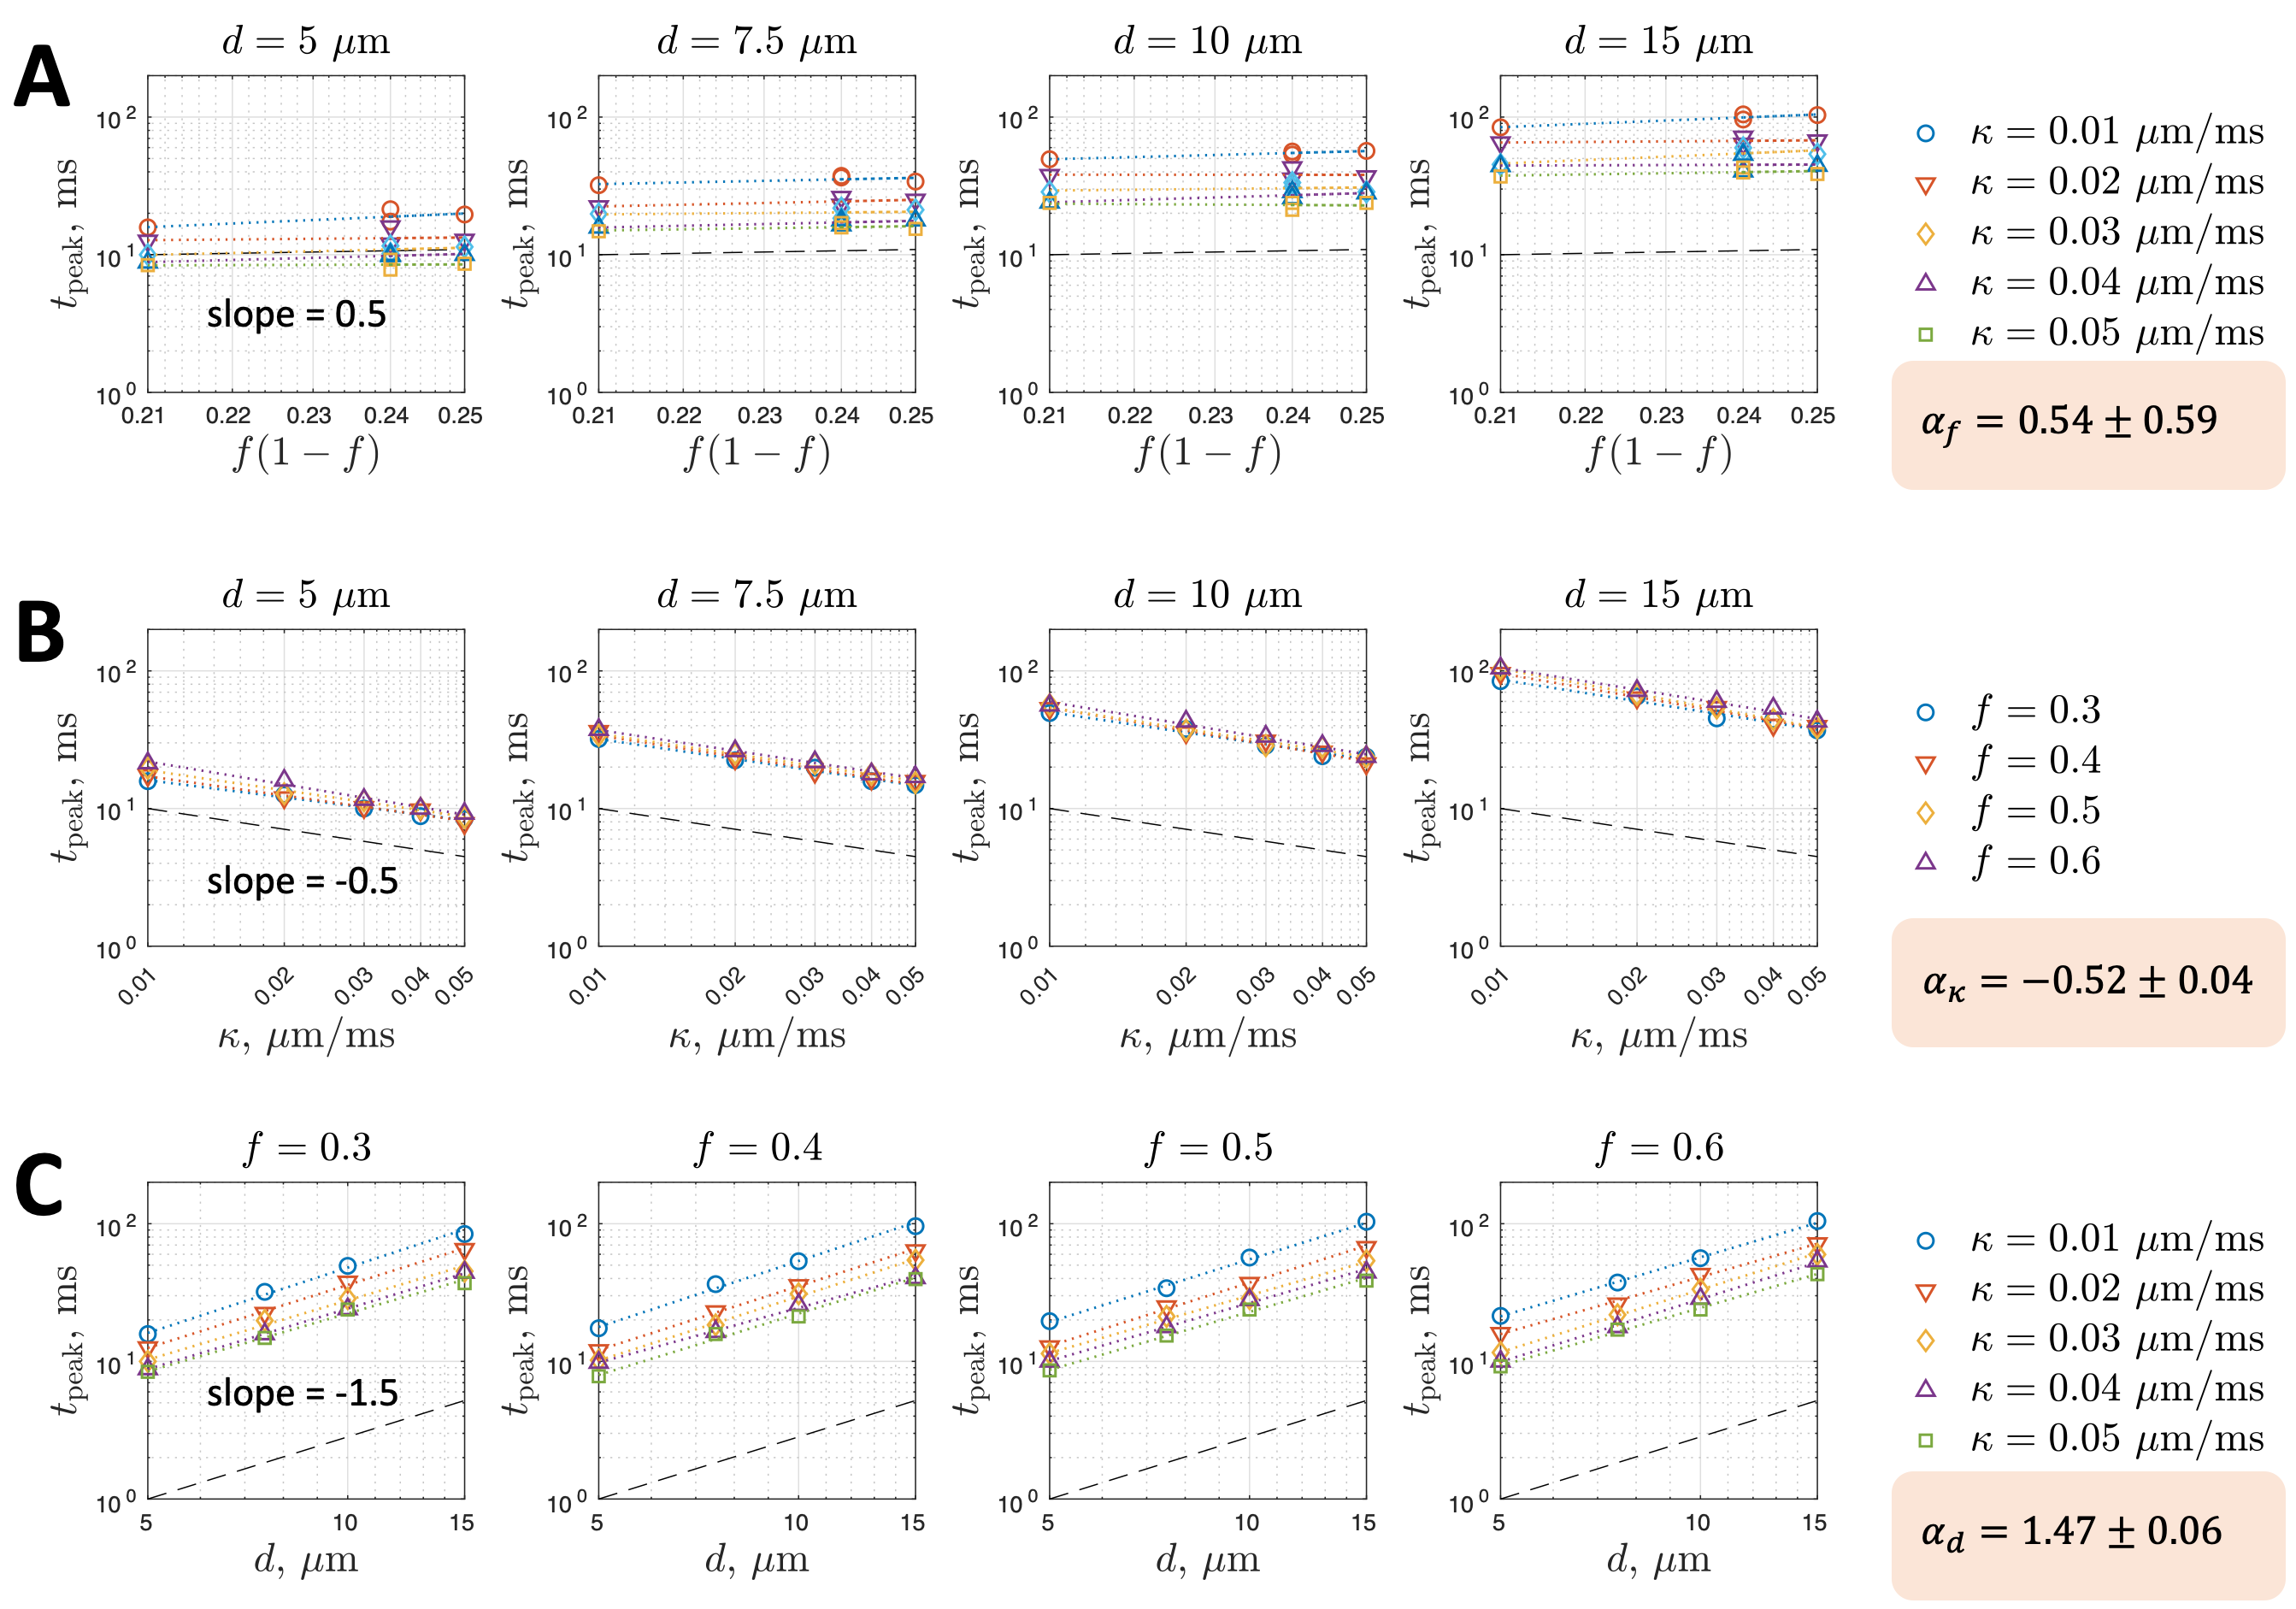
An empirical model for the time $$$t_{peak}$$$ to the kurtosis peak was fitted to investigate its relation with tissue parameters,
$$t_{peak} \propto [f(1-f)]^{\alpha_f} \cdot \kappa^{\alpha_\kappa} \cdot d^{\alpha_d}\,,$$
where the $$$\alpha_f$$$, $$$\alpha_\kappa$$$, and $$$\alpha_d$$$ are the power-law exponents of parameters $$$f(1-f)$$$, $$$\kappa$$$, and $$$d$$$. Based on the estimated values of exponents, we suggest a relation of $$$t_{peak}$$$ with other time scales ($$$t_c$$$, $$$t_{ex}$$$).
Results
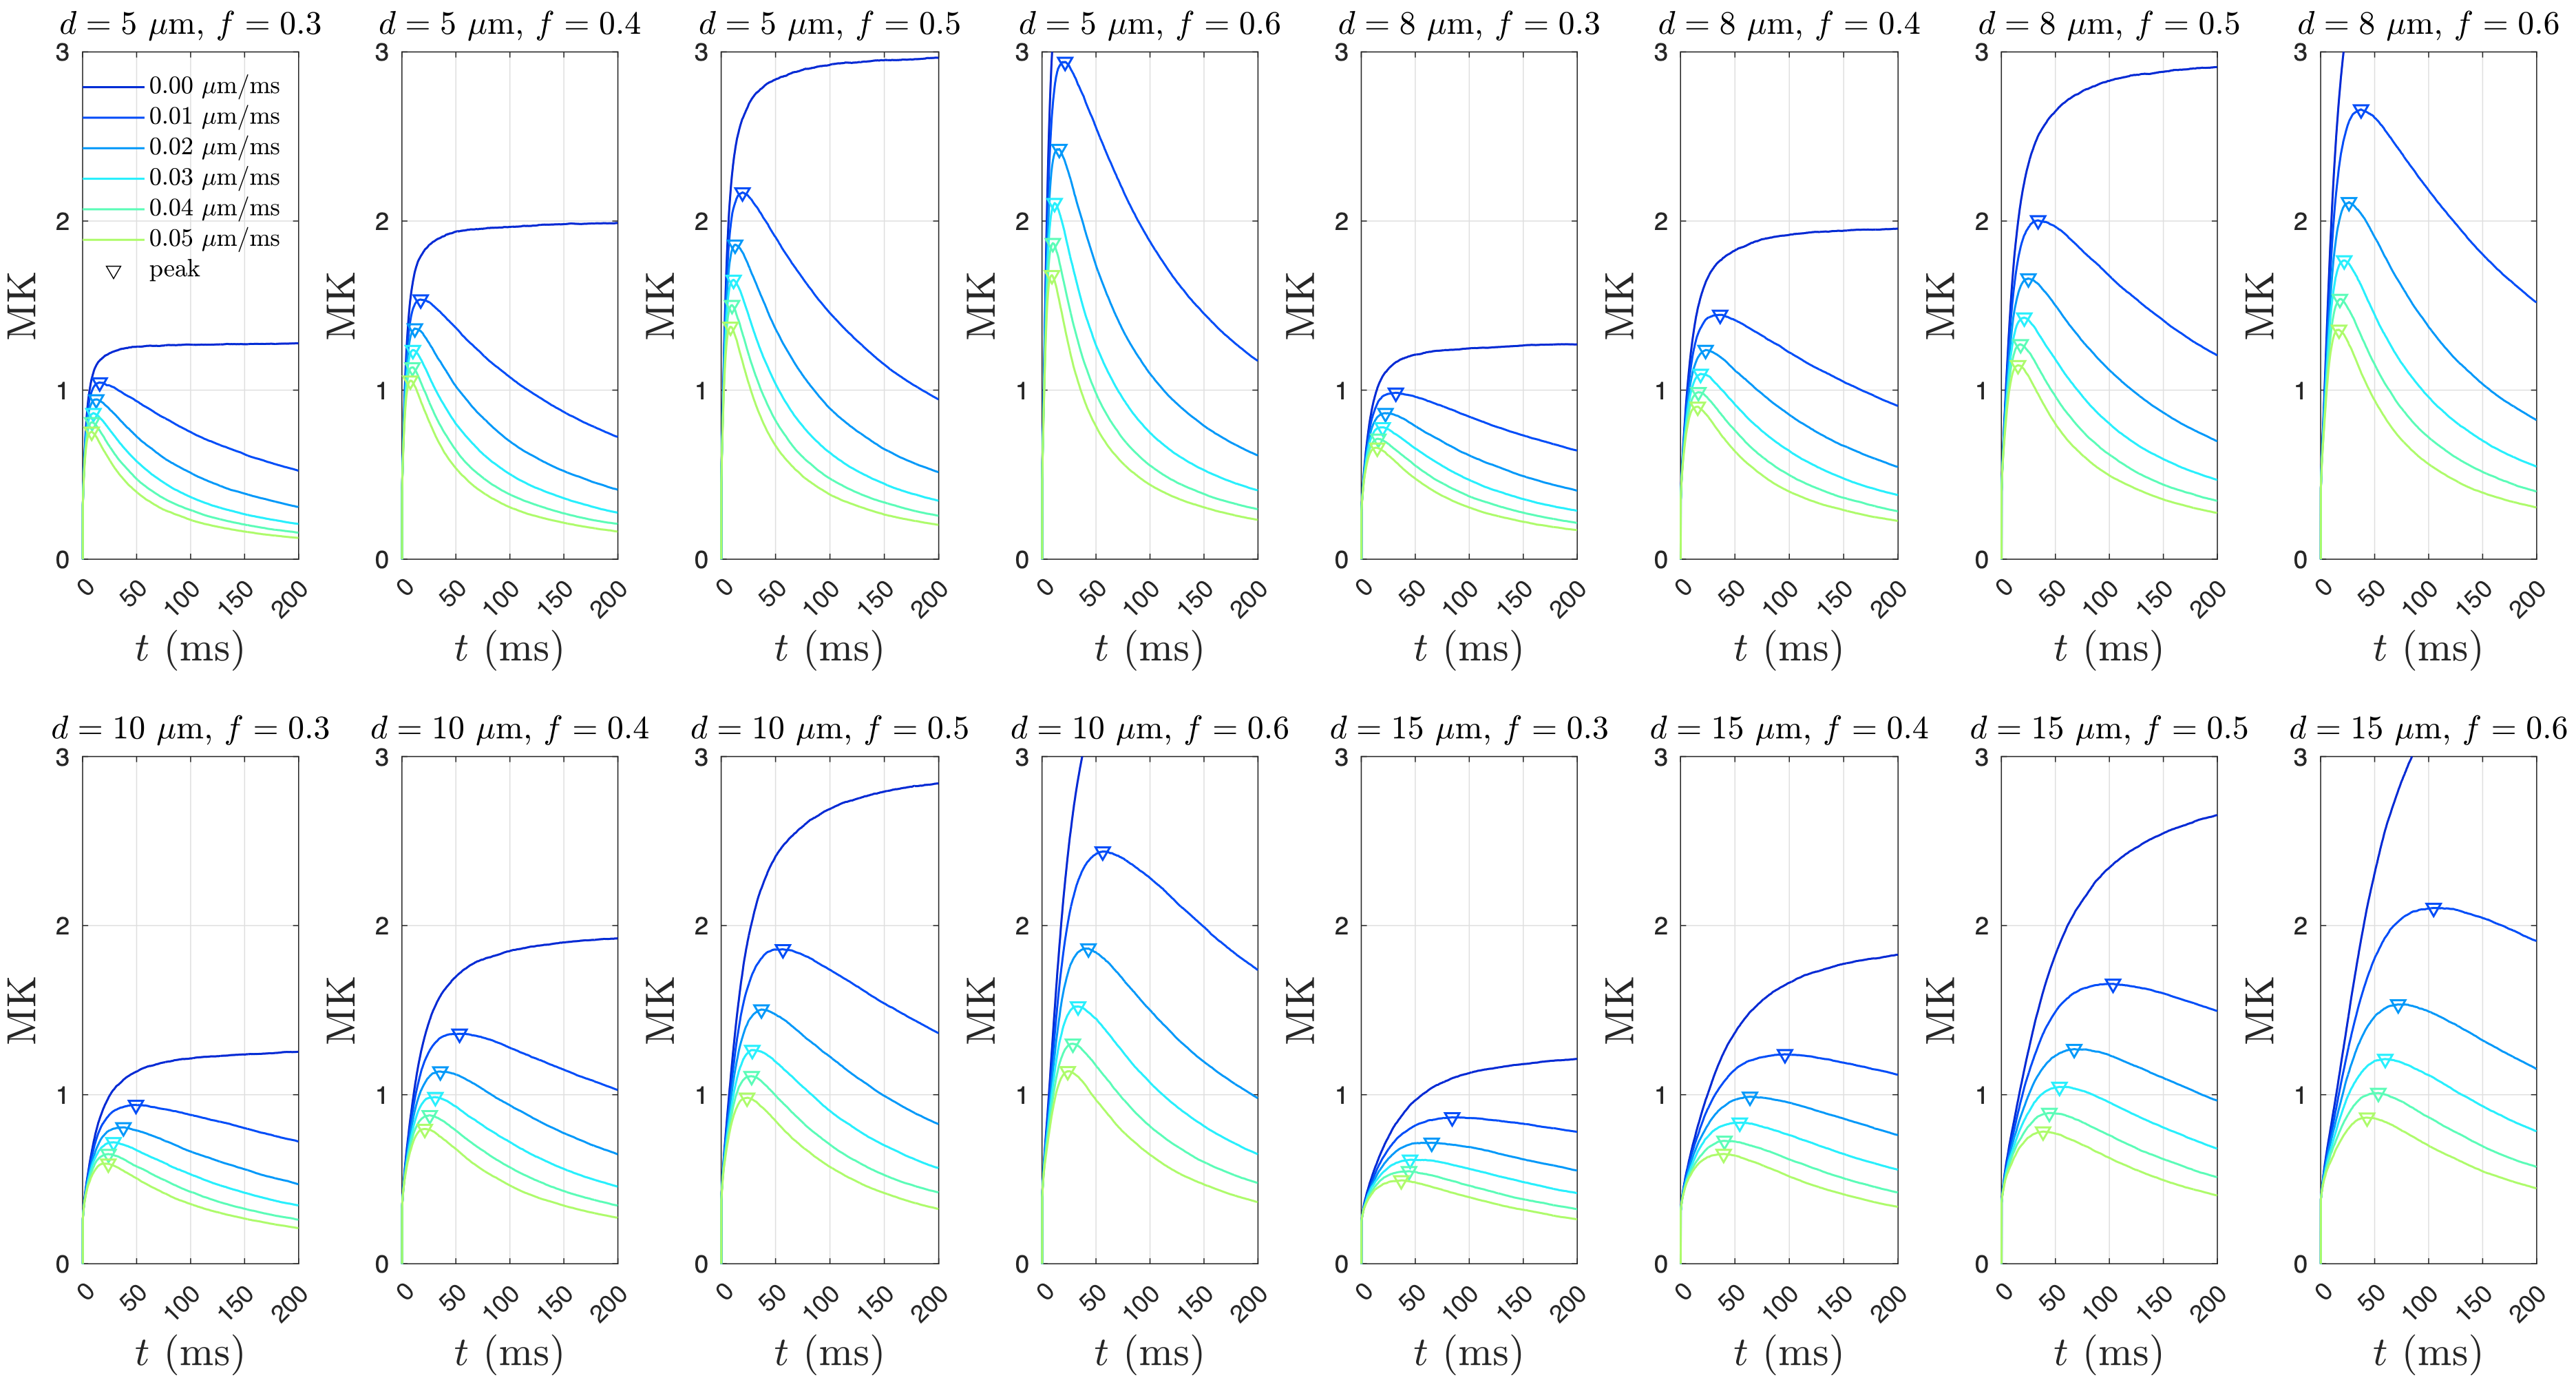
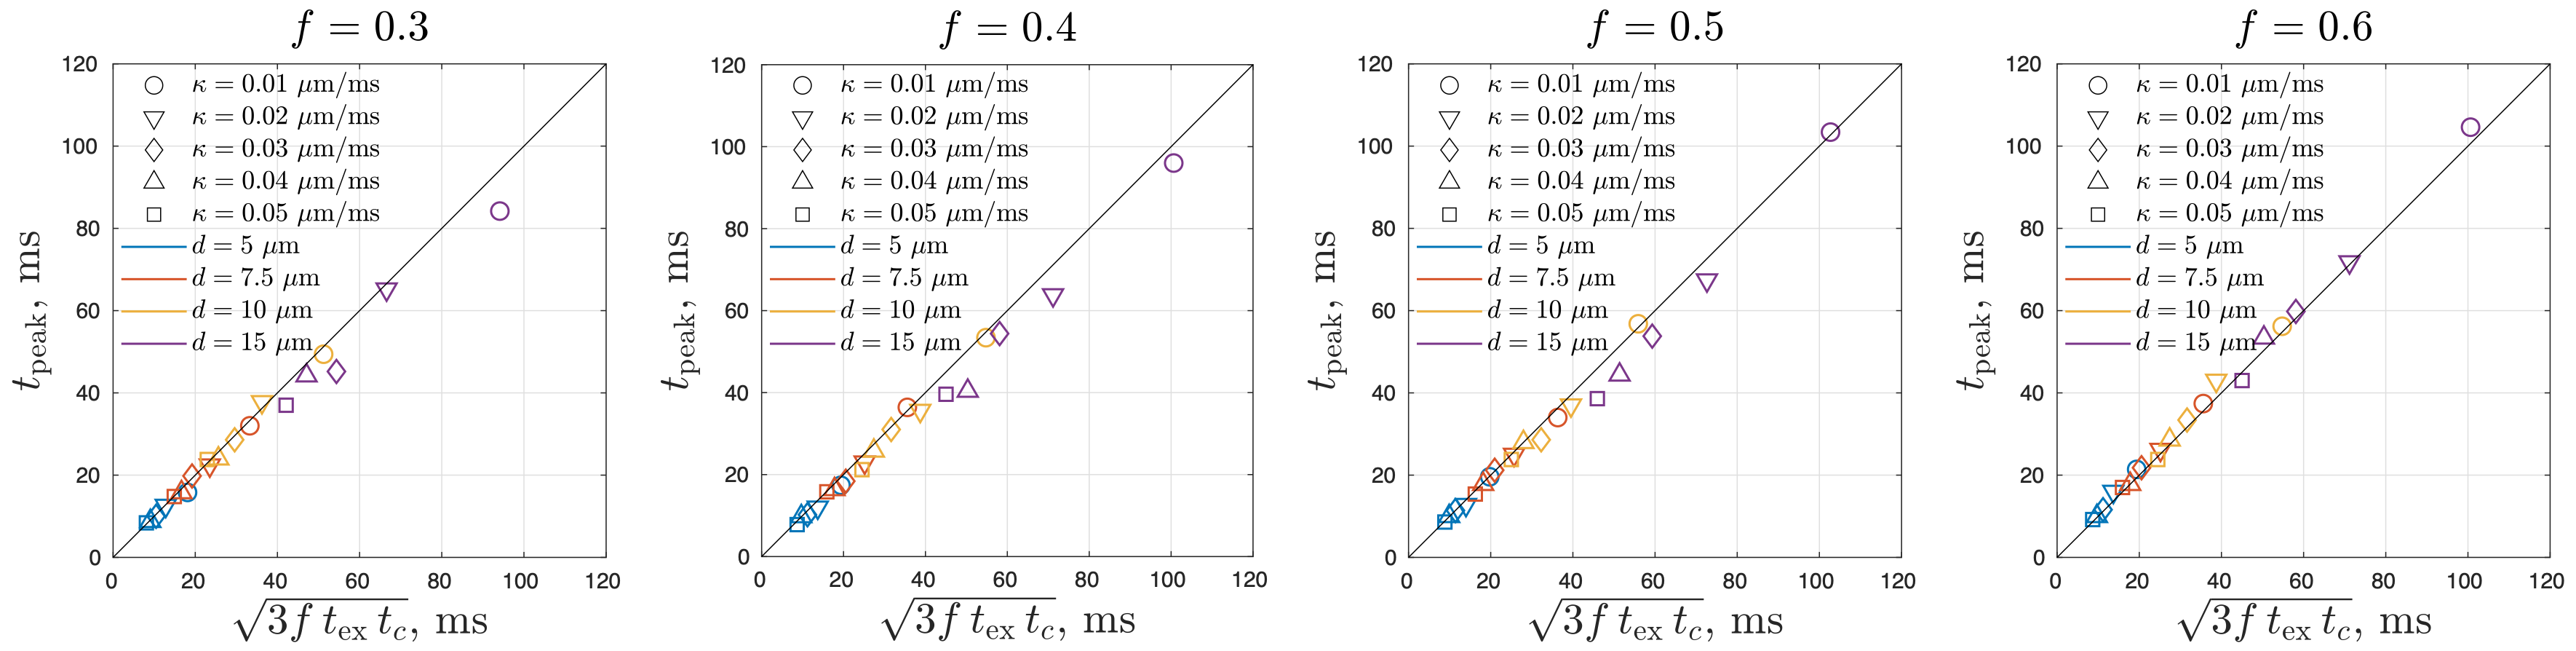
Simulated MK initially increases and then decreases with time for permeable membranes, whereas MK monotonically increases with time for non-permeable membranes (Figure 2). By identifying the time to the kurtosis peak, we show that $$$t_{peak}$$$ varies with the parameters $$$f(1-f)$$$, $$$\kappa$$$, and $$$d$$$ with the power-law exponents of $$$\alpha_f=0.54\pm0.59$$$, $$$\alpha_\kappa=-0.52\pm0.04$$$, $$$\alpha_d=1.47\pm0.06$$$ (Figure 3). Based on the results ($$$\alpha_f\sim0.5$$$, $$$\alpha_\kappa\sim-0.5$$$, $$$\alpha_d\sim1.5$$$), we suggest the following relation for $$$t_{peak}$$$:$$t_{peak}\simeq\sqrt{3f t_{ex} t_c}=\left(\frac{f(1-f)(d/2)^3}{\kappa D_{0,in}}\right)^{1/2}\,.$$
The applicability of the above relation was validated by the simulations, showing a very high accuracy (Figure 4).
Conclusion and Discussion
MC simulations of diffusion and exchange suggest that the experimentally relevant $$$t_{peak}$$$ time scale in kurtosis is proportional to the geometric mean of two characteristic time scales --- the correlation time (determined by cell size) and the exchange time (determined by membrane permeability). Thus, $$$t_{peak}$$$ can be a biomarker for in vivo evaluation of tissue pathology.In addition, time-dependent kurtosis at long times enables extracting $$$t_{ex}$$$ using the Kärger model [4], and the additional measurement of $$$t_{peak}$$$ can be used together to further reveal the correlation time, disentangling between cellular structure and membrane integrity.
Acknowledgements
This study is support by NIH under the award number: DP5OD031854, R01NS118187, P41EB015896, P41EB030006, U01EB026996, S10RR023401, S10RR019307, R21NS081230, R01NS088040, P41EB017183.References
1. Bortner, C. D., & Cidlowski, J. A. (2020). Ions, the movement of water and the apoptotic volume decrease. Frontiers in cell and developmental biology, 8, 611211.
2. Reynaud, O. (2017). Time-dependent diffusion MRI in cancer: tissue modeling and applications. Frontiers in Physics, 5, 58.
3. Novikov, D. S., Fieremans, E., Jespersen, S. N., & Kiselev, V. G. (2019). Quantifying brain microstructure with diffusion MRI: Theory and parameter estimation. NMR in Biomedicine, 32(4), e3998.
4. Fieremans, E., Novikov, D. S., Jensen, J. H., & Helpern, J. A. (2010). Monte Carlo study of a two‐compartment exchange model of diffusion. NMR in Biomedicine, 23(7), 711-724.
5. Nilsson, M., Alerstam, E., Wirestam, R., Sta, F., Brockstedt, S., & Lätt, J. (2010). Evaluating the accuracy and precision of a two-compartment Kärger model using Monte Carlo simulations. Journal of Magnetic Resonance, 206(1), 59-67.
6. Novikov, D.S., Coronado-Leija, R., & Fieremans E. (2023). Exchange between structurally-disordered compartments. Proceedings of ISMRM.
7. Jespersen, S. N., Olesen, J. L., Hansen, B., & Shemesh, N. (2018). Diffusion time dependence of microstructural parameters in fixed spinal cord. Neuroimage, 182, 329-342.
8. Wu, D., & Zhang, J. (2019). Effects of Diffusion Gradient Waveforms on Time-dependent Kurtosis and Microstructural Properties. Proceedings of ISMRM.
9. Lee, H. H., Papaioannou, A., Novikov, D. S., & Fieremans, E. (2020). In vivo observation and biophysical interpretation of time-dependent diffusion in human cortical gray matter. Neuroimage, 222, 117054.
10. Aggarwal, M., Smith, M. D., & Calabresi, P. A. (2020). Diffusion‐time dependence of diffusional kurtosis in the mouse brain. Magnetic resonance in medicine, 84(3), 1564-1578.
11. Li, C., Fieremans, E., Novikov, D. S., Ge, Y., & Zhang, J. (2023). Measuring water exchange on a preclinical MRI system using filter exchange and diffusion time dependent kurtosis imaging. Magnetic Resonance in Medicine, 89(4), 1441-1455.
12. Lee, H. H., Fieremans, E., & Novikov, D. S. (2021). Realistic Microstructure Simulator (RMS): Monte Carlo simulations of diffusion in three-dimensional cell segmentations of microscopy images. Journal of neuroscience methods, 350, 109018.
13. Stanisz, G. J., Li, J. G., Wright, G. A., & Henkelman, R. M. (1998). Water dynamics in human blood via combined measurements of T2 relaxation and diffusion in the presence of gadolinium. Magnetic resonance in medicine, 39(2), 223-233.
14. Donev, A., Torquato, S., & Stillinger, F. H. (2005). Neighbor list collision-driven molecular dynamics simulation for nonspherical hard particles. I. Algorithmic details. Journal of computational physics, 202(2), 737-764.
Figures