0931
Fast Volumetric Mapping of Brain NAD Levels Using 7T 31P-MRSI and Learned Probabilistic Subspaces1Siemens Medical Solutions USA, Inc., Urbana, IL, United States, 2Beckman Institute for Advanced Science and Technology, University of Illinois at Urbana-Champaign, Urbana, IL, United States, 3Department of Psychiatry, University of Pittsburgh, Pittsburgh, PA, United States, 4Center for Magnetic Resonance Research, Department of Radiology, University of Minnesota, Minneapolis, MN, United States, 5Department of Electrical and Computer Engineering, University of Illinois at Urbana-Champaign, Urbana, IL, United States
Synopsis
Keywords: Non-Proton, Non-Proton
Motivation: Measuring brain intracellular NAD levels has long been of interest, but the current 31P-MRSI methods would take prohibitively long scan times for mapping NAD.
Goal(s): To present a method for fast volumetric NAD mapping of the entire human brain.
Approach: In vivo 31P-MRSI scans were performed at 7T with a nominal resolution of 1.0 cc within 20 minutes. A probabilistic subspace-based method integrating spectral prior, spatial constraint, and statistical distributions was applied for denoising.
Results: The proposed method successfully provided high-resolution brain NAD mapping within 20-minute scans. The results also showed promises in revealing metabolic tissue heterogeneity and age correlation of NAD.
Impact: This work demonstrates the feasibility of volumetric brain NAD mapping with a nominal resolution of 1.0 cc within 20 minutes. It may provide a powerful metabolic imaging tool for many applications.
Introduction
Nicotinamide adenine dinucleotide (NAD) is a crucial metabolite and coenzyme, playing key roles in energy metabolism, mitochondrial function, cellular signaling, aging and longevity.1,2 Measuring intracellular NAD levels in the brain has been of high interests in studying brain aging, cognitive functions, and neurodegenerative diseases.3,4 However, given its sub-millimolar concentration in the brain thus poor SNR, assessing the NAD levels using 31P-MRSI assay is very challenging.5,6 The current studies are restricted to limited brain regions, or mapping over the entire brain could take prohibitively long scan times.7,8This work introduces a probabilistic subspace-based technique to denoise ultrahigh field 31P-MRSI signals, facilitating volumetric mapping of human brain NAD levels in a nominal resolution of 1.0 cc within 20 minutes at 7T. The evaluation on SNR performance, accuracy of NAD measurement, metabolic tissue heterogeneity, and capability in revealing aging correlation was presented, demonstrating a great promise of the proposed method.
Methods
Signal Modeling and Processing: Based on the partial separability model,9 the 31P-MRSI signals (denoted as $$$\rho(x,t)$$$) reside in a low-dimensional subspace:$$\rho(x,t)=\sum_{l=1}^{L}{u_l(x)v_l(t)}$$
where $$$\left\{{v_l(t)}\right\},\left\{{u_l(x)}\right\}$$$ denote the basis functions and spatial coefficients, respectively. This model significantly reduces the degrees-of-freedom for representing the 31P-MRSI signals. Typical low-rank denoising method simply uses low-rank approximation on the Casorati matrix,10 which may not be sufficient for low-concentration metabolites like NAD.
Here we used a probabilistic subspace model-based method for more effective denoising.11 This model integrated low-rank property with spectral priors, spatial constraints, and statistical constraints. More specifically, the basis functions were pre-determined from the group data;12 the spatial coefficients were assumed to have limited variations and follow contain statistical distributions:
$$\left\|WU\right\|_2^2<\delta,U\sim{Pr(U)}$$
where $$$W$$$ and $$$Pr(U)$$$ are edge-preserved total-variation operator and distribution of $$$U$$$. $$$W$$$ could be derived from the anatomical image, and the density functions were determined from the group data using Gaussian mixture approximation.10 To incorporate these priors, the denoising was performed by solving a regularized optimization problem:
$$\hat{U}= {\mathrm{arg}}\,{\mathrm{min}}_U\left\|{\rho_r-UV}\right\|_2^2+\lambda\left\|{WU}\right\|_2^2-\sigma_n^2\mathrm{log}(Pr(U))$$
where $$$\rho_r$$$ are the matrix form of noisy raw data. $$$\lambda$$$ is the weighting parameter and $$$\sigma_n^2$$$ the variance of noise. With $$$\hat{U}$$$ estimated, the denoised signals were generated as $$$\rho_d=\hat{U}V$$$. After that, the NAD signals were estimated through a time-domain spectral fitting method.
Data Acquisition: In vivo 31P-MRSI data were collected from twelve subjects. These scans were performed on a MAGNETOM 7T system (Siemens Healthcare, Erlangen, Germany) with an investigational 1H/31P dual-tuned birdcage head coil (Rapid Biomedical, Rimpar, Germany), under approval of the local Institutional Review Board. The scan protocol included an MPRAGE sequence and a 3D 31P-CSI sequence (TR/TE = 200/1.0 ms, flip angle = 30°, bandwidth = 5 kHz, FOV = 22×22×10 cm3, matrix size = 24×24×8, nominal voxel size = 1.0 cc, NOE for SNR enhancement, total scan time = 20 minutes).
Results and Discussions
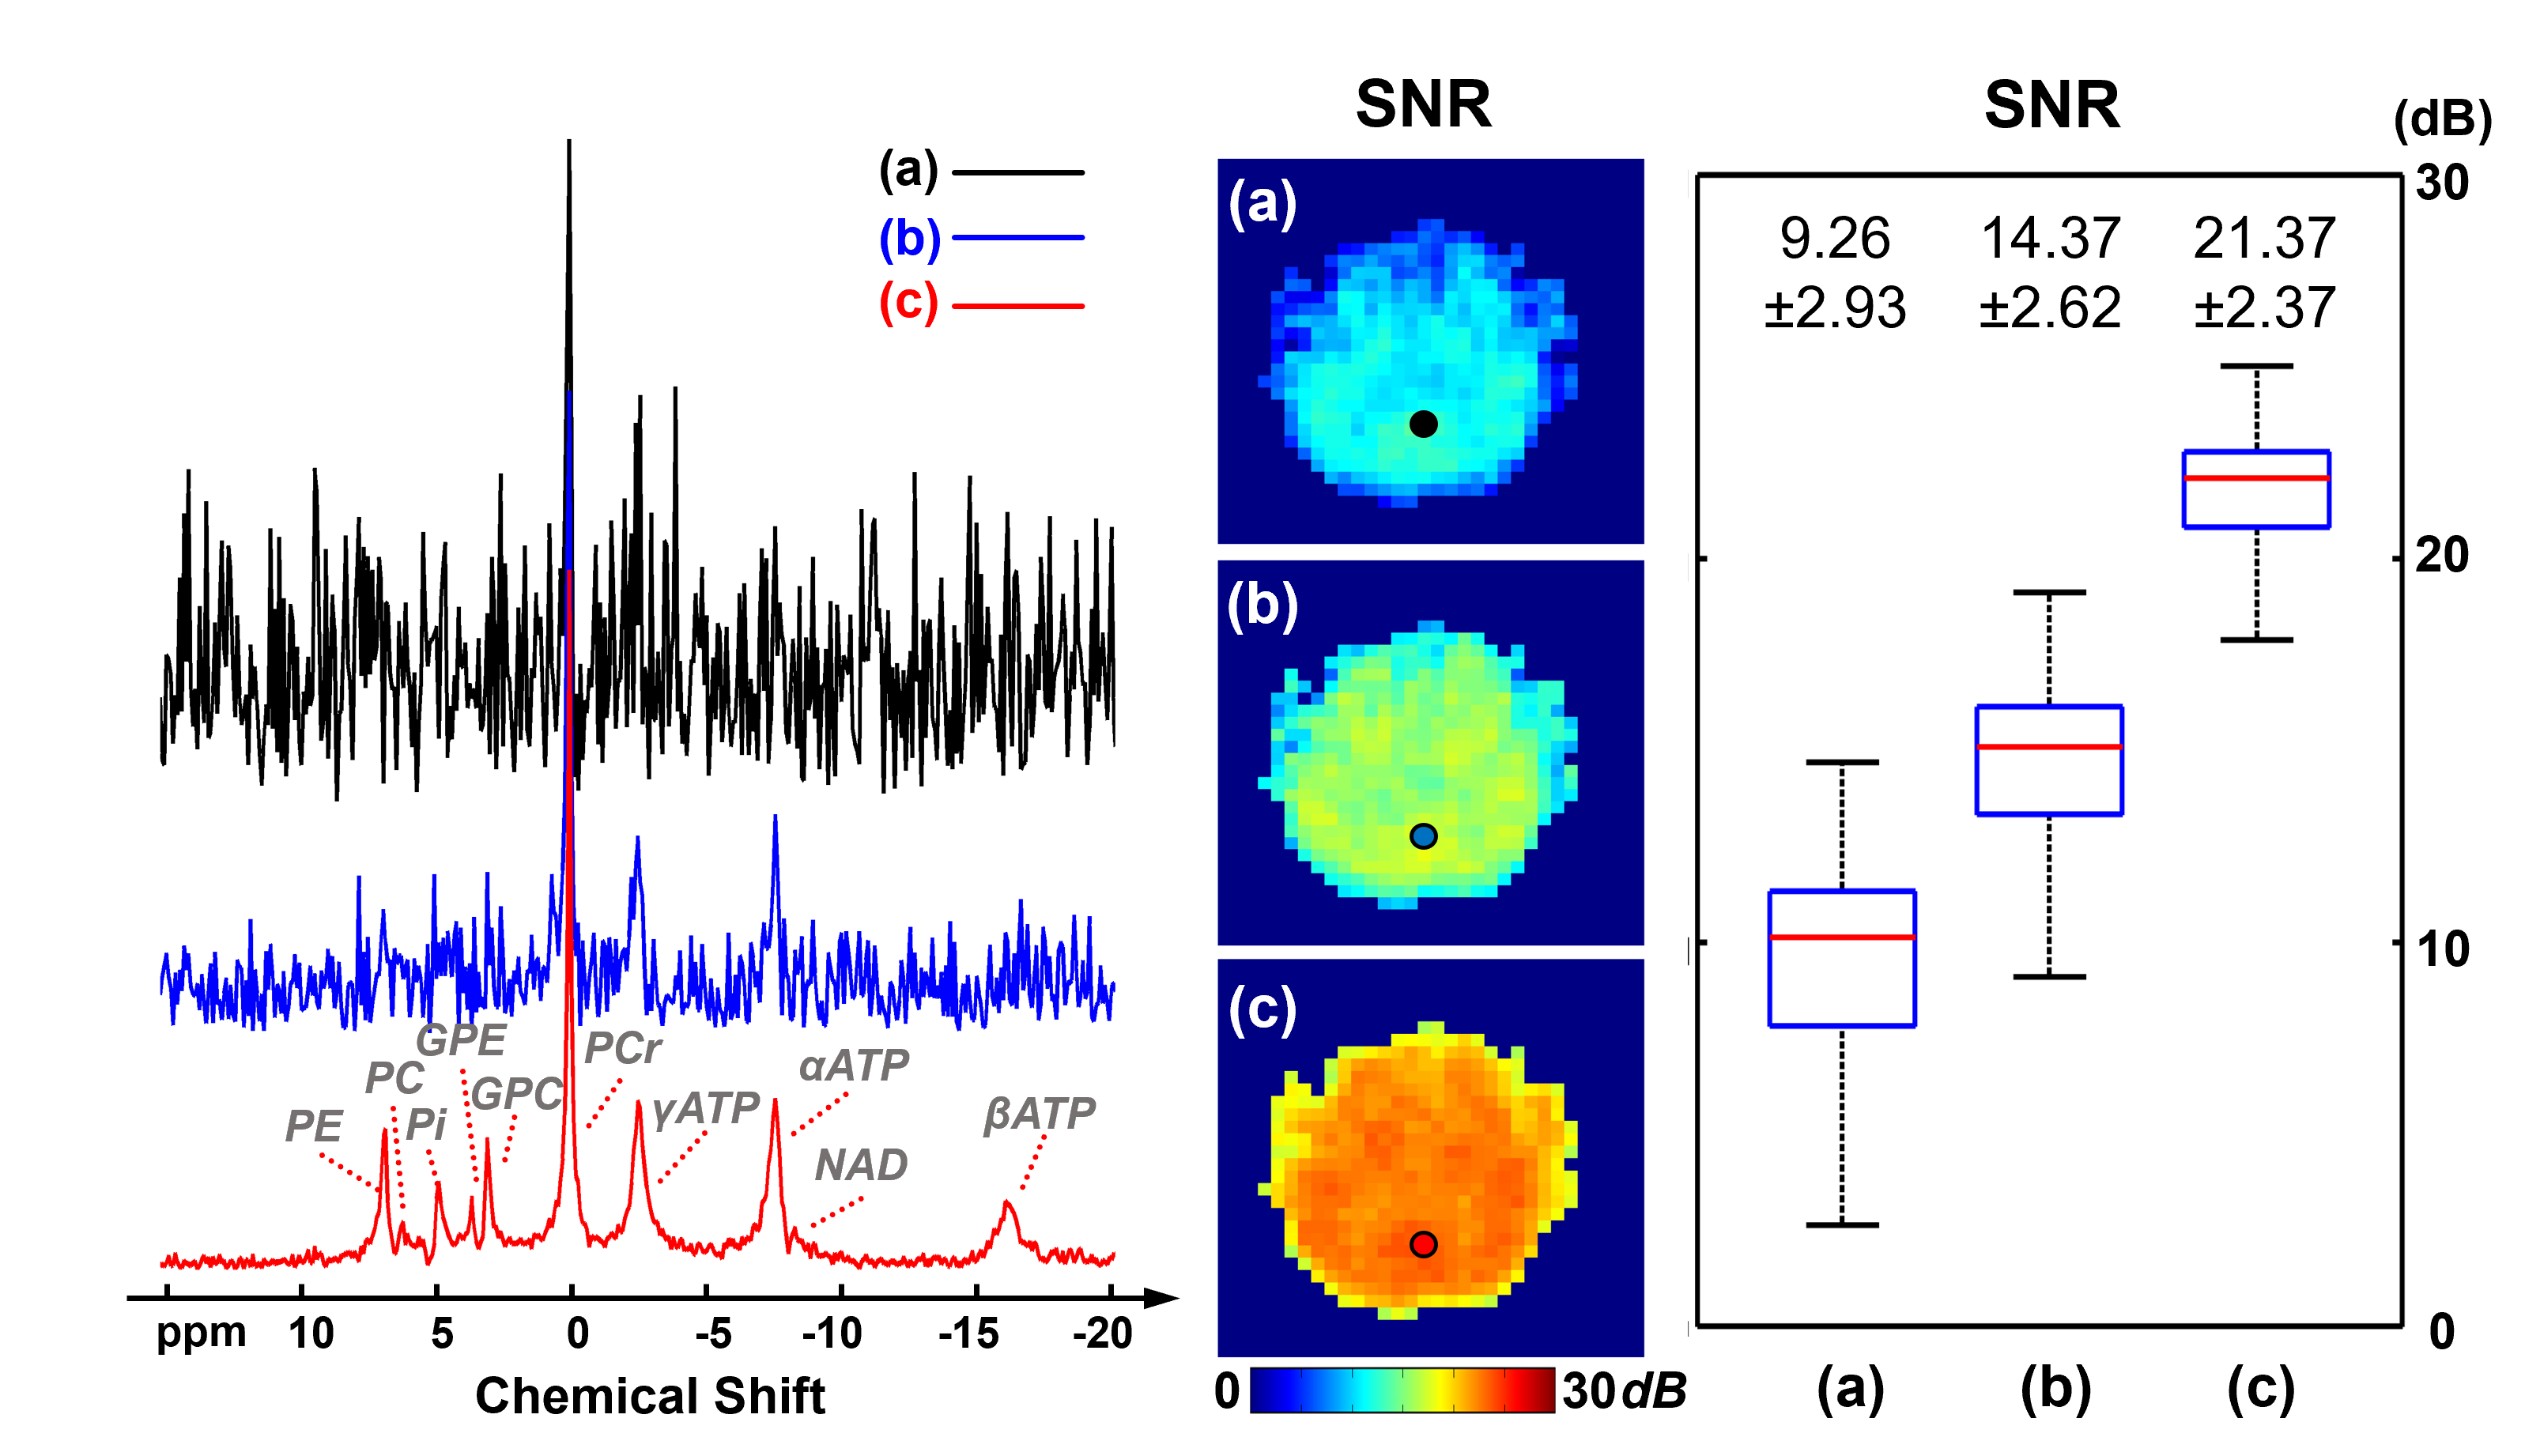
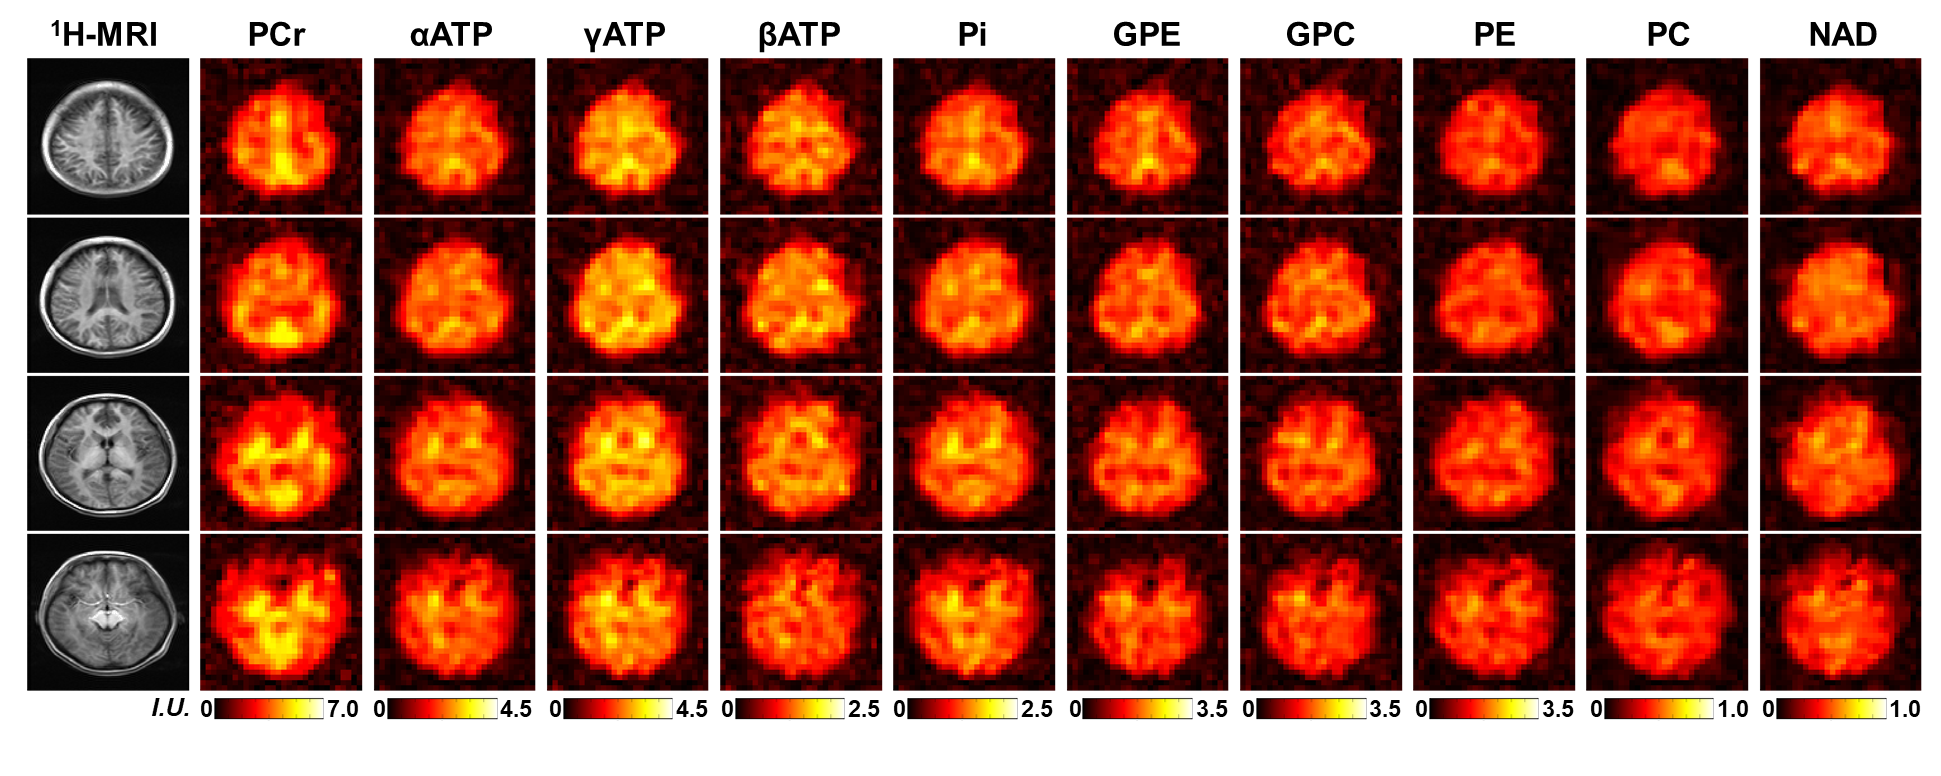
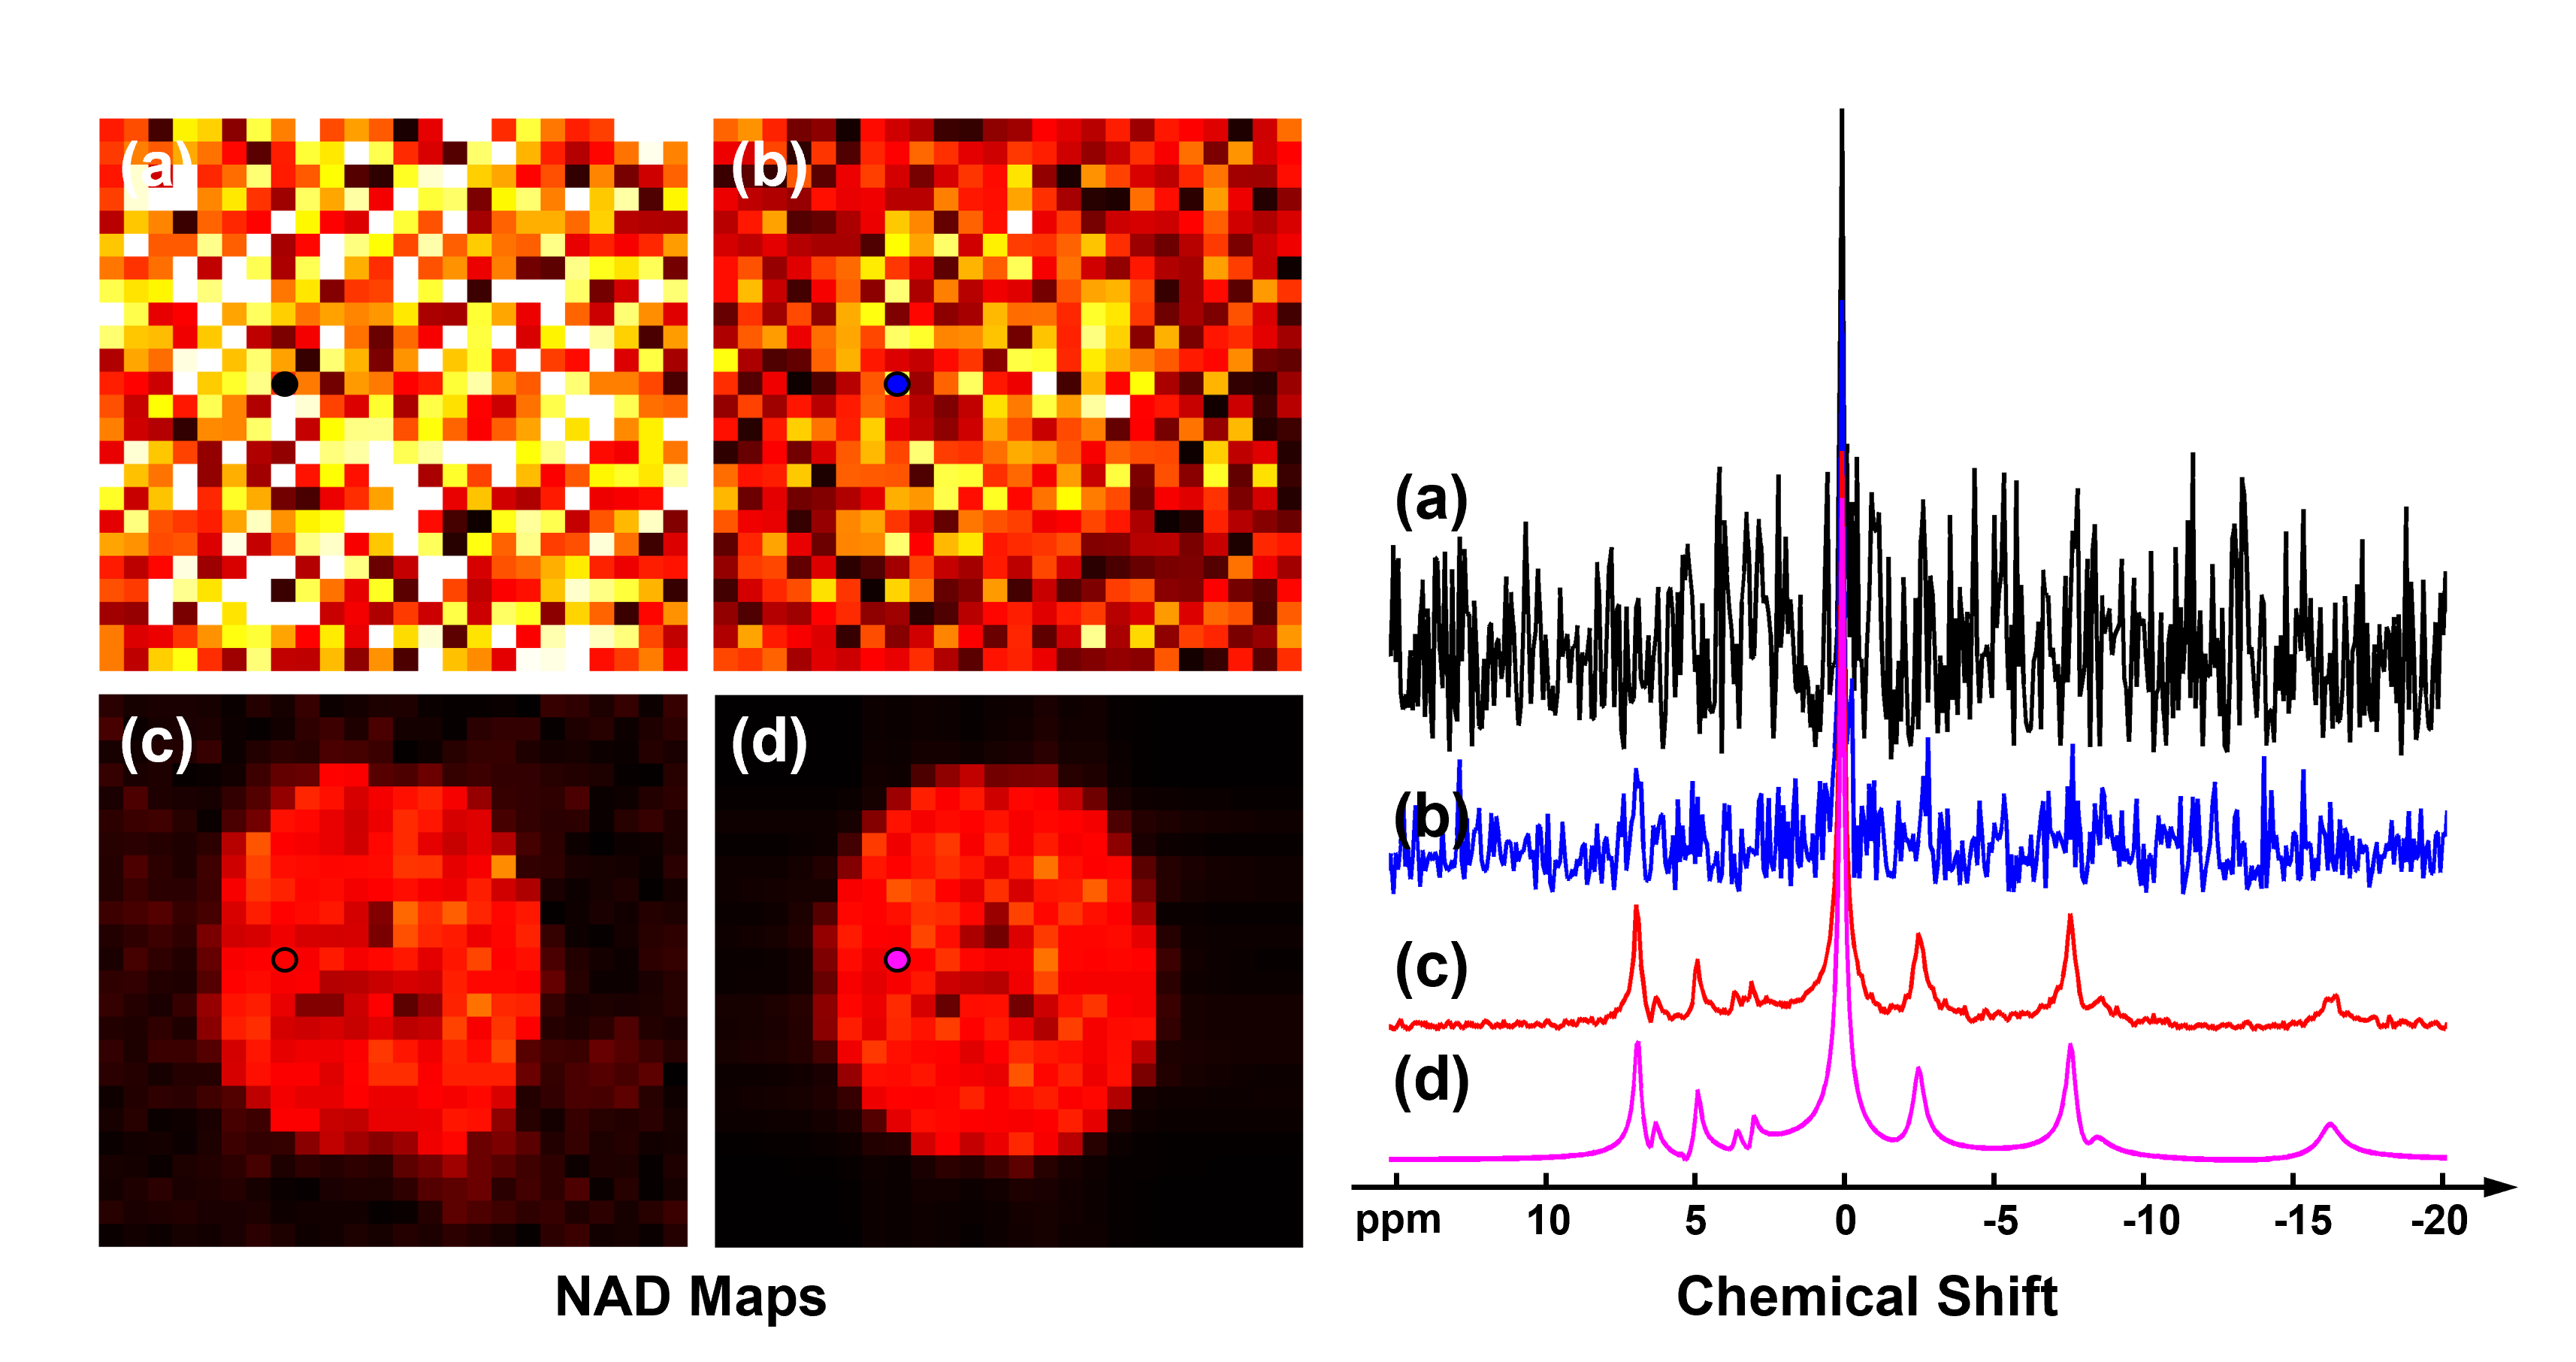
Figure 1 shows a comparison of 31P-MRSI spectra from a representative voxel and SNRs using different processing methods. On the representative spectra, the NAD peak was only visible above noise level after denoising using the proposed method. The SNR maps and boxplots also affirmed the significant SNR improvements. The mean SNRs over the brain were 9.26±2.93, 14.37±2.62, and 21.37±2.37 dB for raw MRSI data, low-rank denoising, and our proposed method, respectively. One complete set of whole-brain metabolite maps, including PCr, ATPs, Pi, GPE, GPC, PE, PC, and NAD, was shown in Figure 2, demonstrating high quality with minor effects of noise.Figure 3 shows results of a computational simulation, comparing spectra and NAD estimates using different processing methods. Consistent with the observations in Figure 1, the NAD map was reasonable only using the proposed method. Quantitatively, rRMSEs of NAD estimates referring to the ground truth were 158.3%, 57.4%, and 14.3% for the raw data, low-rank denoising, and the proposed method, respectively.
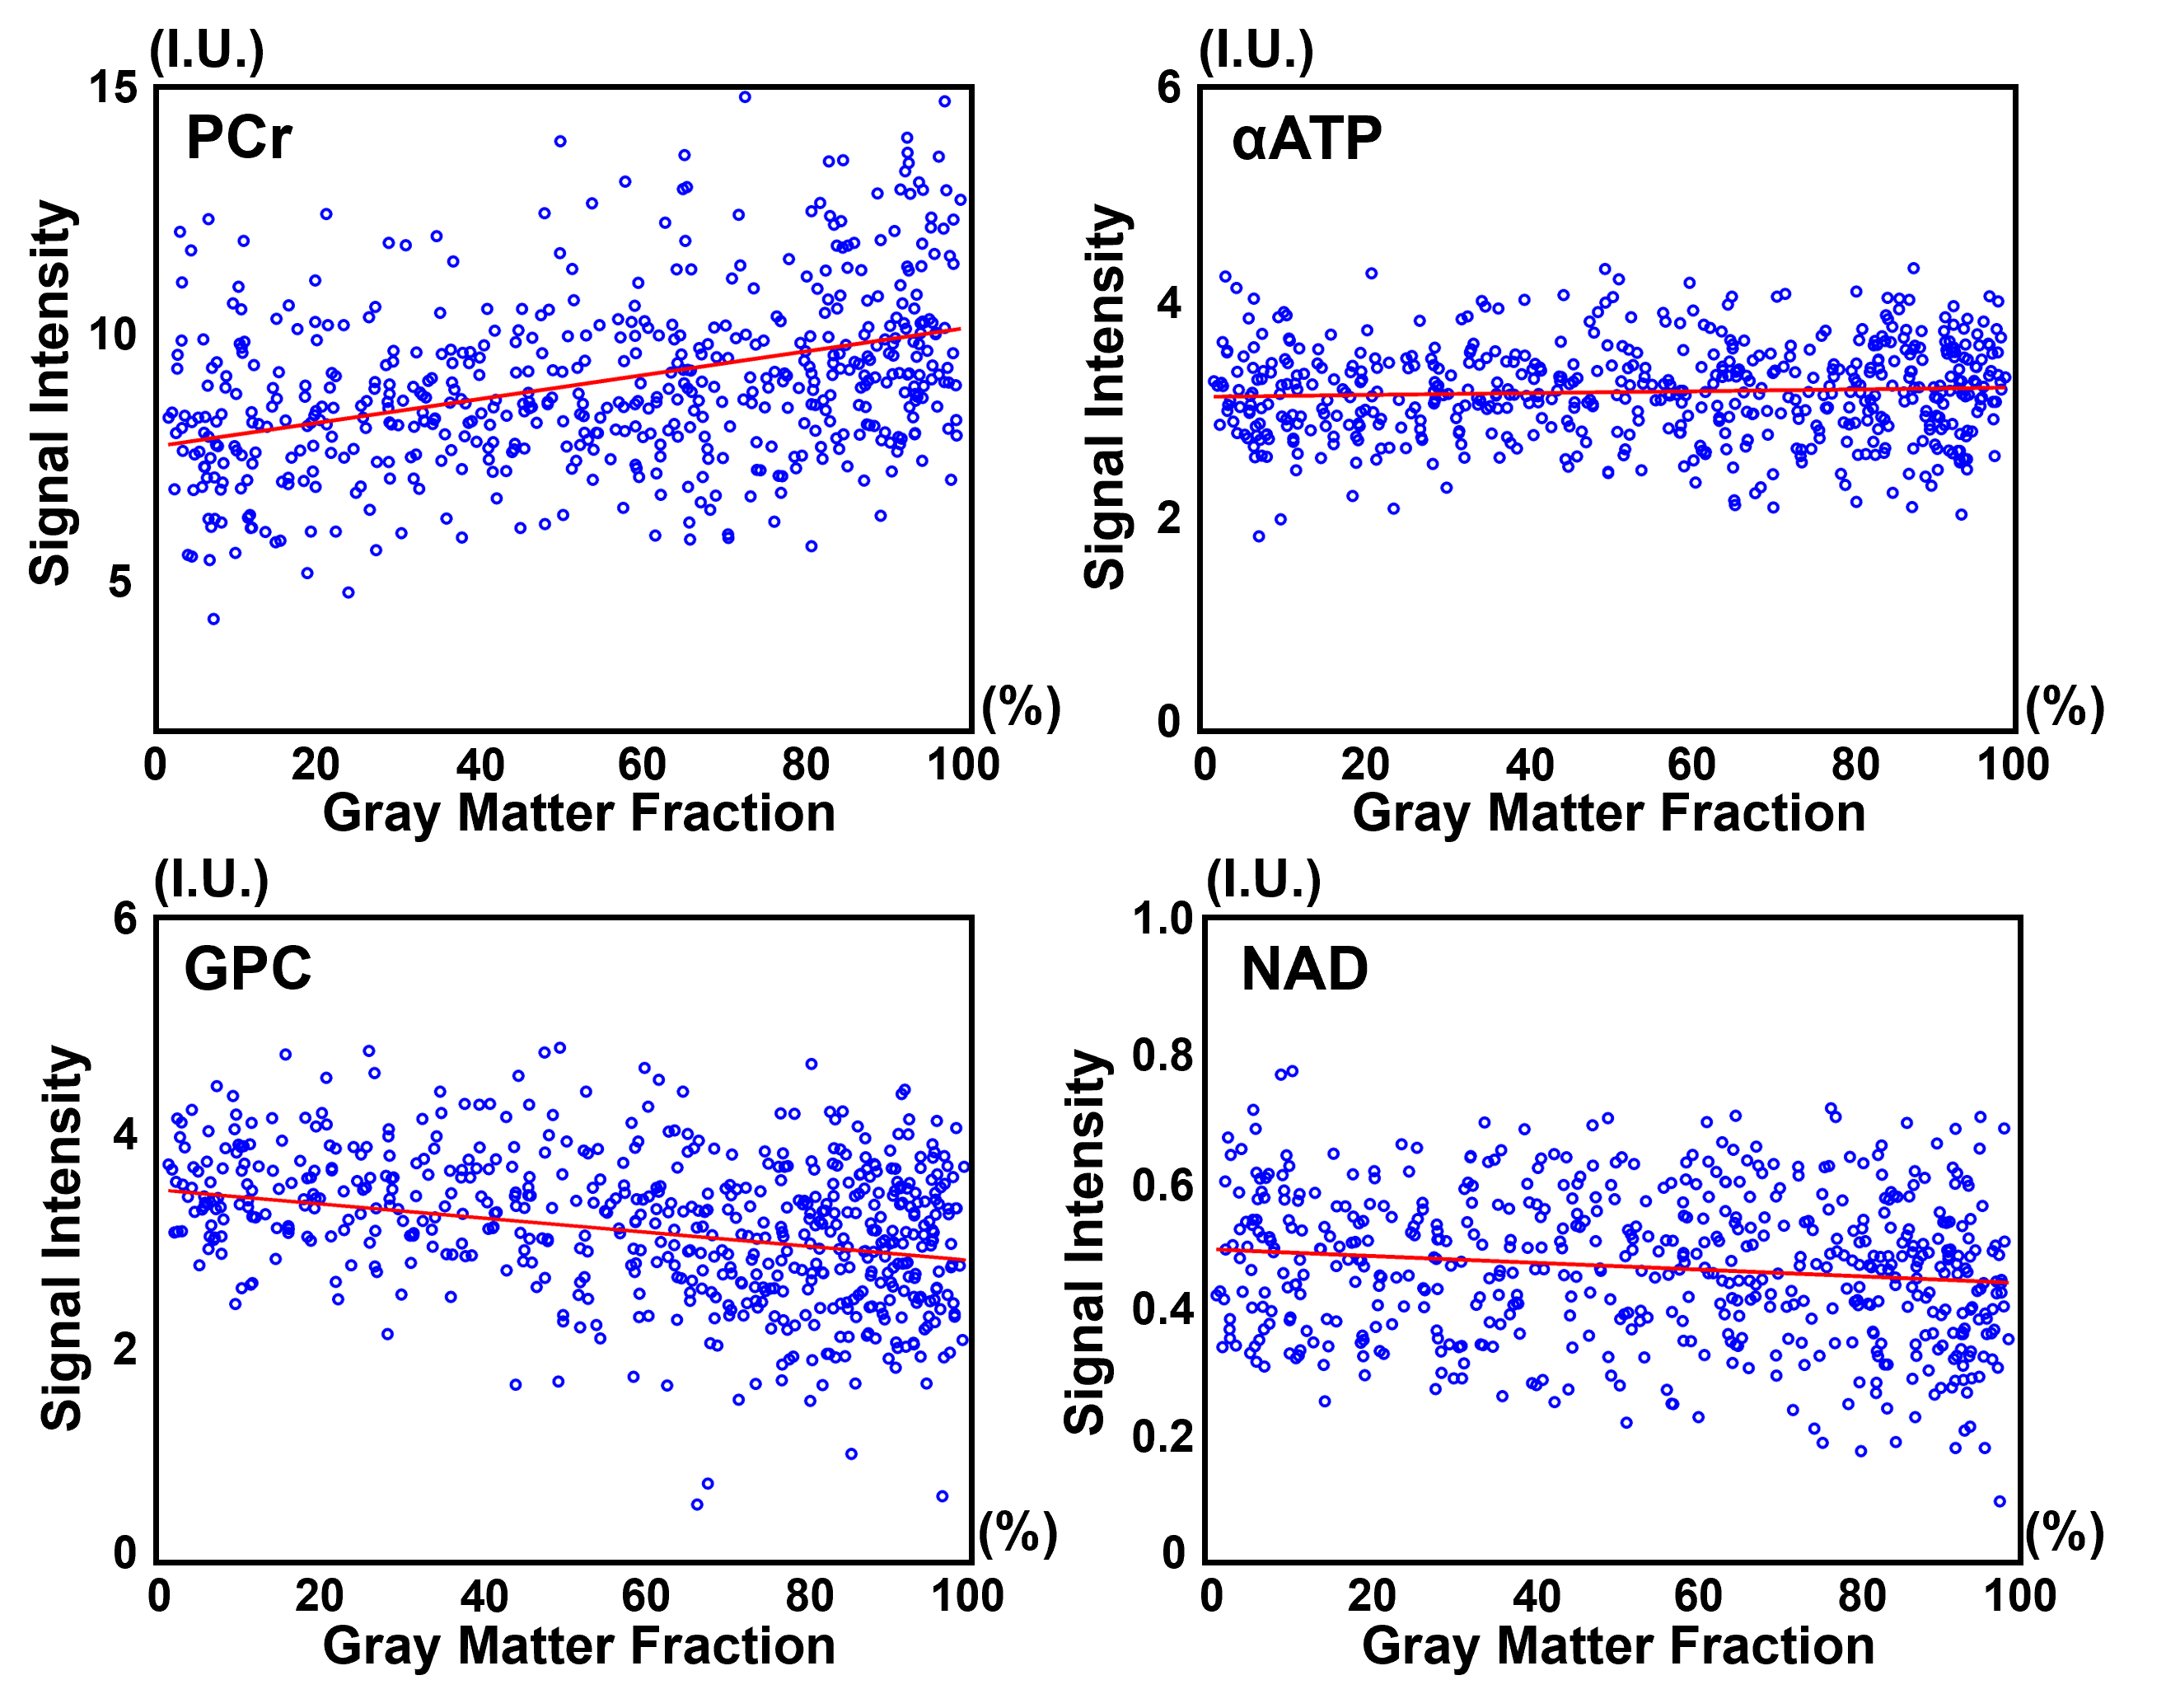
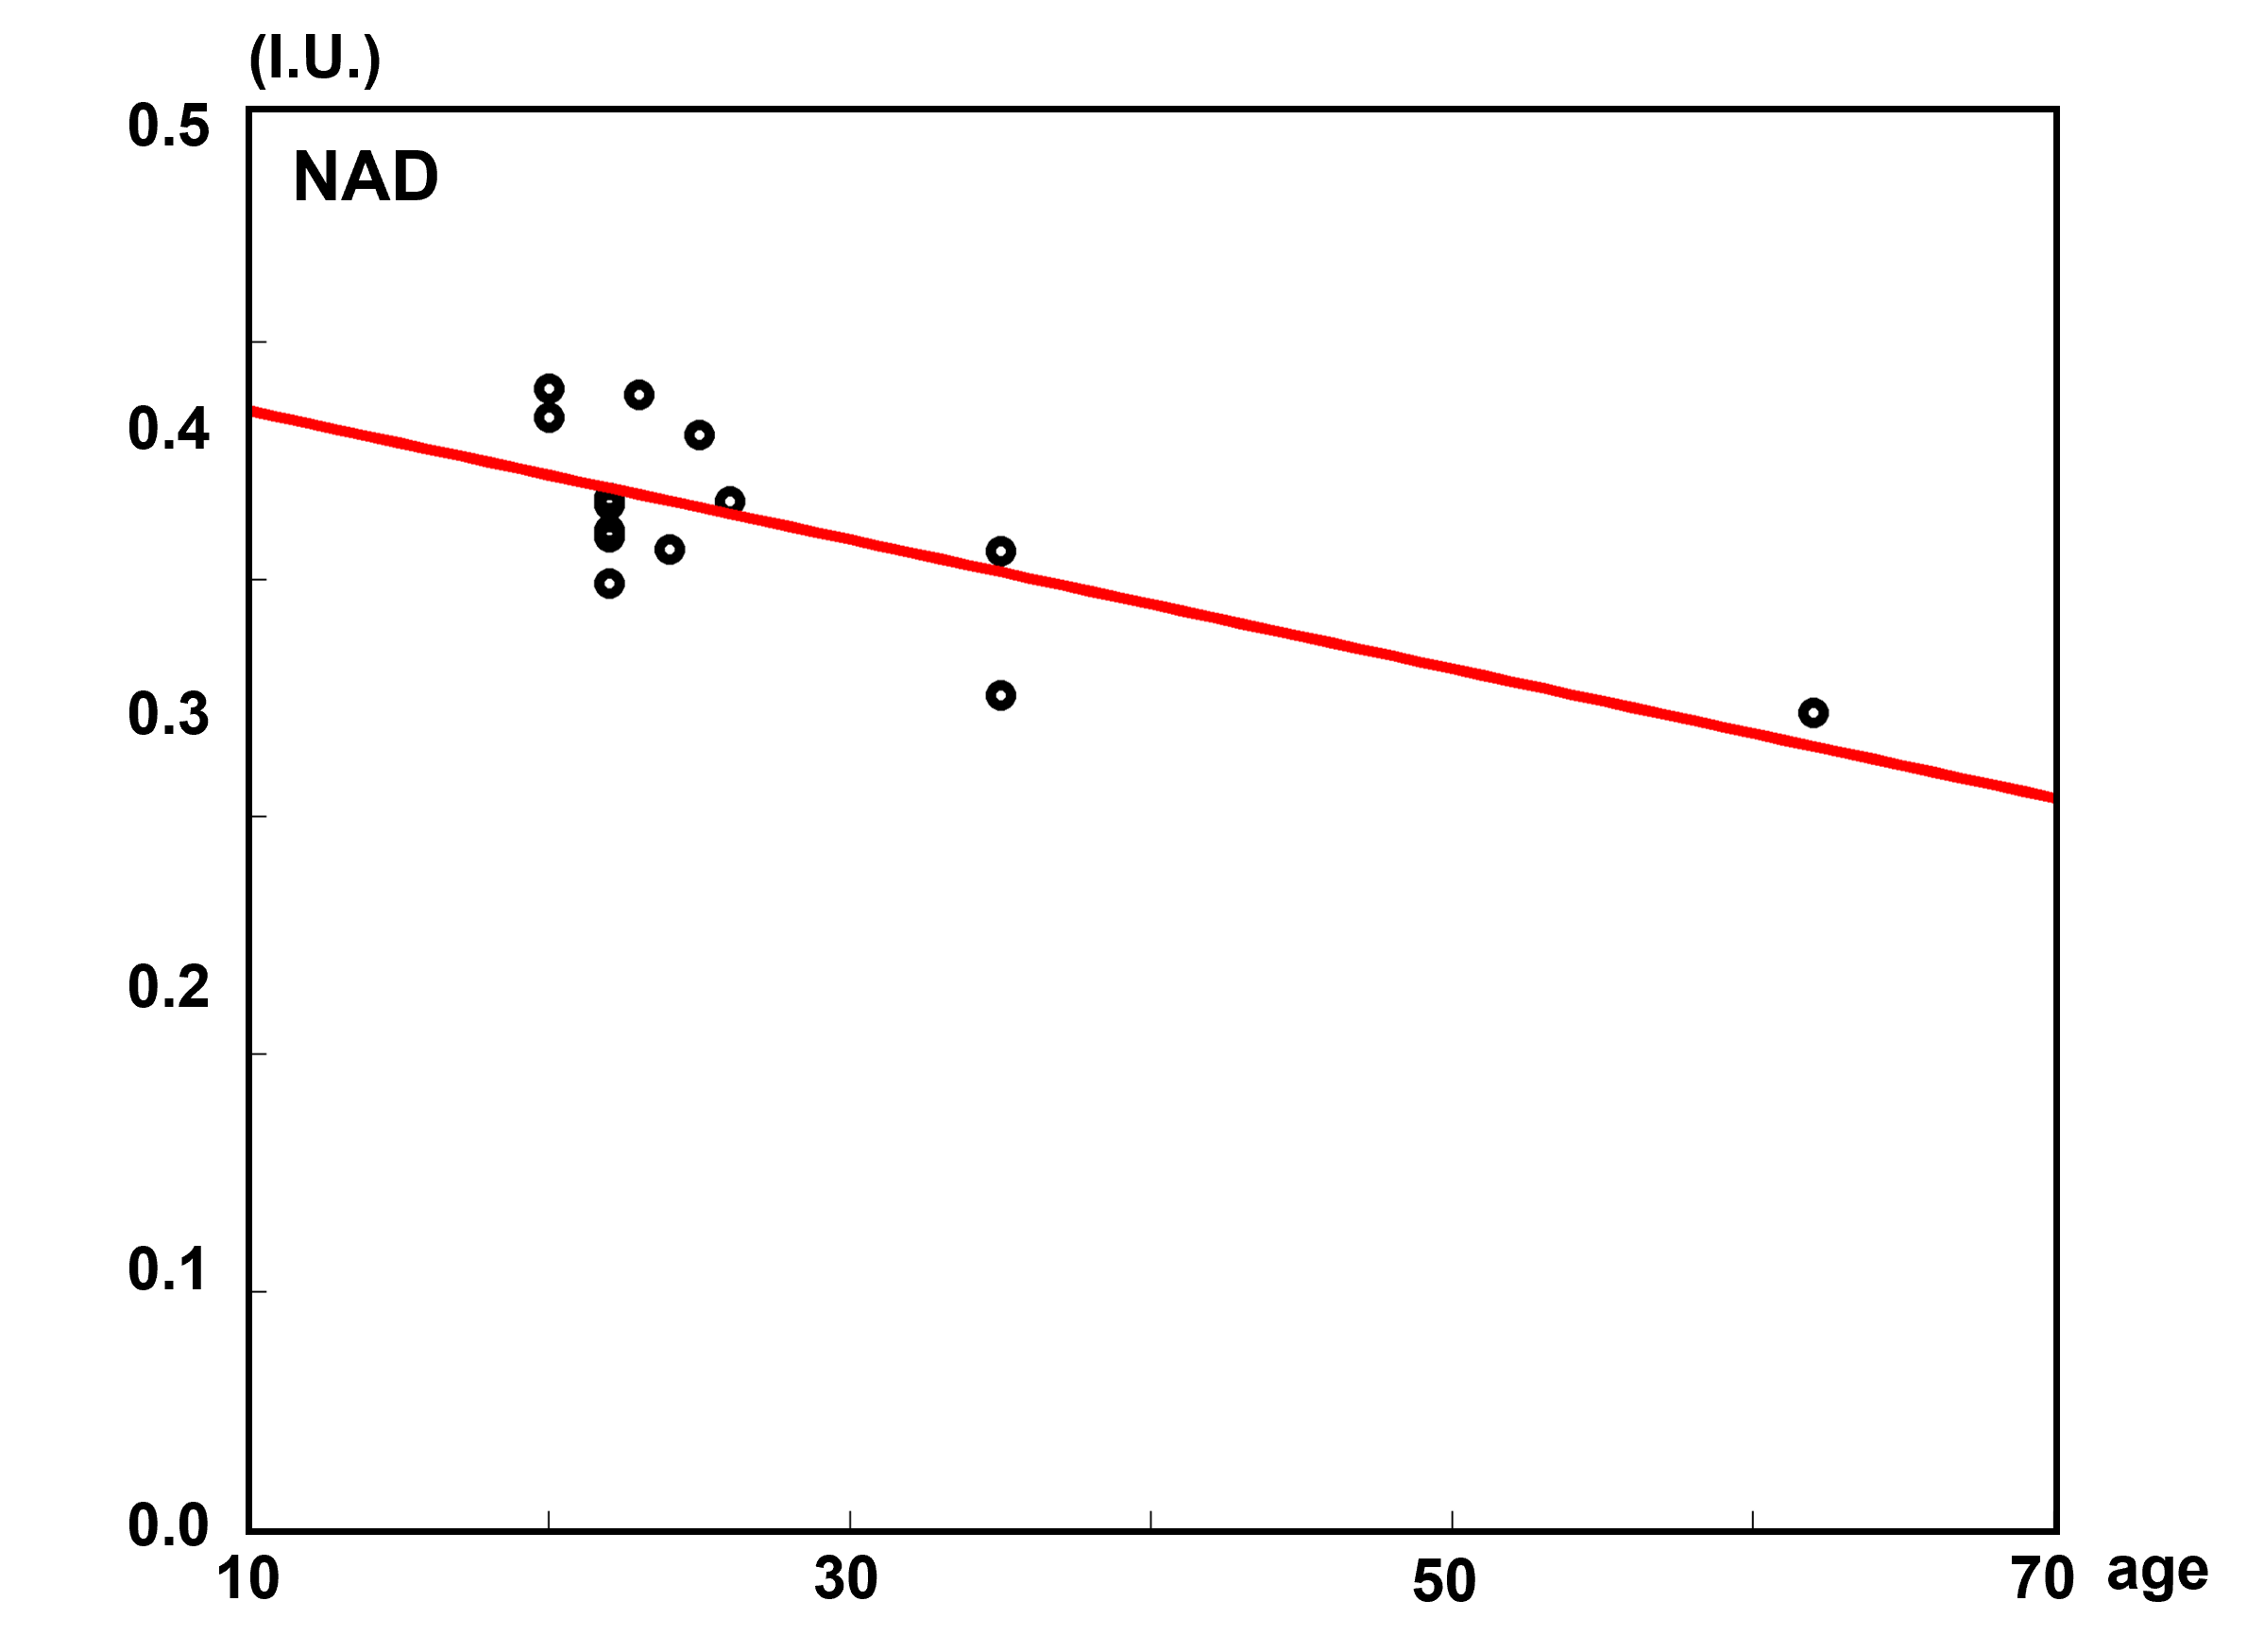
With a nominal 1.0-cc resolution, the potential in mapping metabolic heterogeneity between tissues was examined, as shown in Figure 4. From the regression analysis on the metabolite signals the over gray matter fractions, we can observe that higher gray matter fractions were associated with higher PCr levels, lower GPC levels, while uniform ATP and NAD distributions. Moreover, the overall NAD levels of these subjects were analyzed to correlate with their ages. As illustrated in Figure 5, the overall NAD levels declined with the age increased, which are consistent with the biological expectations and previous studies.5
Conclusion
In conclusion, using a probabilistic subspace-based method, we demonstrated the feasibility of volumetric brain NAD mapping within 20 minutes at 7T. With further development, this may provide a practically useful approach for non-invasively monitoring cerebral NAD distributions and changes under various brain conditions.Acknowledgements
This work reported in this abstract was supported, in part, by the National Institutes of Health (NIH) grants: U01EB026978, R01CA240953, R01 NS133006 and P41 EB027061.References
1. Belenky P, Bogan KL, Brenner C. NAD+ metabolism in health and disease. Trends Biochem Sci. 2007;32(1):12-19.
2. Verdin E. NAD+ in aging, metabolism, and neurodegeneration. Science. 2015;350(6265):1208-1213.
3. Lautrup S, Sinclair DA, Mattson MP, et al. NAD+ in Brain Aging and Neurodegenerative Disorders. Cell Metab. 2019;30(4):630-655.
4. Braidy N, Berg J, Clement J, et al. Role of Nicotinamide Adenine Dinucleotide and Related Precursors as Therapeutic Targets for Age-Related Degenerative Diseases: Rationale, Biochemistry, Pharmacokinetics, and Outcomes. Antioxid Redox Signal. 2019;30(2):251-294.
5. Zhu XH, Lu M, Lee BY, Ugurbil K, Chen W. In vivo NAD assay reveals the intracellular NAD contents and redox state in healthy human brain and their age dependences. Proc Natl Acad Sci U S A. 2015;112(9):2876-2881.
6. Lu M, Zhu XH, Zhang Y, Chen W. Intracellular redox state revealed by in vivo 31P MRS measurement of NAD+ and NADH contents in brains. Magn Reson Med. 2014;71(6):1959-1972.
7. Santos-Díaz A, Noseworthy MD. Phosphorus magnetic resonance spectroscopy and imaging (31P-MRS/MRSI) as a window to brain and muscle metabolism: A review of the methods. Biomed Signal Process Control. 2020;60:101967.
8. Zhu XH, Guo R, Wiesner HM, et al. Feasibility of mapping intracellular NAD content in entire human nrain at 7T, Proc. Intl. Soc. Magn. Reson. Med., 2023:5899.
9. Liang ZP. Spatiotemporal imaging with partially separable functions. In: Proc. of 4th IEEE ISBI. 2007:988-991.
10. Nguyen HM, Peng X, Do MN, Liang ZP. Denoising MR spectroscopic imaging data with low-rank approximations. IEEE Trans Biomed Eng. 2013;60(1):78-89.
11. Li Y, Xiong J, Guo R, Zhao Y, Li Y, Liang ZP. Improved estimation of myelin water fractions with learned parameter distributions. Magn Reson Med. 2021;86(5): 2795-2809.
12. Lam F, Li Y, Guo R, Clifford B, Liang ZP. Ultrafast magnetic resonance spectroscopic imaging using SPICE with learned subspaces. Magn Reson Med. 2020;83(2):377-390.
Figures