0929
Validation of High Spatial Resolution 23Na Imaging of the Skin1Sir Peter Mansfield Imaging Centre, University of Nottingham, Nottingham, United Kingdom
Synopsis
Keywords: Non-Proton, Non-Proton, skin
Motivation: The storage of sodium in the skin is thought to be a physiologically important regulatory mechanism for blood pressure, volume regulation, and to change with age, hypertension and disease such as renal and cardiovascular disease.
Goal(s): To image the skin at higher spatial resolution for improved estimation of skin sodium quantification.
Approach: To develop a dual-tuned 23Na/1H skin coil to image a skin ‘phantom’ and the skin in-vivo. To apply a B1-mapping correction and use the skin ‘phantom’ to validate methods, and study the effects of spatial resolution on skin sodium measures.
Results: High resolution skin sodium imaging was achieved, improving 23Na quantification.
Impact: Improved spatial resolution of sodium imaging measures of the skin will provide improved assessment of quantification of skin sodium to study the effects of age, ethnicity and disease.
Introduction
The storage of sodium in the skin has been shown to be a physiologically important regulatory mechanism for blood pressure, volume regulation, with an increase shown with age and hypertension1,2, as well as in patients with renal3,4 and cardiovascular disease5. The capability to perform robust sodium quantification in the skin in vivo will enable testing of treatments aimed at reducing sodium content in skin. However, the skin layer is thin, <2 mm, making imaging with standard coils difficult. Here we develop a dual-tuned 1H/23Na coil to image both sodium and water to study the skin at high spatial resolution, and test this on a ‘skin phantom’, and in healthy subjects to study sodium quantification.Methods
Acquisition: A dual-tuned 23Na/1H surface coil was developed for high resolution imaging of the skin on a 3T Phillips Achieva scanner. Specific absorption rate (SAR) simulations and assessment of RF power deposition of the coil were performed to meet the safety requirements and assess the simulated sensitivity field. The surface coil was placed on a support with reference tubes of four sodium concentrations (15, 30, 45, 60 mmol/L) below. To establish the B1 field of the surface coil, B1 maps were collected on a uniform phantom of 50 mmol/L sodium using a 3D gradient echo (GRE) scheme of 1.5 x 1.5 x 10 mm3 spatial resolution which collected images across a flip angle sweep (TE/TR = 2/100 ms, 0 – 140o in 10o steps, and 160 - 220 in 20o steps).A ‘skin phantom’ was made comprising agar of approximately 3 mm thick and sodium concentration 50 mmol/L to mimic skin tissue, with 25 mmol/L sodium to mimic muscle, and a layer of lard of varied thickness at its minimum 3 mm to represent subcutaneous fat. 23Na images were acquired on the skin phantom using a 3D GRE scheme of 1.5 x 1.5 x 10 mm3 spatial resolution, and 1H images were collected using a 3D T1-weighted scheme at 0.18 x 0.18 x 2 mm3.
In-vivo data was collected on the calf of six participants (age 20–28 years) using matched 23Na and 1H protocols to those used on the ‘skin phantom’, in addition a 1H mDIXON scan also collect to aid visualisation of the skin and vasculature. Skin phantom and in vivo 23Na measures were also collected at spatial resolutions of 1 x 2.25 x 10 mm3 and a ‘pancake’ of 0.75 x 3 x 10 mm3 as performed by Zhu et al.6.
Analysis: The 23Na images were B1 corrected using both a sensitivity image and the B1 map from the multiple flip angle data. Data was converted to total sodium concentration (TSC) using a regression line computed across the reference tube concentrations.
Results
Figure 1 shows the skin phantom and the simulated 23Na/1H surface coil field patterns. Figure 2 shows multiple flip angle 23Na data collected on the uniform phantom together with the resultant B1 map, which is used to correct the 23Na ‘skin phantom’ and in-vivo images shown in Figures 3 and 4. Figure 3 shows the sensitivity and B1 map corrected 23Na image of the ‘skin phantom’ at 1.5 x 1.5 x 10 mm3, this resulted in a measured value of 50 ± 20 mmol/L for the skin agar layer. Figure 4 shows an example 23Na image and sensitivity and B1 map correction of the skin layer in a healthy subject at 1.5 x 1.5 x 10 mm3. Figure 5 shows example 23Na ‘skin phantom’ and in vivo images at each spatial resolution quantified using the B1 mapping correction. Applying B1 correction of in-vivo data led to skin sodium measures of 8-24 mmol/L across subjects from the 1.5 x 1.5 x 10 mm3 data. Collecting 23Na images at higher in-plane resolution increased the measured sodium to 17-35 mmol/L at 0.75 x 3 x 10 mm3.Discussion
This work has demonstrated that the ‘skin phantom’ is a useful tool to assess quantification of skin sodium, with B1 mapping improving estimation. Further work will be performed to produce a phantom with thinner skin layers. The dual-tuned 23Na/1H surface coil provides high sensitivity within a range of 10 mm from its surface allowing spatial resolution imaging of human skin, enabling better separation of the skin’s 23Na signal than the volume birdcage coil.Conclusion
In future, segmentation of the 1H images into tissue types will be used to correct for partial volume effects. These methods will be useful to study changes in sodium levels in the skin across age and ethnicity.Acknowledgements
Matthew Clemence, Philips Healthcare Clinical Science is acknowledged for their support. Theodora Slater is funded through a BBSRC Case studentship with Unilever.References
1. C. Kopp et al., “23Na magnetic resonance imaging of tissue sodium,” Hypertension, vol. 59, no. 1, pp. 167–172, 2012.
2. C. Ott et al., “Impact of renal denervation on tissue Na+ content in treatment-resistant hypertension,” Clin. Res. Cardiol., vol. 107, no. 1, pp. 42–48, Jan. 2018.
3. P. Schneider et al., “Skin sodium concentration correlates with left ventricular hypertrophy in CKD,” J. Am. Soc. Nephrol., vol. 28, no. 6, pp. 1867–1876, Feb. 2017.
4. A. Dahlmann et al., “Magnetic resonance-determined sodium removal from tissue stores in hemodialysis patients.,” Kidney Int., vol. 87, no. 2, pp. 434–41, 2015.
5. Jens Titze and Friedrich C. Luft. “Speculations on salt and the genesis of arterial hypertension”. Kidney International, 91(6):1324–1335, 6 2017
6. Jinxuan Zhu et al.,”Skin Sodium Concentration is Elevated with Aging but Relative Change Depends on Spatial Resolution of 23Na MRI”. MR Imaging of X‐Nuclei (23Na & Friends): From Controversies to Potential Clinical Applications, Part II, 2023.
Figures
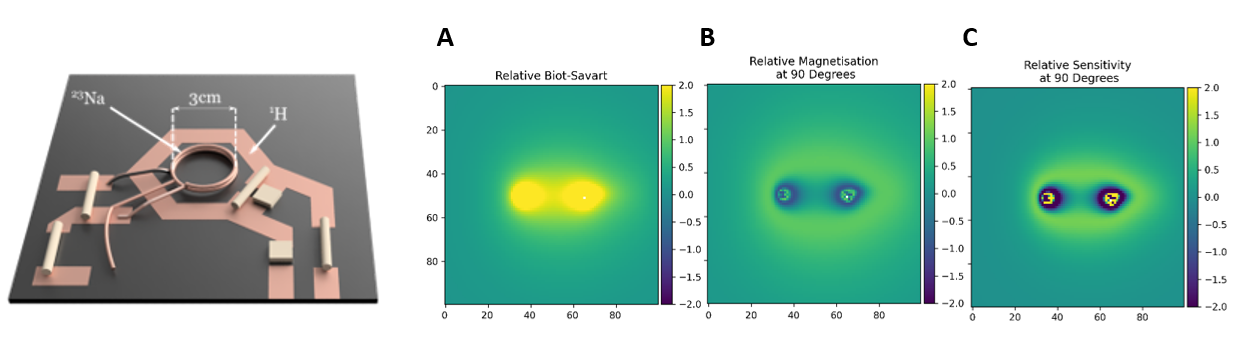
Figure 1: 3D render of the 23Na/1H surface coil for high resolution imaging of the skin. Centre slice of simulated maps showing: (A) Relative Biot-Savart calculation, (B) Relative magnetisation of a 90˚ flip angle applied to a voxel 10 cm above and in the centre of the coil, and (C) Relative sensitivity of the region around the coil with respect to a voxel 10 cm above the coil in the centre.
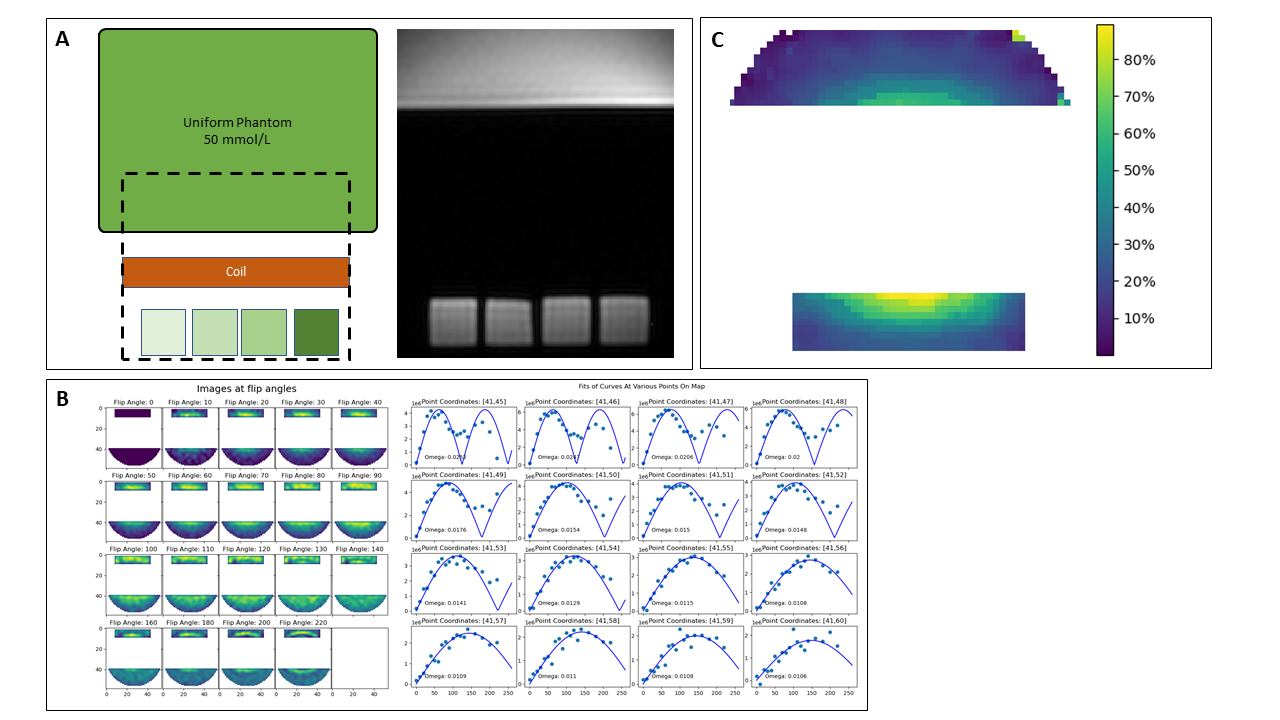
Figure 2: (A) Schematic of uniform phantom, placement of coil and reference tubes and associated 1H image. (B) 23Na images across the flip angle sweep and signal from example voxels showing fit to compute B1 map, with the expected profile of locations closer to the coil receiving a greater flip angle than those further away. (C) B1 map of % of nominal flip angle.
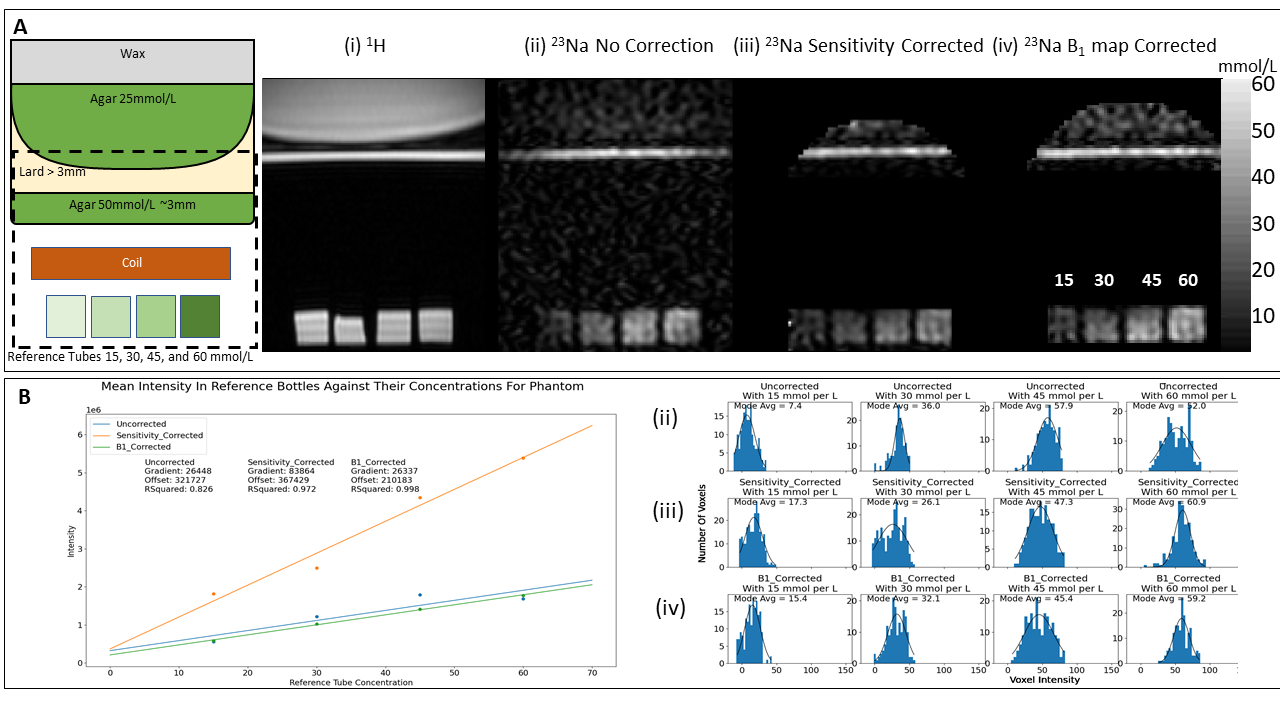
Figure 3: (A) Schematic of ‘skin phantom’, and ‘skin phantom’ data showing (i) 1H T1-weighted image, (ii) 23Na image uncorrected, (iii) 23Na image following calibration using the reference tubes using simple sensitivity map, and (iv) 23Na image following calibration using the reference tubes using B1 map. (B) Calibration of the reference tubes for (ii), (iii) and (iv) and associated histograms of signals in the reference tubes.
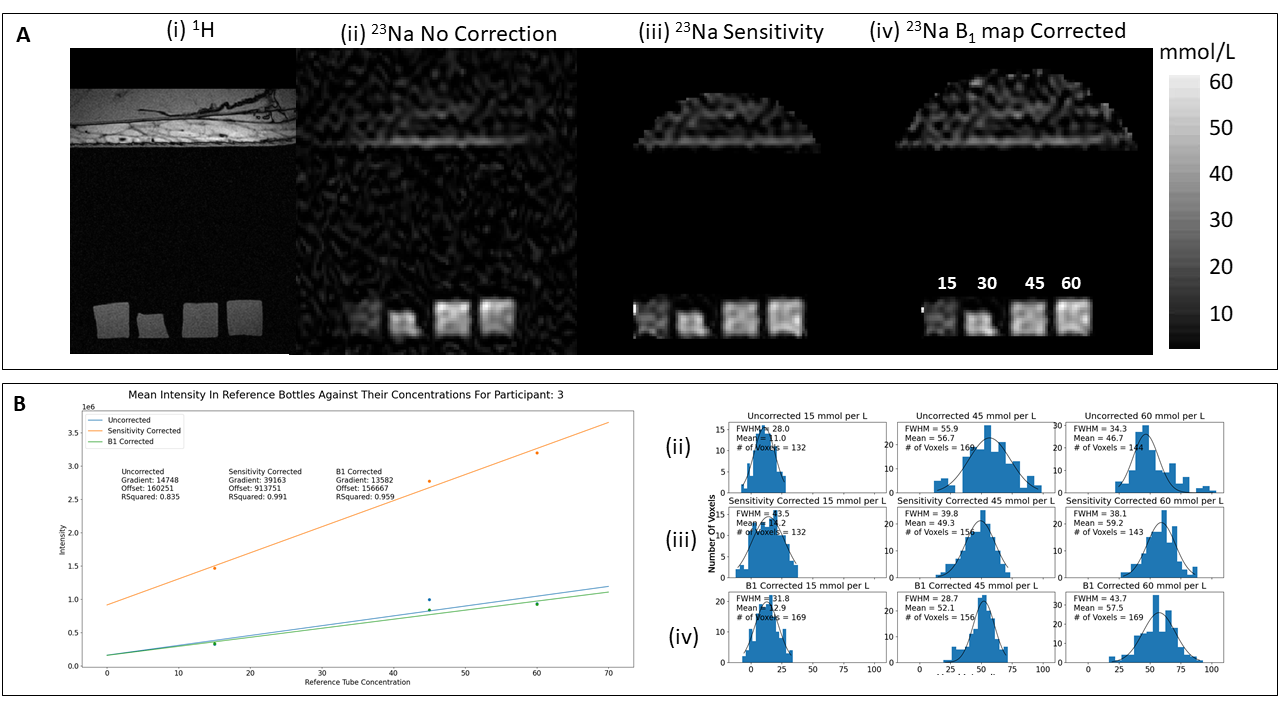
Figure 4: (A) In-vivo data from an example healthy subject showing (i) 1H mDIXON image collected with the surface coil showing the skin layer and vasculature, (ii) 23Na image uncorrected, (iii) 23Na image following calibration using the reference tubes using simple sensitivity map, and (iv) 23Na image following calibration using the reference tubes using B1 map. (B) Calibration of the reference tubes for (ii), (iii) and (iv) and associated histograms of signals in the reference tubes. Note the 30 mmol/L tube has been ignored due to shrinkage.
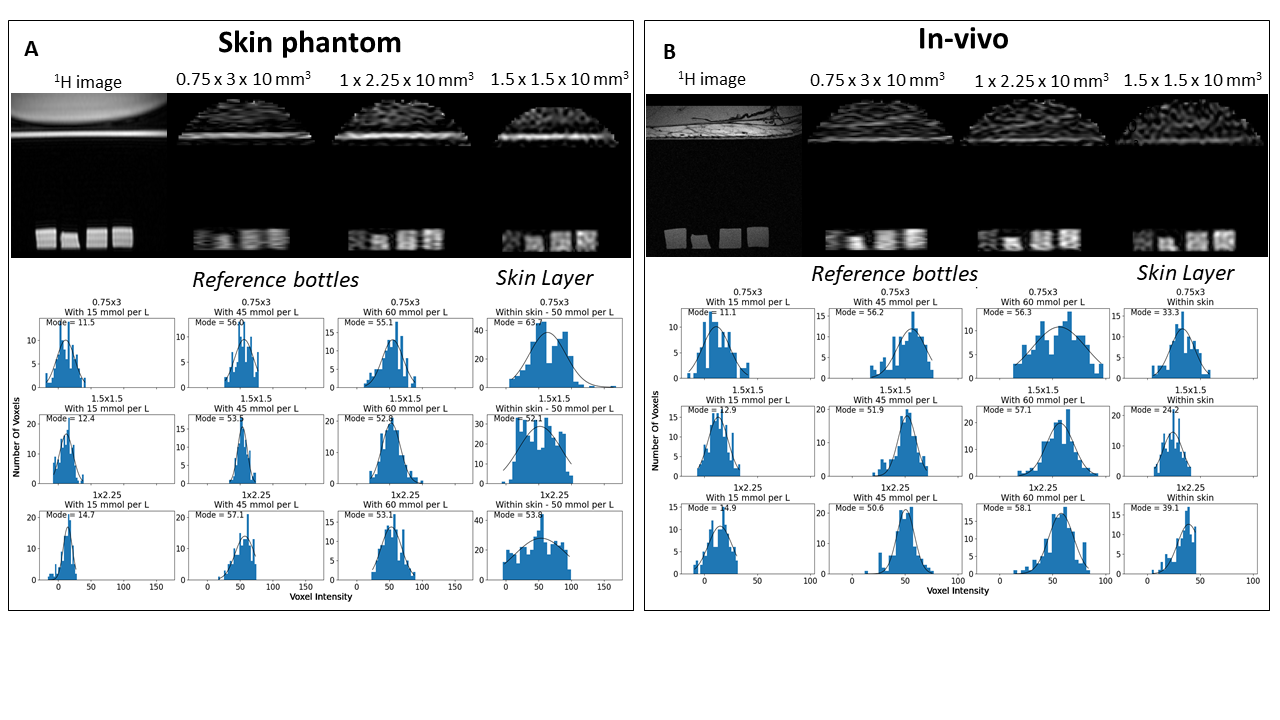
Figure 5: (A) ‘Skin phantom’ data collected at 0.75 x 3 x 10 mm3, 1 x 2.25 x 10 mm3, and 1.5 x 1.5 x 10 mm3 spatial resolutions. (B) In-vivo data from an example healthy subject at each spatial resolution.