0927
Simultaneous 1H MRF / 23Na MRI in knee cartilage at 7 T1Bernard and Irene Schwartz Center for Biomedical Imaging, Department of Radiology, New York University Grossman School of Medicine, New York, NY, United States, 2Center for Advanced Imaging Innovation and Research (CAI2R), Department of Radiology, New York University Grossman School of Medicine, New York, NY, United States, 3Pelham Memorial High School, Pelham, NY, United States, 4NMR Signal Enhancement, Max Planck for Multidisciplinary Sciences, Göttingen, Germany
Synopsis
Keywords: Non-Proton, Non-Proton
Motivation: Sodium MRI can provide tissue sodium concentration (TSC) and enable assessment of knee cartilage degradation.
Goal(s): We aim to quantify TSC, proton density (PD) and 1H T1 and T2 in the knee from multinuclear simultaneous acquisition.
Approach: We acquired 23Na-only FLORET and simultaneous 1H MRF/23Na MRI data in the knee of four healthy volunteers. We calculated TSC maps from both 23Na acquisitions for comparison, and PD, T1 and T2 maps from 1H MRF.
Results: Mean TSC in patellar and femorotibial cartilage, and gastrocnemius muscle showed no significant differences between both sodium acquisitions. Mean TSC, PD, T1 and T2 values were within previously-reported range.
Impact: We showed that a 3D simultaneous 1H MRF/23Na MRI acquisition at 7 T can provide reliable quantitative maps of TSC, PD, and 1H T1 and T2 relaxation times in cartilage.
Introduction
Quantitative sodium MRI provides tissue sodium concentration (TSC), changes of which have been linked to various pathologies in brain, muscle or cartilage, among others [1,2,3]. Sodium MRI could benefit from being acquired simultaneously with 1H MRI in terms of image coregistration and measurement time [4,5]. Magnetic resonance fingerprinting (MRF) enables simultaneous quantification of multiple tissue properties, such as proton density and relaxation times [6], with a single MR sequence.Proteoglycans are a crucial component of articular cartilage and loss thereof is an early sign of osteoarthritis. A linear relationship between TSC and proteoglycan concentration in knee cartilage has been observed [7,8]. Thus, TSC quantification in cartilage might enable assessment of cartilage degradation in osteoarthritis [9,10,11]. Additionally, changes in 1H relaxation times (T1, T2) have also been associated with changes in the knee cartilage with aging [12] and osteoarthritis [13,14,15].
We suggest using a recently-developed multinuclear fingerprinting (MNF) sequence that acquires 1H MRF / 23Na MRI data simultaneously [4,5,16] to quantify TSC, proton density (PD) and 1H T1- and T2 relaxation times in the knee region. In this pilot study, we measured T1, T2, PD and TSC in multiple regions-of-interest (ROIs) within cartilage and the gastrocnemius muscle (GNM) in 4 healthy subjects, and compared the TSC measurements with standard FLORET 23Na acquisition.
Methods
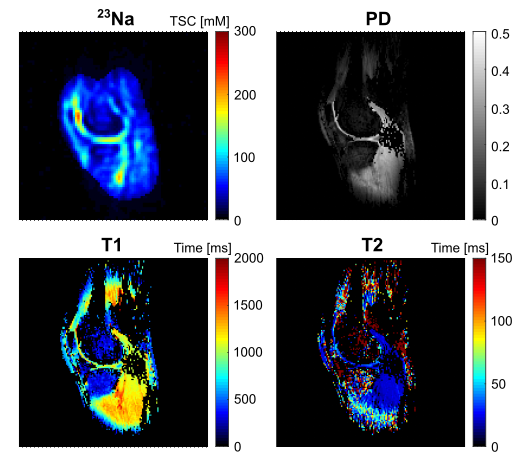
We acquired 1H and 23Na MR data in the right knee of four healthy volunteers (two males, mean age: 27±3 years) at 7 T (Siemens Magnetom scanner) using an in-house built dual-tuned 1H/23Na knee coil with four 1H channels and eight 23Na channels.The protocol included one 23Na-only FLORET sequence [17] (TR/TE = 120/0.2 ms, isotropic resolution = 2.3×2.3×2.3 mm3, FoV = 300 mm3, TA = 9:30 min) and one 3D simultaneous 1H MRF / 23Na MRI sequence [4,5] (MNF, TR/TE = 15/1.2ms, FoV = 240×240 mm2, in-plane resolution 1H = 1.5×1.5 mm2, resolution 23Na = 2.84×2.84 mm2, slice thickness = 5.0 mm, 9 shots, TA = 21 min). The MNF sequence enables calculation of TSC, PD, 1H T1 and T2 maps (Figure 1).
For each acquisition, reference phantoms were placed on both sides of the volunteer’s knee. These phantoms contained 150 mM NaCl and 3% agar to mimic physiological relaxation times for TSC quantification.
All 1H MRF and 23Na MRI data were reconstructed offline in MATLAB. Both 23Na images were corrected for B1- inhomogeneities by estimating the coil’s receive field through application of a Gaussian low pass filter on the masked object [18].
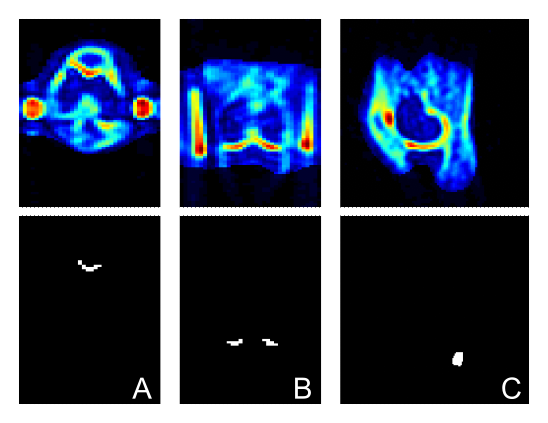
TSC maps were generated from MNF and FLORET 23Na images by linear regression from the signal intensity in the reference phantoms, including a correction factor for the phantom’s relaxation times. Mean TSC was calculated within four ROIs (patellar (PT), femorotibial medial (FTM) and -lateral (FTL) cartilage, and gastrocnemius muscle (GNM), Figure 1) on both TSC maps. A paired student t-test was performed to evaluate differences between ROI measurements from both TSC maps. Values for PD, and 1H T1 and T2 were also measured in the same ROIs.
Results
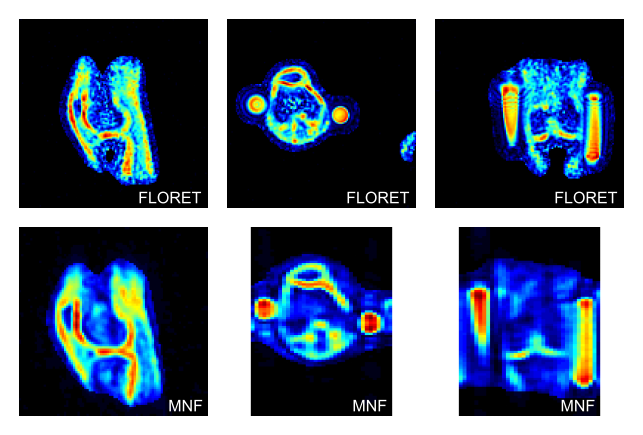
One slice of each orientation of the FLORET and 23Na MNF are shown in Figure 2.The student t-test showed no significant difference (p>0.05) between mean TSC values from both maps in all ROIs.
Examples of the four MNF maps are shown in Figure 3.
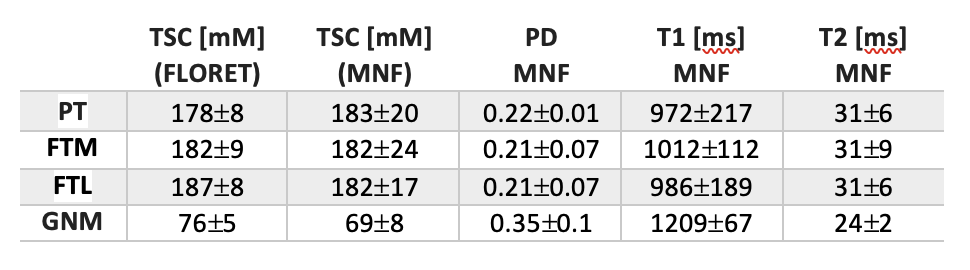
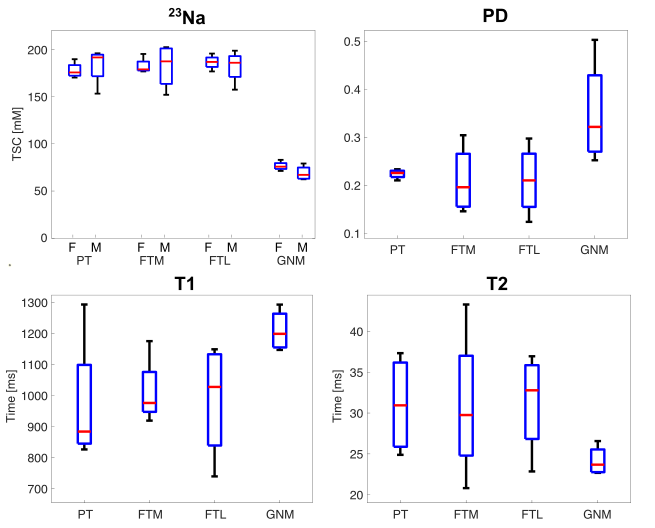
All ROI values are listed in Table 1, and the corresponding boxplots are depicted in Figure 4.
Discussion
The mean TSC values measured in all ROIs were similar when quantified based on FLORET versus MNF. Previous studies have reported TSC to be around 158-271 mM [19] within different regions in the knee cartilage. In this study we observed values on the lower end of this range, (178-187)±8 mM. Cartilage is surrounded by synovial fluid, which has TSC values around 140 mM. Due to the relatively large voxel sizes of 23Na images, TSC values are a volume-weighted average of TSC in synovial fluid and cartilage (TSC around 250-300 mM [20]).However, TSC within the GNM was around 69±8 (FLORET) and 76±5 mM (MNF), which is overall significantly higher than previously reported TSC values in human muscles [19]. Mean T1 (972±217, 1012±112, and 986±189 ms) and T2 (31±6, 31±9, and 31±6 ms) in cartilage were in agreement with literature values [12]. Mean T1 (1209±67ms) and T2 (24±2 ms) in GNM were also similar to previously-reported values [21,22].
Conclusion
We showed that a 3D simultaneous 1H MRF / 23Na MRI acquisition at 7 T provides reliable quantitative maps of TSC, PD, and 1H T1 and T2 in cartilage.Acknowledgements
This work was supported in part by the NIH R01 AR079182, and was performed under the rubric of the Center for Advanced Imaging Innovation and Research (CAI2R, www.cai2r.net), an NIBIB National Center for Biomedical Imaging and Bioengineering (NIH P41 EB017183).References
- Thulborn, Keith R., et al. "Quantitative tissue sodium concentration mapping of the growth of focal cerebral tumors with sodium magnetic resonance imaging." Magnetic Resonance in Medicine 41.2 (1999): 351-359.
- Boada, Fernando E., et al. "Fast three dimensional sodium imaging." Magnetic resonance in Medicine 37.5 (1997): 706-715.
- Madelin, Guillaume, and Ravinder R. Regatte. "Biomedical applications of sodium MRI in vivo." Journal of Magnetic Resonance Imaging 38.3 (2013): 511-529.
- Yu, Zidan, et al. "Simultaneous proton magnetic resonance fingerprinting and sodium MRI." Magnetic Resonance in Medicine 83.6 (2020): 2232-2242.
- Yu, Zidan, et al. "Simultaneous 3D acquisition of 1H MRF and 23Na MRI." Magnetic Resonance in Medicine 87.5 (2022): 2299-2312.
- Ma, Dan, et al. "Magnetic resonance fingerprinting." Nature495.7440 (2013): 187-192.
- Borthakur, Arijitt, et al. "Sodium and T1ρ MRI for molecular and diagnostic imaging of articular cartilage." NMR in Biomedicine19.7 (2006): 781-821.
- Shapiro, Erik M., et al. "23Na MRI accurately measures fixed charge density in articular cartilage." Magnetic Resonance in Medicine 47.2 (2002): 284-291.
- Wheaton, Andrew J., et al. "Proteoglycan loss in human knee cartilage: quantitation with sodium MR imaging—feasibility study." Radiology 231.3 (2004): 900-905.
- Madelin, Guillaume, Alexej Jerschow, and Ravinder R. Regatte. "Sodium relaxation times in the knee joint in vivo at 7T." NMR in Biomedicine 25.4 (2012): 530-537.
- Madelin, Guillaume, et al. "Longitudinal study of sodium MRI of articular cartilage in patients with knee osteoarthritis: initial experience with 16-month follow-up." European radiology 28.1 (2018): 133-142.
- Kijowski, Richard, et al. "Age‐Dependent Changes in Knee Cartilage T1, T2, and T1 p Simultaneously Measured Using MRI Fingerprinting." Journal of Magnetic Resonance Imaging 57.6 (2023): 1805-1812.
- Yao, Weiwu, et al. "The application of T1 and T2 relaxation time and magnetization transfer ratios to the early diagnosis of patellar cartilage osteoarthritis." Skeletal radiology 38 (2009): 1055-1062.
- D Mittal, Shruti, et al. "T1 and T2 mapping of articular cartilage and menisci in early osteoarthritis of the knee using 3-Tesla magnetic resonance imaging." Polish Journal of Radiology 84 (2019): 549-564.
- E Eckstein, Felix, Deborah Burstein, and Thomas M. Link. "Quantitative MRI of cartilage and bone: degenerative changes in osteoarthritis." NMR in Biomedicine 19.7 (2006): 822-854.
- Rodriguez, Gonzalo G., et al. "Super‐resolution of sodium images from simultaneous 1H MRF/23Na MRI acquisition." NMR in Biomedicine (2023): e4959.
- Pipe, James G., et al. "A new design and rationale for 3D orthogonally oversampled k‐space trajectories." Magnetic Resonance in Medicine 66.5 (2011): 1303-1311.
- Lachner, Sebastian, et al. "Comparison of optimized intensity correction methods for 23Na MRI of the human brain using a 32-channel phased array coil at 7 Tesla." Zeitschrift für Medizinische Physik 30.2 (2020): 104-115.
- Gast, Lena V., et al. "Recent technical developments and clinical research-applications of sodium (23Na) MRI." Progress in Nuclear Magnetic Resonance Spectroscopy 138–139 (2023) 1–51
- Zaric, Olgica, et al. "Frontiers of sodium MRI revisited: from cartilage to brain imaging." Journal of Magnetic Resonance Imaging 54.1 (2021): 58-75.
- Sharafi, Azadeh, et al. "Simultaneous T1, T2, and T1ρ relaxation mapping of the lower leg muscle with MR fingerprinting." Magnetic Resonance in Medicine 86.1 (2021): 372-381.
- Marty, Benjamin, et al. "Quantitative skeletal muscle imaging using 3D MR fingerprinting with water and fat separation." Journal of Magnetic Resonance Imaging 53.5 (2021): 1529-1538.
Figures