0924
Dynamic Mode Decomposition reveals 23Na Multi-Quantum Coherences and allows incomplete RF Phase-Cycling1Computer Assisted Clinical Medicine, Medical Faculty Mannheim, Heidelberg University, Mannheim, Germany, 2Mannheim Institute for Intelligent Systems in Medicine, Medical Faculty Mannheim, Heidelberg University, Mannheim, Germany, 3CNRS, CRMBM, Aix-Marseille Université, Marseille, France, 4APHM, Hôpital Universitaire Timone, CEMEREM, Marseille, France
Synopsis
Keywords: Non-Proton, Non-Proton, Dynamic Mode Decomposition, Signal separation
Motivation: Sodium (23Na) Multi-Quantum Coherences (MQC) MRI potentially provides richer tissue information. However, separation of the single (SQ) and triple (TQ) quantum coherences is challenging and is done by computing the Fourier transform (FT). Unfortunately, the FT is susceptible to noise and phase-cycle imperfections.
Goal(s): To enable reliable frequency separation of the superimposed 23Na MQC signal even with undersampling phase-cycling.
Approach: Dynamic Mode Decomposition (DMD) was used to separate the signal components and was tested on numerical simulations, phantom and in vivo brain data acquired at 3T.
Results: DMD reliably separated SQ and TQ signal components from 23Na MQC MRI despite missing phase-cycling steps.
Impact: DMD reliably separates SQ and TQ signal components and has the potential to enable phase-cycle undersampling below the TQ Nyquist limit to accelerate 23Na MQC MRI. Despite 23Na MQC MRI, every MRI experiment involving phase-cycling could benefit from this approach.
Introduction
Conventional sodium (23Na) MRI is a promising tool to probe tissue ionic homeostasis but often needs to be expanded to analyze the sodium signal intensity1. 23Na multi-quantum coherence (MQC) MRI, on the other hand, enables the disentangling of Single (SQ) and Triple (TQ) quantum coherence and therefore, holds potentially richer sodium tissue characterization3.As proposed by Fleysher et al.4, the underlying quantum coherences are obtained by computing the Fourier transform (FT) along the RF phase-cycle dimension of the 23Na MQC data. Hence, the spectrum is obtained by sampling signals between 0 and 360° at regular phase offsets. Inherently, probing the TQ component restricts RF phase-cycling steps to align with the Nyquist limit at phase increments with a minimum of 6 phase-cycle steps5. As a result, any signal corruption or incompletion causes waveform instability and results in TQ misestimation and visual distortion.
Dynamic Mode Decomposition6 (DMD) enables the extraction of distinct dynamical features of a system by computing sets of modes linked to a specific frequency, e.g. the SQ and TQ signal components. Indeed, DMD enables forecasting missing data by leveraging linear regression based on previous observations.
For the first time, DMD was leveraged to compute the 23Na MQC spectrum to identify dominant spatiotemporal features from the superimposed 23Na MQC signal. This approach was extensively studied across numerical simulations, phantom, and in vivo volunteer measurements on 3.0 T.
Methods
All measurements were performed on 3T MRI (Trio, Siemens Heathineers, Erlangen,Germany) with a bird-cage dual-tuned 23Na/1H head coil (RapidBiomedical, Rimpar, Germany). 23Na MQC MR images were obtained using the CRISTINA sequence5.For brain in-vivo, in three volunteers (28+/-2, two females): FoV 230x230x160mm, matrix size 24x24x8, τ=12.9ms, BW=210Hz/px, TE/ΔTE/nTE= 1.62/6.2ms/10, TR=150ms resulting in TA=2x31min.
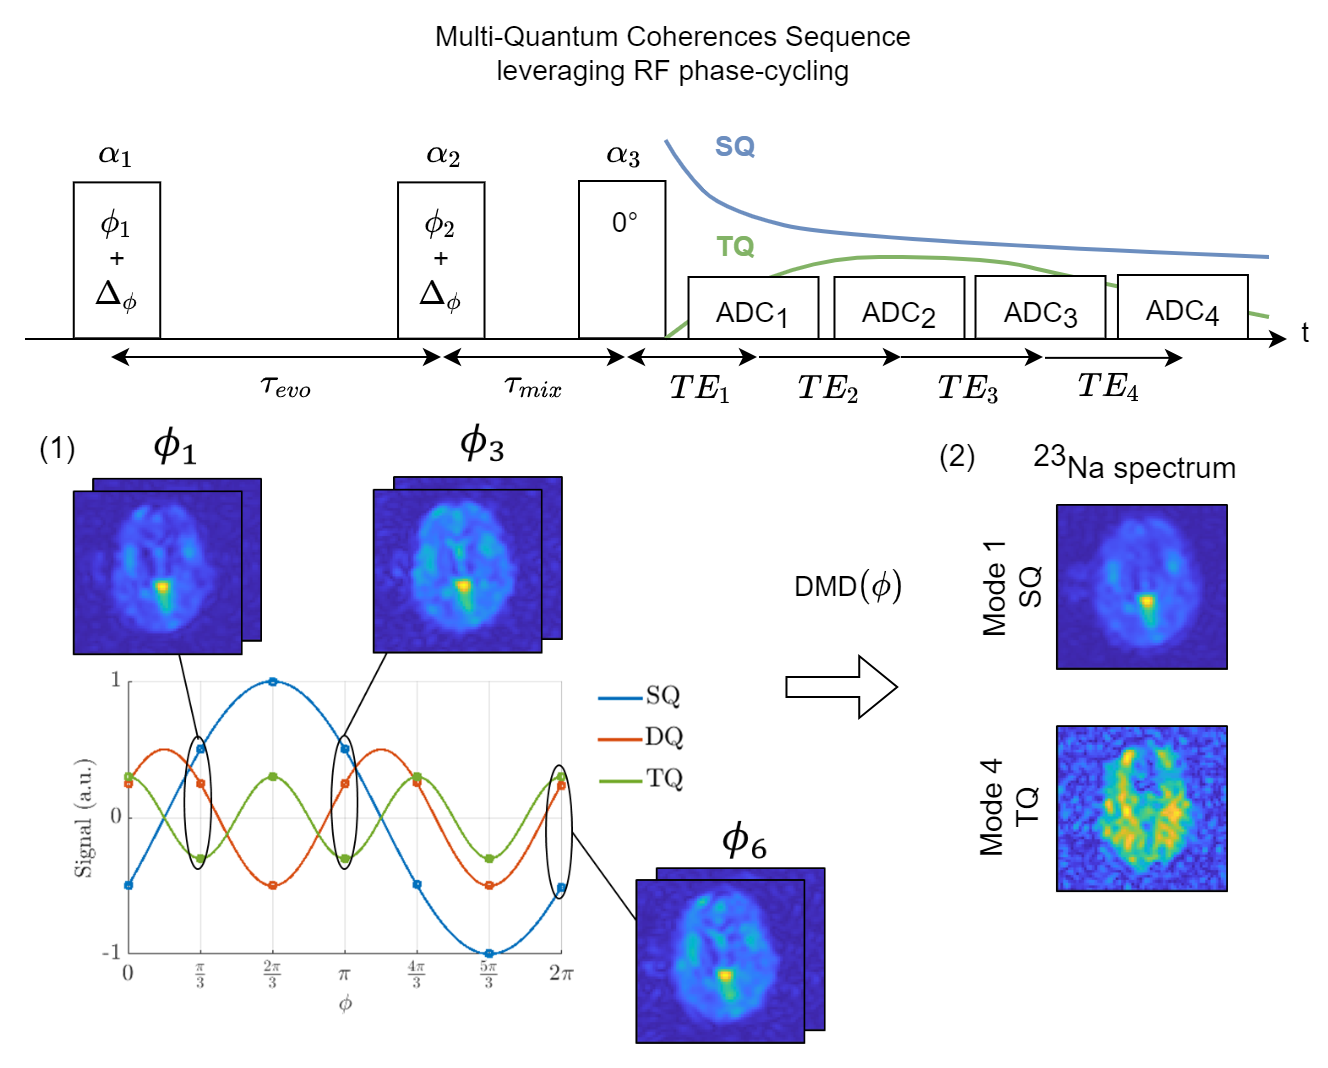
Image processing: Each phase-cycled 23Na MQC data, $$$u_\phi$$$, was reshaped into a snapshot sequence, $$$U_1^N$$$, along the phase-cycle dimension, $$$\phi$$$, hence, $$U_1^N={u_{\phi_1}, u_{\phi_2},...,u_{\phi_N}}$$ with $$$u_{\phi_N}$$$ being the $$$N$$$-th snapshot of the 23Na MQC phase-cycle step. Assuming a linear relationship, the phase-cycle snapshot series becomes $$$U_2^N=\hat{\sigma}U_1^{N-1}$$$ Conclusively, a best-fit linear operator, $$$\hat{\sigma}$$$, is computed, that transforms $$$U_1^{N-1}$$$ into $$$U_2^{N}$$$ according to $$\hat{\sigma}=U_2^NU_1^{N-1*}$$ Computing the eigendecomposition of $$$\hat{\sigma}$$$ by leveraging a truncated Singular Value Decomposition (SVD) reveals the DMD eigenvalues and modes. In the case of skipping a phase-cycle step, the missing phase-cycle step was predicted according to $$\bar{X}=be^{\omega t}$$ with $$$b$$$ being the respective amplitudes of each mode, $$$\omega$$$ being the transformed DMD eigenvalues and $$$t$$$ the time step to predict. The DMD algorithm from Ilicak et al7 was used and the workflow for this project is shown in Fig.1.
Results
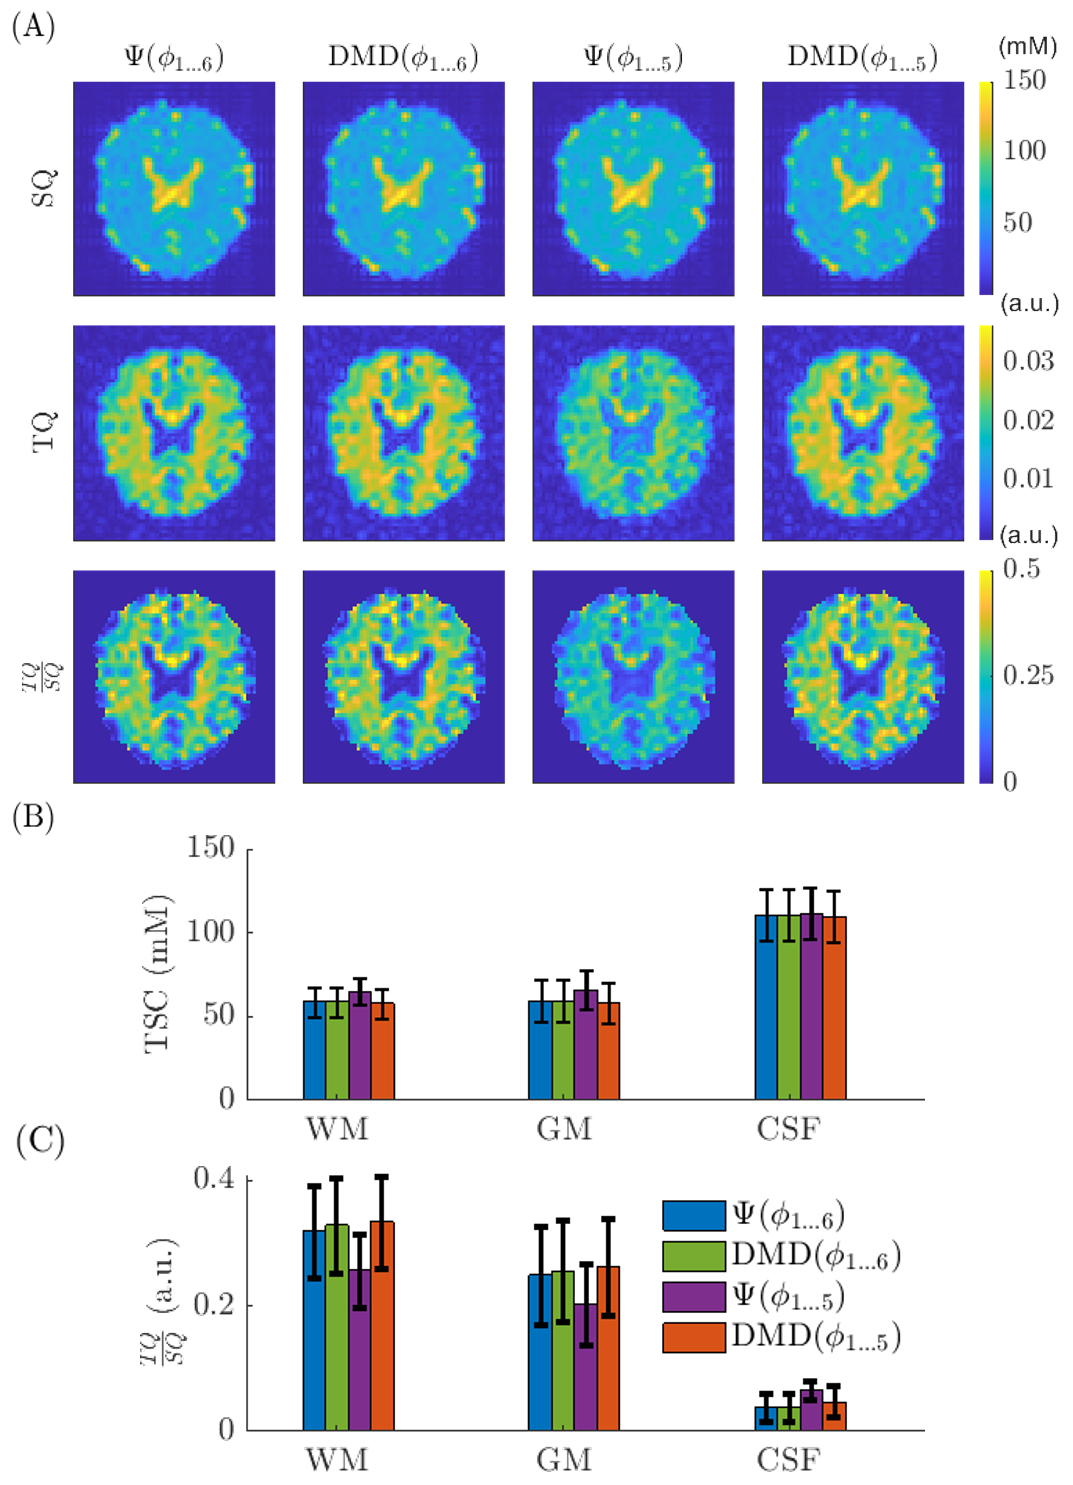
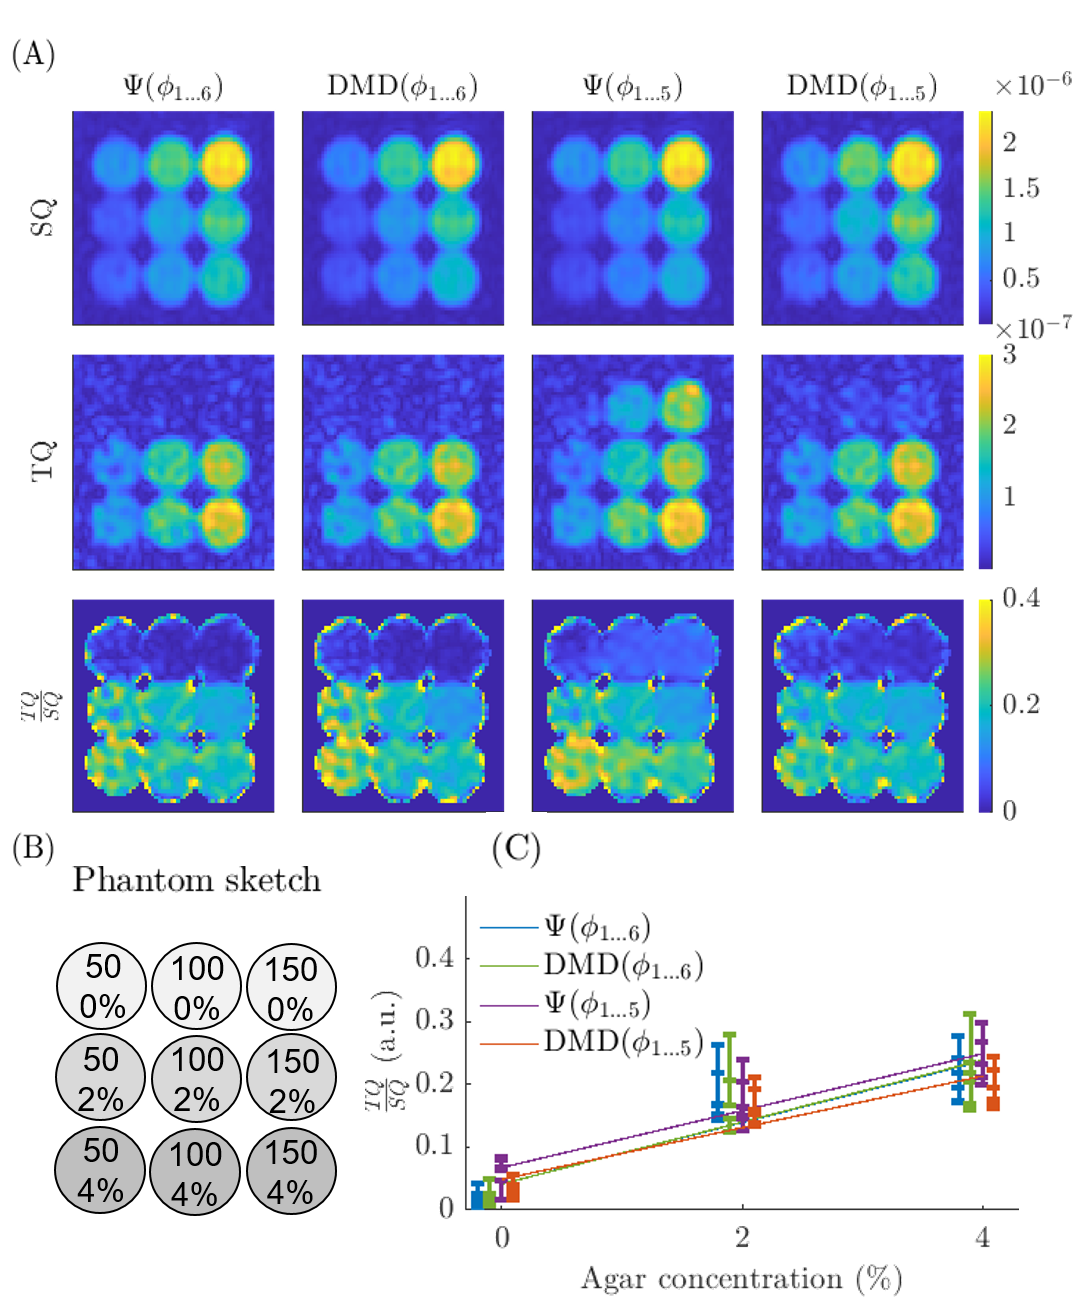
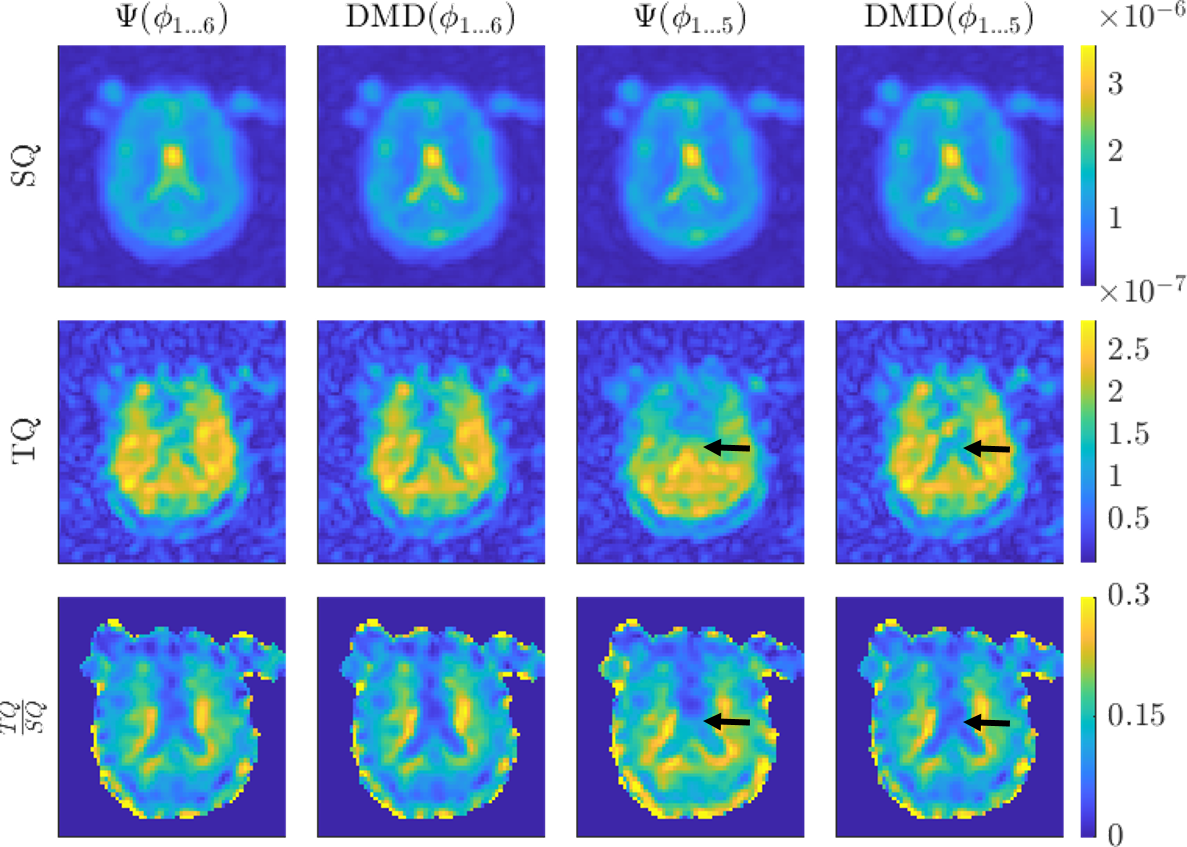
Tissue Sodium Concentration (TSC) and TQ/SQ ratio maps of numerical simulations (Fig.2) were on par with the FT w/o undersampling (SSIMSQ=0.99, SSIMTQ=0.89). Once phase-cycle undersampling was introduced, FT failed to recover the TQ signal component adequately, whereas DMD yielded robust TQ images (SSIMSQ=0.99, 0.92; SSIMTQ=0.80, 0.89 for FT and DMD, respectively). RMSE for TQ/SQ ratio maps were RMSE=0.0070, 0.0408, 0.0244, for DMD w/o undersampling and FT, DMD with phase-cycle undersampling. The phantom study (Fig.3) revealed accurate SQ, TQ, and TQ/SQ ratio map reconstruction compared to the FT. When undersampling of phase-cycling was applied, the FT could not recover the TQ signal, whereas the DMD correctly revealed the underlying frequency components. Linear regression of TQ/SQ vs agar concentration confirmed signal intensity with R2=0.80, 0.75, 0.89, 0.84 for FT, DMD w/o, and FT, DMD with phase-cycle undersampling, respectively. In vivo (Fig.4), the analysis showed DMD performed similarly to FT when full-phase cycling was used (SSIMSQ=0.98, SSIMTQ=0.97). Undersampling phase-cycling resulted in corrupted TQ images for the FT, whereas DMD provided reliable images (SSIMSQ=0.98, 0.98; SSIMTQ=0.86, 0.97 for FT and DMD, respectively). RMSE for TQ/SQ ratio was RMSE=0.0280, 0.0409, 0.0265, for DMD w/o undersampling and FT, DMD with phase-cycle undersampling.Discussion and Conclusion
Since the TQ oscillates at a 3-times higher frequency than SQ, DMD successfully separated these two signal components (see Figures 2, 3, and 4). Interestingly, DMD could also handle undersampled phase-cycling. By skipping one phase-cycle step ($$$\phi_6$$$), measurement time can be reduced. The FT failed to reconstruct the TQ signal due to its periodic signal assumption being violated by the removal of one phase-cycle step. However, the lower frequency SQ signal was retained. Nevertheless, DMD’s scaling issue of each mode remains to be solved. For now, the ratio of the DMD mode and the FT spectrum was used to correct for intensity bias.In conclusion, DMD is a reliable tool to separate SQ and TQ signal components from 23Na MQC MRI and offers the potential to accelerate 23Na MQC MRI by skipping phase-cycling steps.
Acknowledgements
Authors Lothar R. Schad and Stanislas Rapacchi contributed equally to this work.References
1. Huhn K, Engelhorn T, Linker RA, Nagel AM. Potential of Sodium MRI as a Biomarker for Neurodegeneration and Neuroinflammation in Multiple Sclerosis. Front Neurol. 2019 Feb 11;10:84.
2. Hoesl, M.A., Kleimaier, D., Hu, R., Malzacher, M., Nies, C., Gottwald, E. and Schad, L.R. (2019), 23Na Triple-quantum signal of in vitro human liver cells, liposomes, and nanoparticles: Cell viability assessment vs. separation of intra- and extracellular signal. J. Magn. Reson. Imaging, 50: 435-444.
3. LaVerde, G., Nemoto, E., Jungreis, C., Tanase, C. and Boada, F. (2007), Serial triple quantum sodium MRI during non-human primate focal brain ischemia. Magn. Reson. Med., 57: 201-205.
4 Fleysher L, Oesingmann N, Inglese M. B₀ inhomogeneity-insensitive triple-quantum-filtered sodium imaging using a 12-step phase-cycling scheme. NMR Biomed. 2010 Dec;23(10):1191-8.
5. Hoesl, M.A.U., Schad, L.R., Rapacchi, S.,Volumetric 23Na Single and Triple-Quantum Imaging at 7T: 3D-CRISTINA, Zeitschrift für Medizinische Physik, Volume 32, Issue 2, 2022, Pages 199-208.
6. SCHMID, P. (2010). Dynamic mode decomposition of numerical and experimental data. Journal of Fluid Mechanics, 656, 5-28.
7. Ilicak, E, Ozdemir, S, Zapp, J, Schad, LR, Zöllner, FG. “Dynamic mode decomposition of dynamic MRI for assessment of pulmonary ventilation and perfusion”. Magn Reson Med. 2023; 1- 9.
Figures