0914
Improved Hepatocellular Carcinoma Targeted Combination Immunotherapy Using a Nanocarrier: Monitoring Tumor Response via Functional MRI1Department of Radiology, The Second Affiliated Hospital, School of Medicine, South China University of Technology, Guangzhou, China, 2Philips Healthcare, Guangzhou, China
Synopsis
Keywords: Liver, fMRI, Hepatocellular Carcinoma; Immunotherapy; Nanocarrier; IVIM-MRI; Tumor Microenvironment
Motivation: To enhance the efficacy of hepatocellular carcinoma immunotherapy using a nanocarrier and to explore IVIM-MRI for monitoring the tumor immune microenvironment.
Goal(s): To synthesize iRGD-targeted liposomes to enhance the treatment efficacy of hepatocellular carcinoma and to develop effective biomarkers for the tumor microenvironment.
Approach: We synthesized iRGD-modified liposomal co-encapsulating Lenvatinib and BMS-202. IVIM-MRI was performed before and at 6 and 12 days after treatments, followed by pathological examination after the final scan.
Results: iRGD-lip@Len/BMS-202 promotes tumor vascular normalization and effectively activates an anti-tumor immune response. Importantly, the derived parameters D* and f are significantly correlated with tumor vascular normalization and immune activation.
Impact: The iRGD-targeted dual-drug liposomal nanoparticles exhibited potent synergistic anti-tumor effects. Additionally, IVIM-MRI facilitated the monitoring of changes in the tumor microenvironment, with the D* and f parameters serving as valuable indicators for evaluating tumor vascular network and immune microenvironment modulation.
Introduction
The combination therapy of Lenvatinib with immune checkpoint inhibitors (ICB) holds promise for hepatocellular carcinoma (HCC) treatment. Nevertheless, the existing targeted combination immunotherapy faces challenges such as the high cost and immunogenicity of ICB antibodies[1], off-target toxicity of Lenvatinib[2], low drug co-delivery efficacy, and lack of effective biomarkers for treatment guidance[3]. Therefore, this study aims to develop an effective drug delivery strategy and utilize intravoxel incoherent motion (IVIM) MRI for real-time monitoring of changes in the tumor immune microenvironment. The ultimate goal is to develop effective biomarkers for guiding HCC treatment.Methods
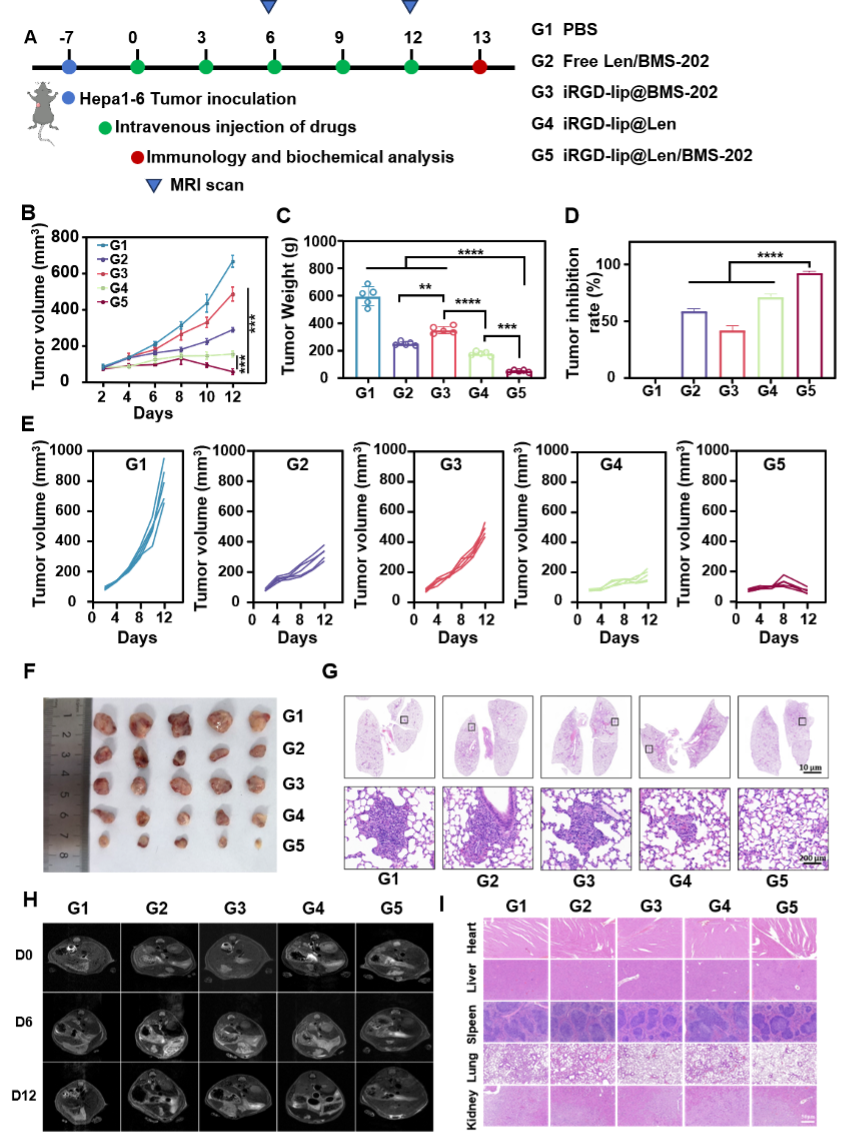
The film hydration-probe ultrasonication method was employed to synthesize an iRGD-modified liposome drug delivery system co-encapsulating Lenvatinib and the immune checkpoint small molecule inhibitor BMS-202 (iRGD-lip@Len/BMS-202).To evaluate the system’s effectiveness, 25 mice with subcutaneous hepatocellular carcinoma were randomly assigned to five groups. These groups received different treatments, including PBS, Free Len/BMS-202, iRGD-lip@BMS-202, iRGD-lip@Len, and iRGD-lip@Len/BMS-202 on days 1, 3, 6, 9, and 12, respectively.
IVIM-MRI scans were performed before and at 6 and 12 days after treatment. Pathological examinations, which included HE staining, HIF-1a 、CD31、α-SMA、TUNEL immunofluorescent staining, as well as CD8+ T lymphocyte and Ki-67 immunohistochemical staining, were performed following the final scan.
Result
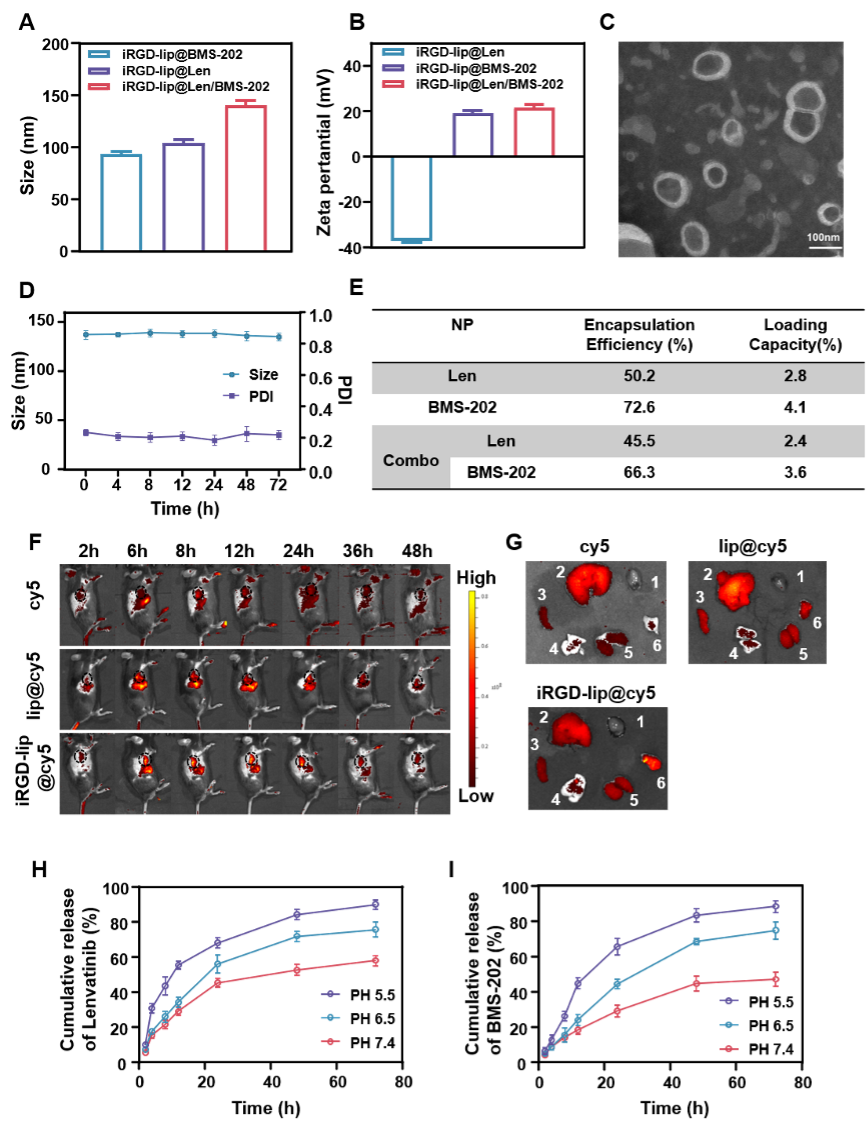
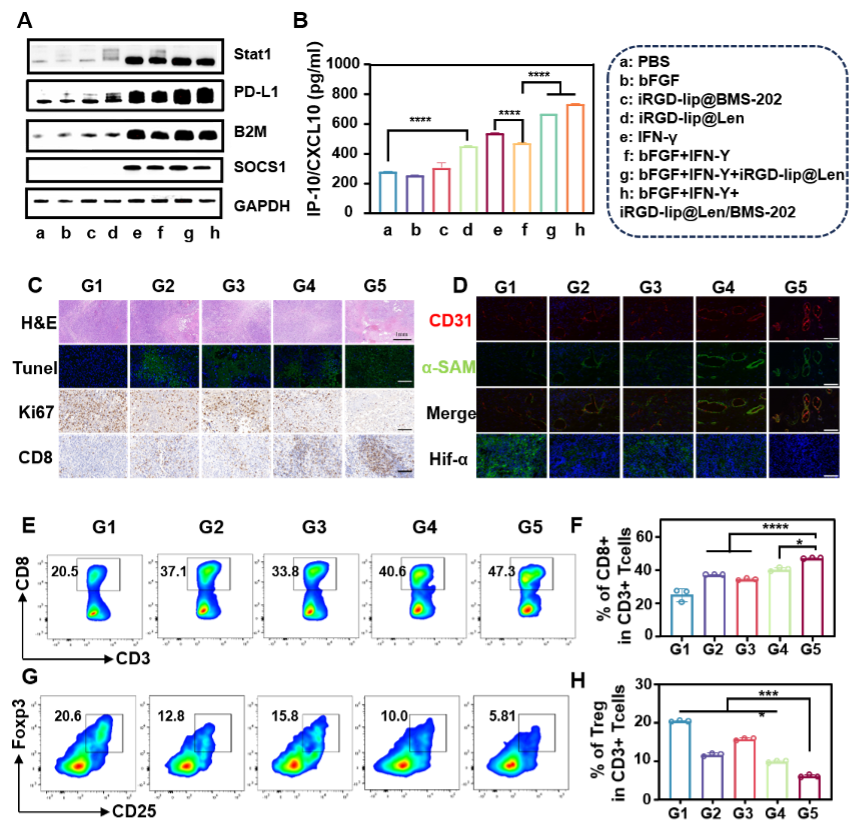
The iRGD-lip@Len/BMS-202 nanoparticles exhibited favorable stability and dispersibility with a particle size of 144nm, along with high drug loading and encapsulation efficiency. The iRGD-mediated targeting facilitated drug accumulation in the tumor microenvironment. Within the acidic tumor milieu, the liposomes provided sustained release of Lenvatinib and BMS-202 (Figure 1).Lenvatinib played a pivotal role in promoting tumor vascular normalization and improving hypoxic tumor conditions. It activated the IFN-γ signaling pathway, resulting in creased secretion of CXCL10 and the recruitment of CD8+ T cells. Moreover, Lenvatinib upregulates PD-L1 expression in tumor cells, enhancing BMS-202’s efficacy and triggering an immune response within the tumor. (Figure 2)This led to reduced subcutaneous and orthotopic HCC tumors, suppression of lung metastasis, and minimized drug-related toxicity (Figure 3).
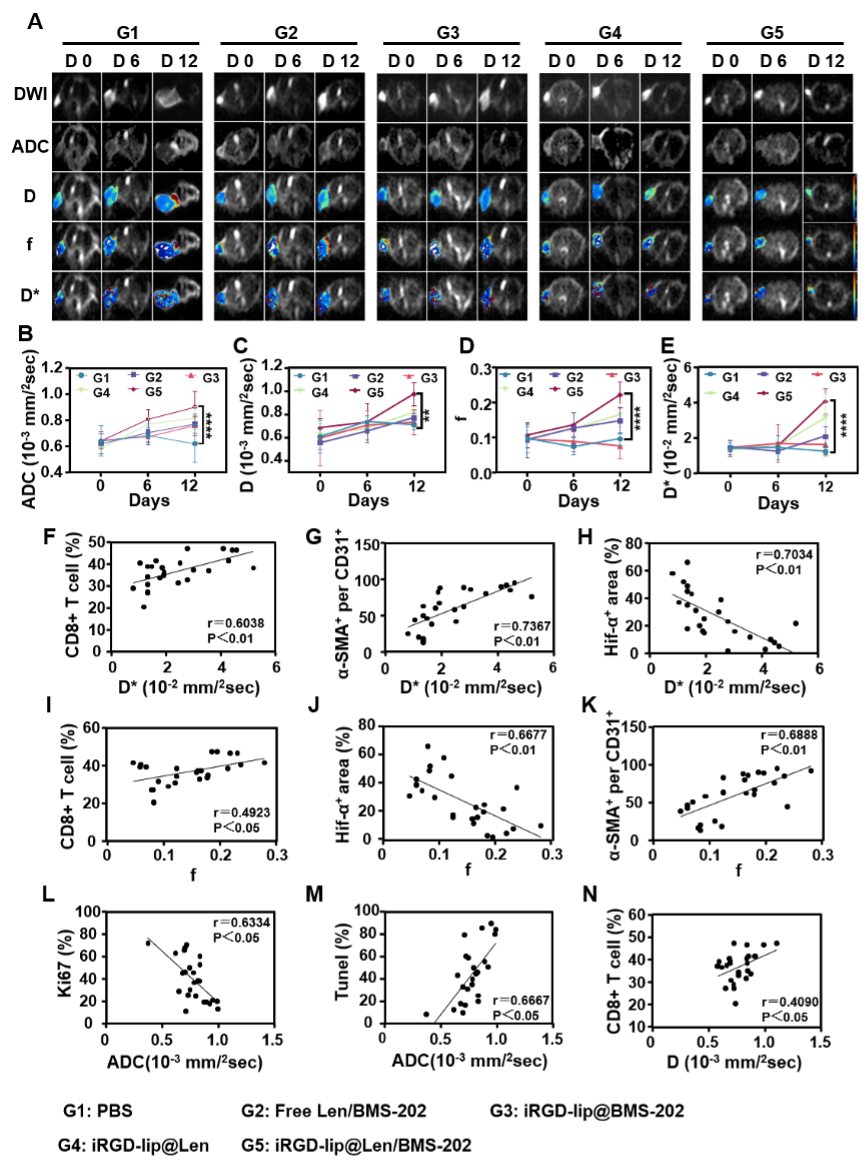
The D value, D* value, and f value of the iRGD-lip@Len/BMS-202 group on the 6th and 12th day of treatment were higher than those of the control group. The D* value and f value exhibited a significant positive correlation with pericyte coverage rate and CD8+ T lymphocyte density while demonstrating a significant negative correlation with tumor hypoxia levels. The D value showed a moderate positive correlation with CD8+ T lymphocyte density. The standard ADC value displayed a significant negative correlation with Ki67 expression and a significant positive correlation with TUNEL necrosis rate (Figure 4).
Discussion
In this study, we successfully developed a novel liposomal nanoparticle system that improved the targeted delivery of Lenvatinib and BMS-202 to tumor sites, minimizing their associated toxicities. These nanoparticles exhibited drug release in the acidic tumor microenvironment. Furthermore, low-dose Lenvatinib was found to enhance tumor vascular maturation and promote immune cell infiltration, ultimately amplifying the efficacy of immune checkpoint inhibitors.The utility of IVIM-MRI lies in its capability to distinguish between water molecules within and outside blood vessels, providing insights into both water molecule diffusion and microcirculation perfusion status[4, 5]. Both parameters D* and f are closely related to perfusion characteristics[6]. This study confirms that D* and f values can serve as non-invasive indicators for assessing tumor vascular normalization and CD8+ T lymphocyte density. On the other hand, the D value reflects the diffusion motion of water molecules between cells[7]. AS immune cell infiltration in the tumor microenvironment increases, water molecule diffusion becomes restricted, leading to higher D values. We observed a moderate correlation between D value and CD8+ T lymphocyte density, suggesting that D value can complement D* and f values for evaluating CD8+ T lymphocyte density. Furthermore, the ADC value displayed positive correlations with TUNEL and negative correlations with Ki-67, consistent with previous reports[8]. This indicates that ADC value can be used to assess tumor cell apoptosis and proliferation. In essence, functional MRI provides a non-invasive means of predicting treatment response.
Conclusion
Liposomes modified with iRGD can be easily assembled with FDA-approved drugs, enhancing the bioavailability of the drugs and providing an effective strategy for treating HCC patients. In addition, quantitative parameters derived from IVIM-MRI serve as valuable changes in the tumor microenvironment during treatment, such as tumor vascular normalization, hypoxia levels, CD8+ T lymphocyte density, cell necrosis, and proliferation, offering the possibility of developing effective biomarkers to monitor the therapeutic response of nanomedicine.Acknowledgements
No acknowledgements found.References
[1] TU K, YU Y, WANG Y, et al. Combination of Chidamide-Mediated Epigenetic Modulation with Immunotherapy: Boosting Tumor Immunogenicity and Response to PD-1/PD-L1 Blockade [J]. ACS Applied Materials & Interfaces, 2021, 13(33): 39003-17.
[2] ZONG J, PENG H, QING X, et al. pH-Responsive Pluronic F127-Lenvatinib-Encapsulated Halogenated Boron-Dipyrromethene Nanoparticles for Combined Photodynamic Therapy and Chemotherapy of Liver Cancer [J]. ACS Omega, 2021, 6(18): 12331-42.
[3] WANG L S L M J Z W T L Z S X J C J. Imaging features of gadoxetic acid‑enhanced MR imaging for evaluation of tumor‑infltrating CD8 cells and PD‑L1 expression in hepatocellular carcinoma [J]. 2022.
[4] JUNJIAO HU1, X Y, P Y, et al. Intravoxel Incoherent Motion Diffusion-Weighted MR Imaging for Monitoring the Immune Response of Immunogenic Chemotherapy [J]. 2021.
[5] LUO M, ZHANG L, JIANG X H, et al. Intravoxel incoherent motion: application in differentiation of hepatocellular carcinoma and focal nodular hyperplasia [J]. Diagn Interv Radiol, 2017, 23(4): 263-71.
[6] YEDAUN LEE1, SEUNG SOO LEE1, H C, C K L, et al. Intravoxel incoherent motion MRI for monitoring the therapeutic response of hepatocellular carcinoma to sorafenib treatment in mouse xenograft tumor models [J]. 2017.
[7] 1 M D, S C, V C, et al. Intravoxel Incoherent Motion (IVIM) MR Quantification in Locally Advanced Cervical Cancer (LACC): Preliminary Study on Assessment of Tumor Aggressiveness and Response to Neoadjuvant Chemotherapy [J]. 2022.
[8] MA1† M, J L, D Z, et al. Monitoring Treatment Efficacy of Antiangiogenic Therapy Combined With Hypoxia-Activated Prodrugs Online Using Functional MRI [J]. 2021.
Figures