0905
A Versatile Setup for Measuring Complex Gradient-to-Acoustic-Noise or Gradient-to-Vibration Transfer Functions via the Scanner’s ADC1NMR Methods & Development Group, Max Planck Institute for Human Cognitive and Brain Sciences, Leipzig, Germany, 2Felix Bloch Institute for Solid State Physics, Leipzig University, Leipzig, Germany
Synopsis
Keywords: Gradients, New Devices, Acoustic, Vibration, Microphone, Accelerometer, Transfer Function, Sound Level, Safety
Motivation: Knowledge of gradient transfer functions in situ would allow predictions about the auditory spectrum of arbitrary MRI sequences during execution, to achieve individualized assessments of potentially harmful sound levels or damaging vibrations of the gradient coil.
Goal(s): Our goal was to enable the integration of appropriate sound or vibration measurements into the routine operation of a scanner.
Approach: A modulator box was developed that emulates a receiver coil and permits the simultaneous digitization of variable sensor signals (e.g., microphones and accelerometers) by the scanner's ADC.
Results: Realistic gradient-to-acoustic-noise and gradient-to-vibration transfer functions were determined without the need of synchronizing external devices.
Impact: A versatile hardware concept has been developed that allows integration into a clinical scanner and prediction of the sound level inside the bore from the frequency spectrum of the input signal defined by the pulse sequence during scanning.
Introduction
When operating MRI scanners at high gradient amplitudes and slew rates, significant acoustic noise is generated.1 This is a concern for patient safety2 and can degrade image quality if vibrations are transferred from the gradient coil to the patient table.3,4 Knowledge of the gradient's spectral response is also essential for assessing resonant frequencies, which can cause coil damage if selectively excited.This work presents a hardware interface to which various sensors, such as microphones and accelerometers, can be connected. Their signals, after suitable modulation, are simultaneously recorded by the scanner's multichannel analog-to-digital converter (ADC). By exciting one gradient axis with a suitable stimulus, the acoustic response, and thus, the corresponding gradient transfer function (GTF)5-7 can be determined with little effort. The perfect synchronization of source and response allows effective averaging of multiple recordings to improve signal-to-noise ratio (SNR). Calibration of the acoustic response, a prerequisite for predictions5,6 of noise levels generated by arbitrary MRI pulse sequences, is also addressed.
Methods
The principle of the modulator box emulating a multi-channel receive coil on a 3T MRI scanner (Skyrafit, Siemens Healthineers, Erlangen, Germany) is shown in Figure 1. A quartz-controlled synthesizer is programmed to a frequency that has an odd multiple within the scanner’s receiver bandwidth. All input channel boards contain an amplifier for sensor signal conditioning, followed by a double-balanced modulator generating a double-sideband (DSB) signal with suppressed carrier. The consistent low power design allows each channel to be powered individually by the scanner, just as in normal MRI preamplifiers. The only electrical connection between the boards is one for the carrier signal supply.An electret microphone capsule (WM-61A, Panasonic, Kadoma, Japan) was used as the sensor in the initial setup. A 3D-printed housing (13.2 mm diameter; Figure 2A) allows the use of a standard calibrator (4213, Brüel & Kjær, Nærum, Denmark), however, not directly in the bore. Therefore, the impact from the magnetic field on the capsule properties was further investigated at well-defined orientations (Figure 2B). Vibrations were measured using an inexpensive accelerometer (BU-23173-000, Knowles, Itasca, IL, USA).
An MR pulse sequence was written to execute a DC-free chirp gradient waveform (Figure 3) of desired amplitude and direction with user-selectable receiver bandwidth, number of ADC samples, TR, and number of repetitions. Data was stored in the manufacturer's raw format. Post-processing was performed with Matlab/Octave. The DSB signals were multiplied by the complex-conjugate carrier signal, which eliminates unwanted phase modulation caused by the scanner’s eddy current compensation. After FFT and a data-driven phase correction, the two sidebands were averaged and complex transfer functions were obtained by dividing by the excitation spectrum.
Results and Discussion
Testing the microphone capsule inside the bore (Figure 2B) with the axis aligned parallel to B0 resulted in an output signal that was approximately 3 dB higher while consuming less current compared to the measurement outside the magnet. In contrast, no significant changes were found for the orthogonal orientation, which was chosen for all further measurements. A conceivable reason is an unwanted Hall effect in the integrated field-effect transistor. Similar effects are known from GaAs-based MRI preamplifiers.8Gradient-to-acoustic transfer functions obtained near the center and the entrance of the bore are depicted in Figure 4. Typical features, such as “forbidden bands” specified by the manufacturer, are well reproduced. Positions of narrow negative dips differ between both locations due to different superposition of opposing acoustic waves. Ten averages provided sufficient SNR for frequencies ≥150 Hz. At lower frequencies, more repetitions are required because interferences from the cryopump9,10 and 1/f noise of the microphone overlap in this range. Interestingly, the displacement spectra yielded an even higher SNR (Figure 5) with stable results over the entire frequency range already after a single acquisition.
Conclusion
A versatile hardware concept is presented for the fast and convenient determination of complex gradient transfer functions with respect to sound levels and vibrations under realistic experimental conditions. This might permit individualized acoustic noise predictions on the scanner by evaluating dedicated prescans. For example, the frequency spectrum of the input signal during scanning is easily obtained as the Fourier transform of the (simulated) gradient pulse sequence.11 Hence, a calibrated acoustic response under experimental conditions with the patient positioned inside the bore can be calculated from a simple convolution with the calibrated GTF.An application as a tool for commissioning and maintaining MRI scanners is also conceivable. In principle, sensors for other physical quantities might also be integrated. Measurements at other field strengths are easily achieved with appropriate bandpass filters in the box.
Acknowledgements
No acknowledgement found.References
- Schmitt F. The gradient system. Proceedings of the 21st Annual Meeting of ISMRM, Salt Lake City, UT, USA, 2013.
- McJury M, Shellock FG. Auditory noise associated with MR procedures: A review. J. Magn. Reson. Imaging 2000; 12: 37–45.
- Hiltunen J, Hari R, Jousmäki V, Müller K, Sepponen R, Joensuu R. Quantification of mechanical vibration during diffusion tensor imaging at 3 T. NeuroImage 2006; 32: 93–103.
- Gallichan D, Scholz J, Bartsch A, Behrens TE, Robson MD, Miller KL. Addressing a systematic vibration artifact in diffusion-weighted MRI. Hum. Brain Mapp. 2010; 31: 193–202.
- Hedeen RA, Edelstein WA. Characterization and prediction of gradient acoustic noise in MR imagers. Magn. Reson. Med. 1997; 37: 7–10.
- Rizzo Sierra CV,Versluis MJ, Hoogduin JM, Duifhuis HD. Acoustic fMRI noise: Linear time-invariant system model. IEEE Trans. Biomed. Eng. 2008; 55: 2115–2123.
- Hamaguchi, T, Miyati T, Ohno N, Matsushita T, Takata T, Matsuura Y, Kobayashi S, Gabata T. Spatial analysis of acoustic noise transfer function with a human-body phantom in a clinical MRI scanner. Acta Radiol. 2023; 64: 1212–1221.
- Possanzini C, Boutelje M. Influence of magnetic field on preamplifiers using GaAs FET technology. Proceedings of the 16th Annual Meeting of ISMRM, Toronto, ON, Canada, 2008. p. 1123.
- Nierhaus T, Gundlach C, Goltz D, Thiel SD, Pleger B, Villringer A. Internal ventilation system of MR scanners induces specific EEG artifact during simultaneous EEG-fMRI. NeuroImage 2013; 74: 70–76.
- van der Meer, JN, Pampel A, Van Someren EJW, Ramautar JR, van der Werf YD, Gomez-Herrero G, Lepsien J, Hellrung L, Hinrichs H, Möller HE, Walter M. Carbon-wire loop based artifact correction outperforms post-processing EEG/fMRI corrections—A validation of real-time simultaneous EEG7fMRI correction methods. NeuroImage 2016; 125: 880–894.
- Labadie C, Hetzer S, Schulz J, Mildner T, Aubert-Frécon M, Möller HE. Center-out echo-planar spectroscopic imaging with correction of gradient-echo phase and time shifts. Magn. Reson. Med. 2013; 70: 16–24.
Figures
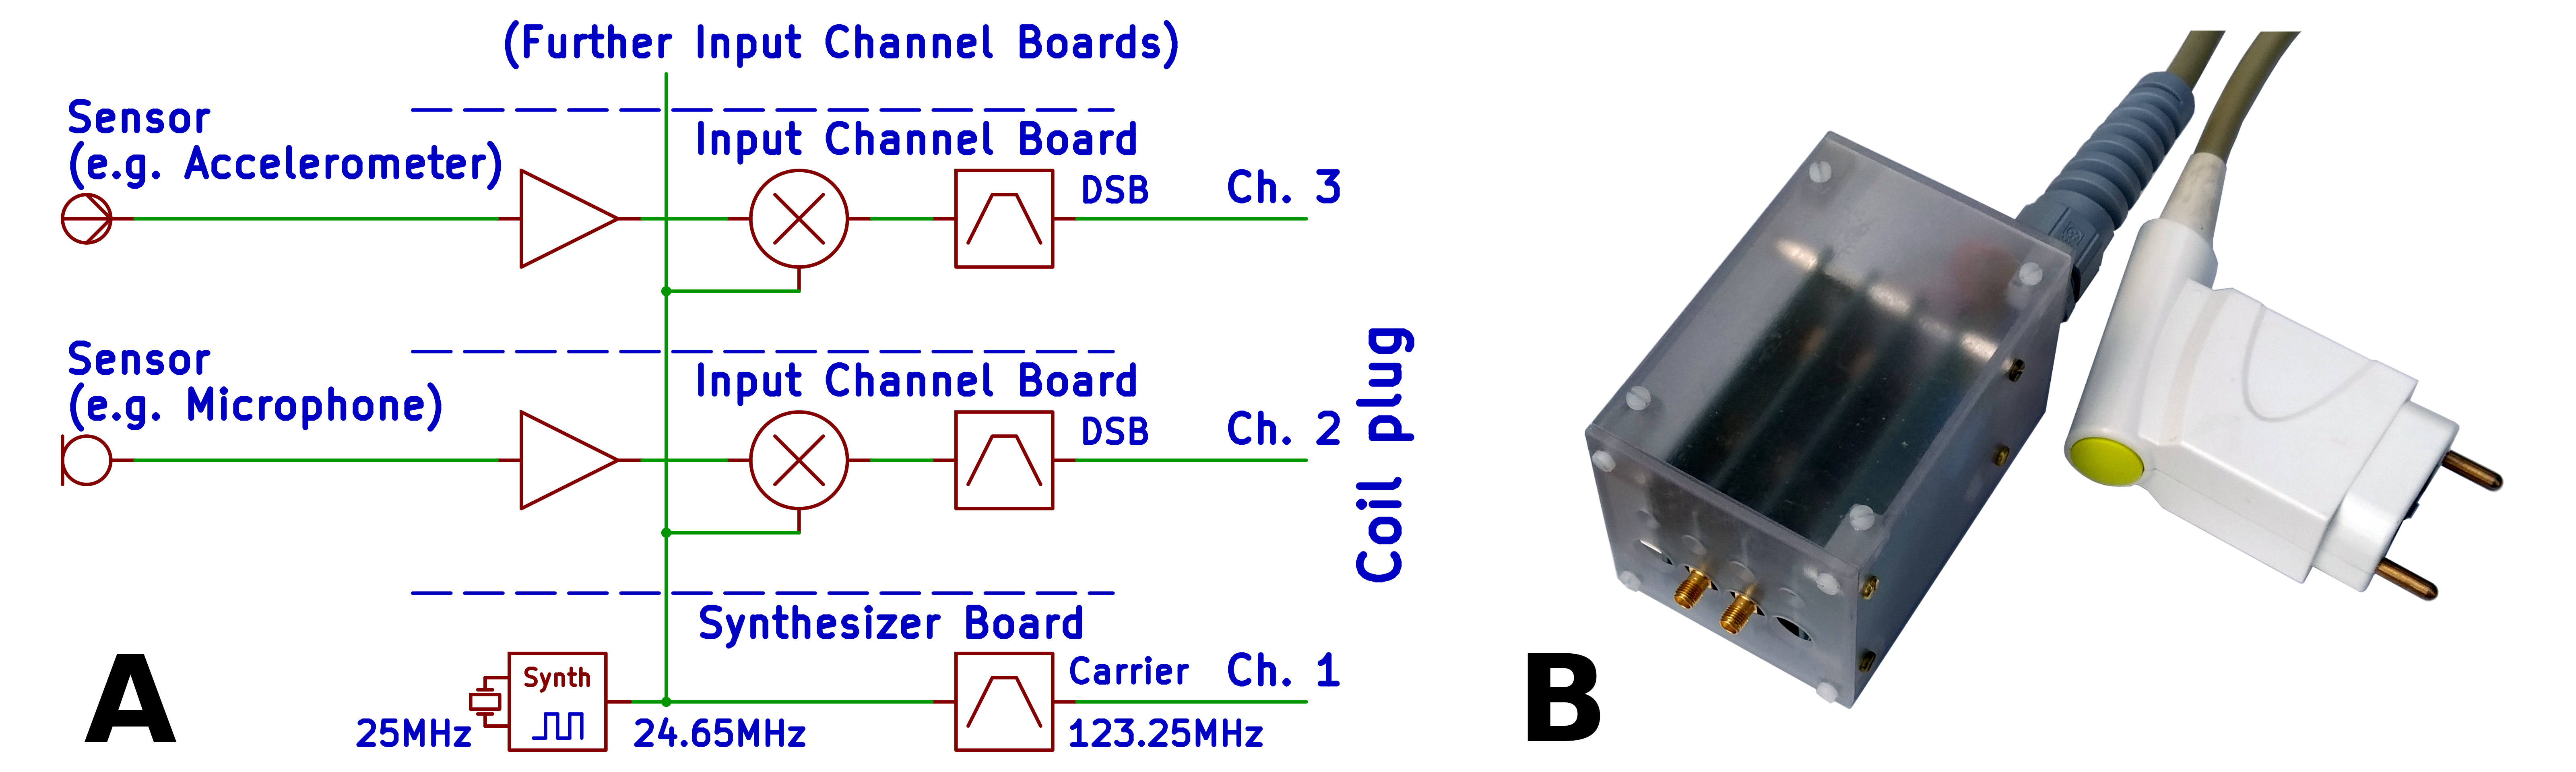
Simplified sketch (A) and photo (B) of a prototype modulator box. A quartz-controlled synthesizer is programmed to a frequency, which has an odd multiple within the scanner's Rx bandwidth. All input channel boards contain an amplifier for sensor signal conditioning, followed by a double-balanced modulator that generates a DSB signal with suppressed carrier. Channel 1 provides the unmodulated carrier. Signals are passed to the coil plug via bandpass filters to select the appropriate harmonic.
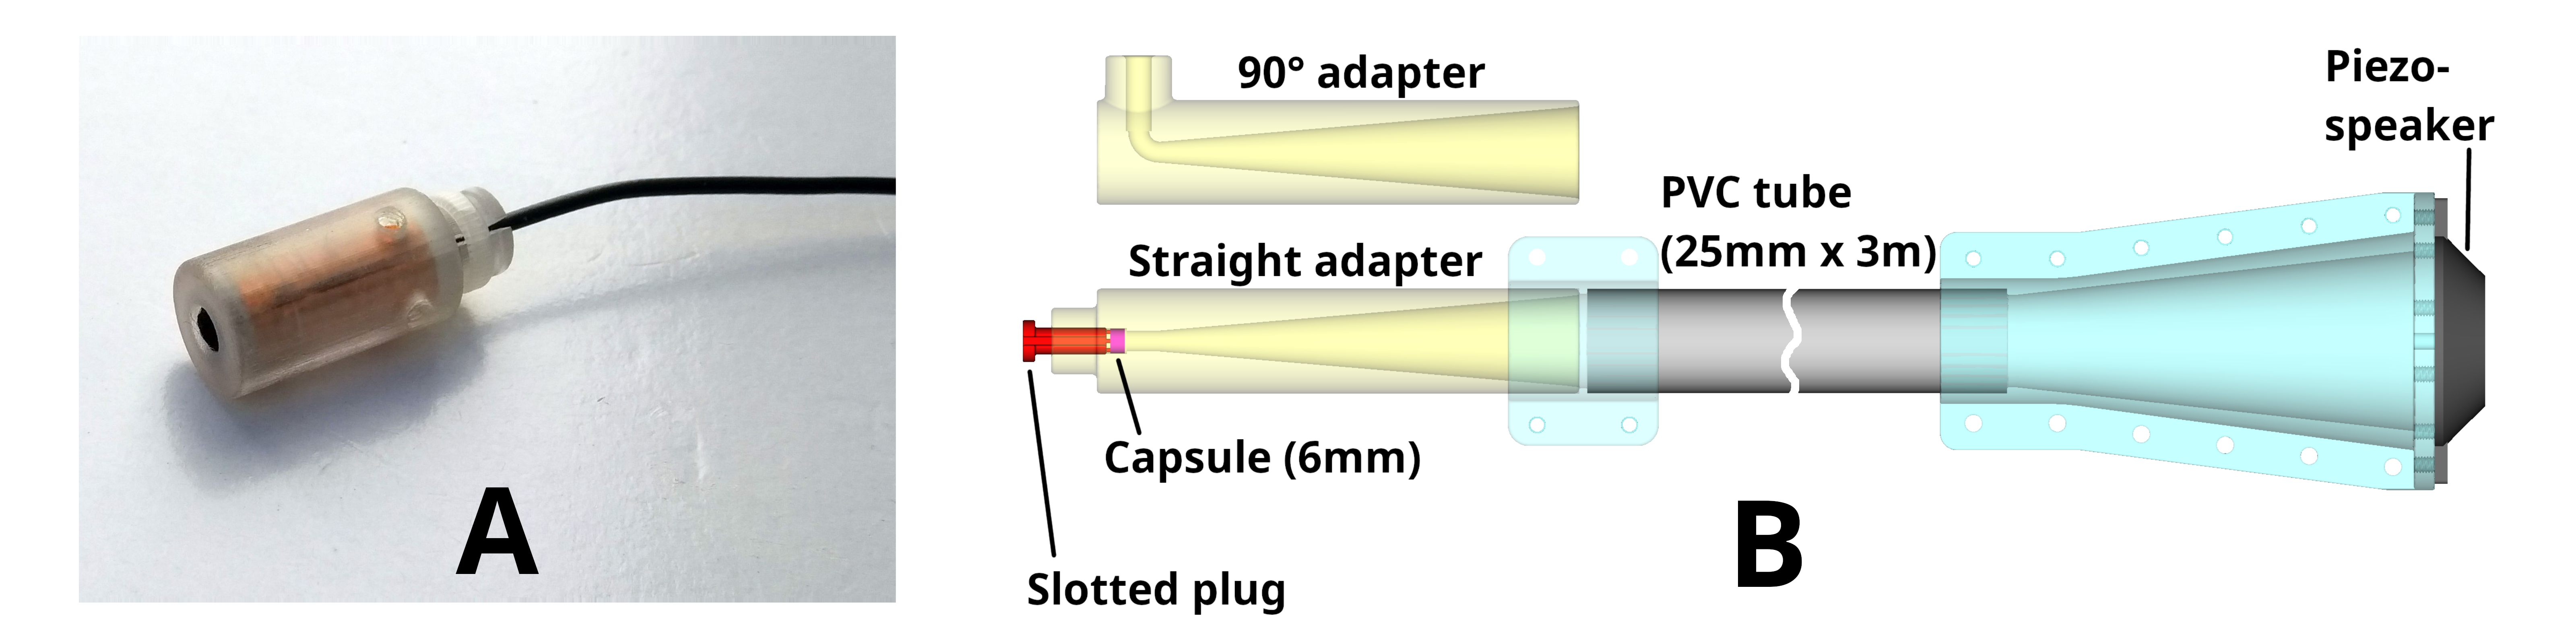
Figure 2:
(A) Two-piece 3D-printed microphone housing including a slotted Cu foil shield.
(B) Arrangement for testing microphone capsules at 3 T. A piezo speaker is attached to a 3-m PVC tube. 3D-printed adapters with a conical hole support robust 0° and 90° orientations of the electret capsule relative to B0. The slotted plug fixes it and supports the cable (not shown). Tests inside and outside the magnet bore were performed in the 950–1050 Hz range to avoid problems with standing waves in the tube.
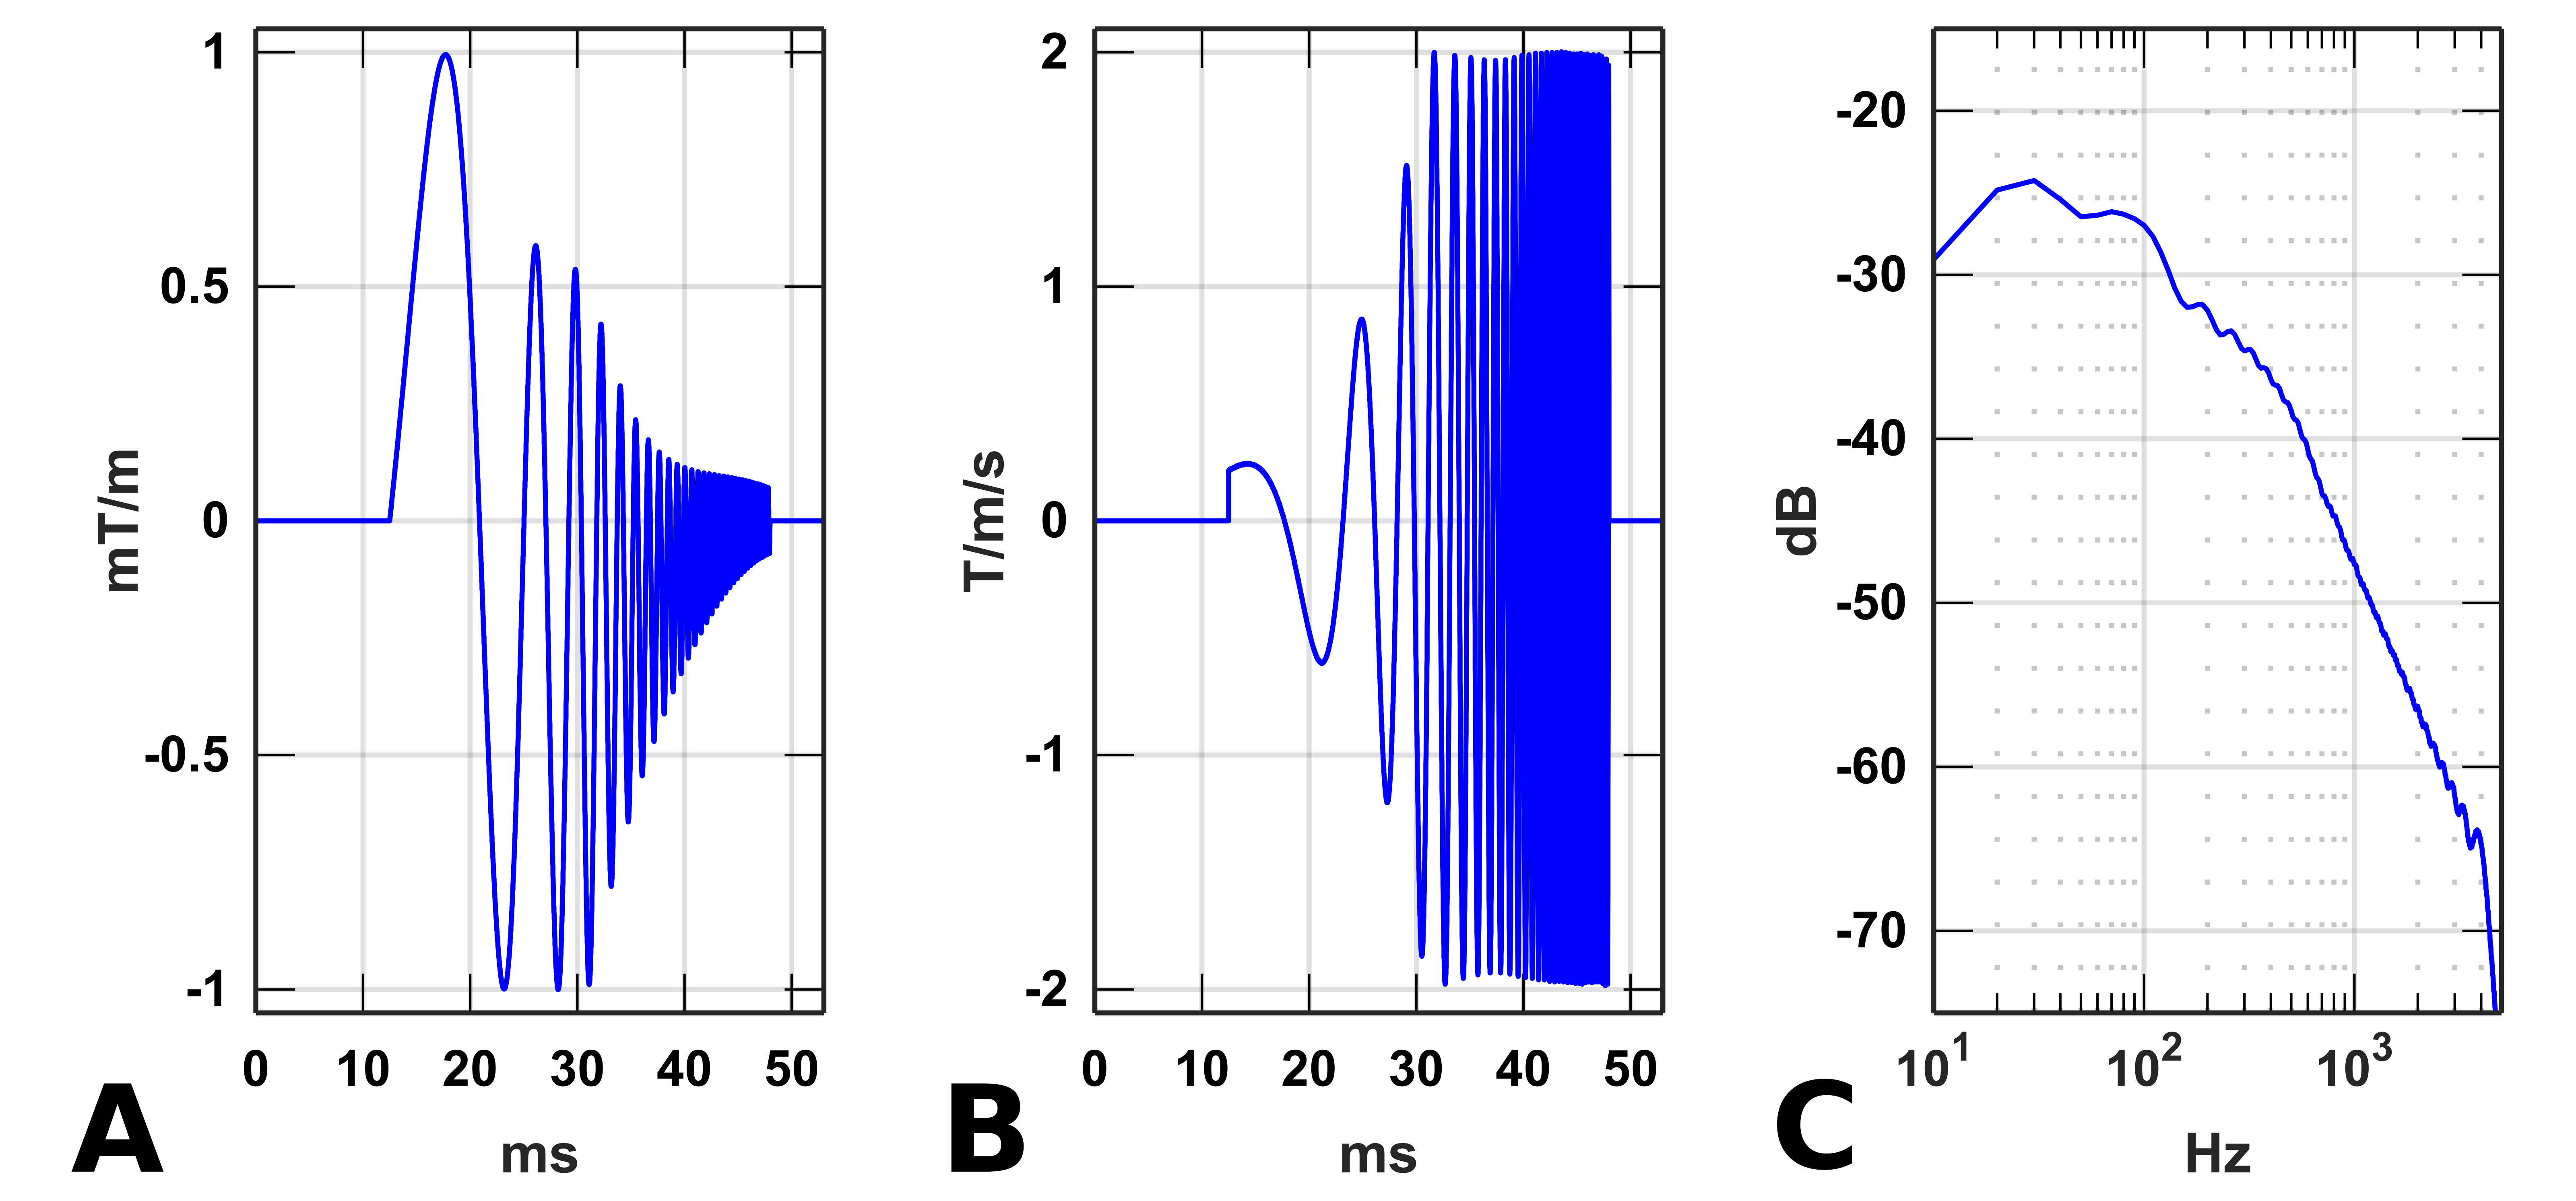
A DC-free waveform (A) derived from an exponential chirp (30–4500 Hz, duration 35.48 ms) is used as a broadband excitation signal for the gradient coil to determine the GTF. The corresponding slew rate and the magnitude frequency spectrum are shown in (B) and (C), respectively.
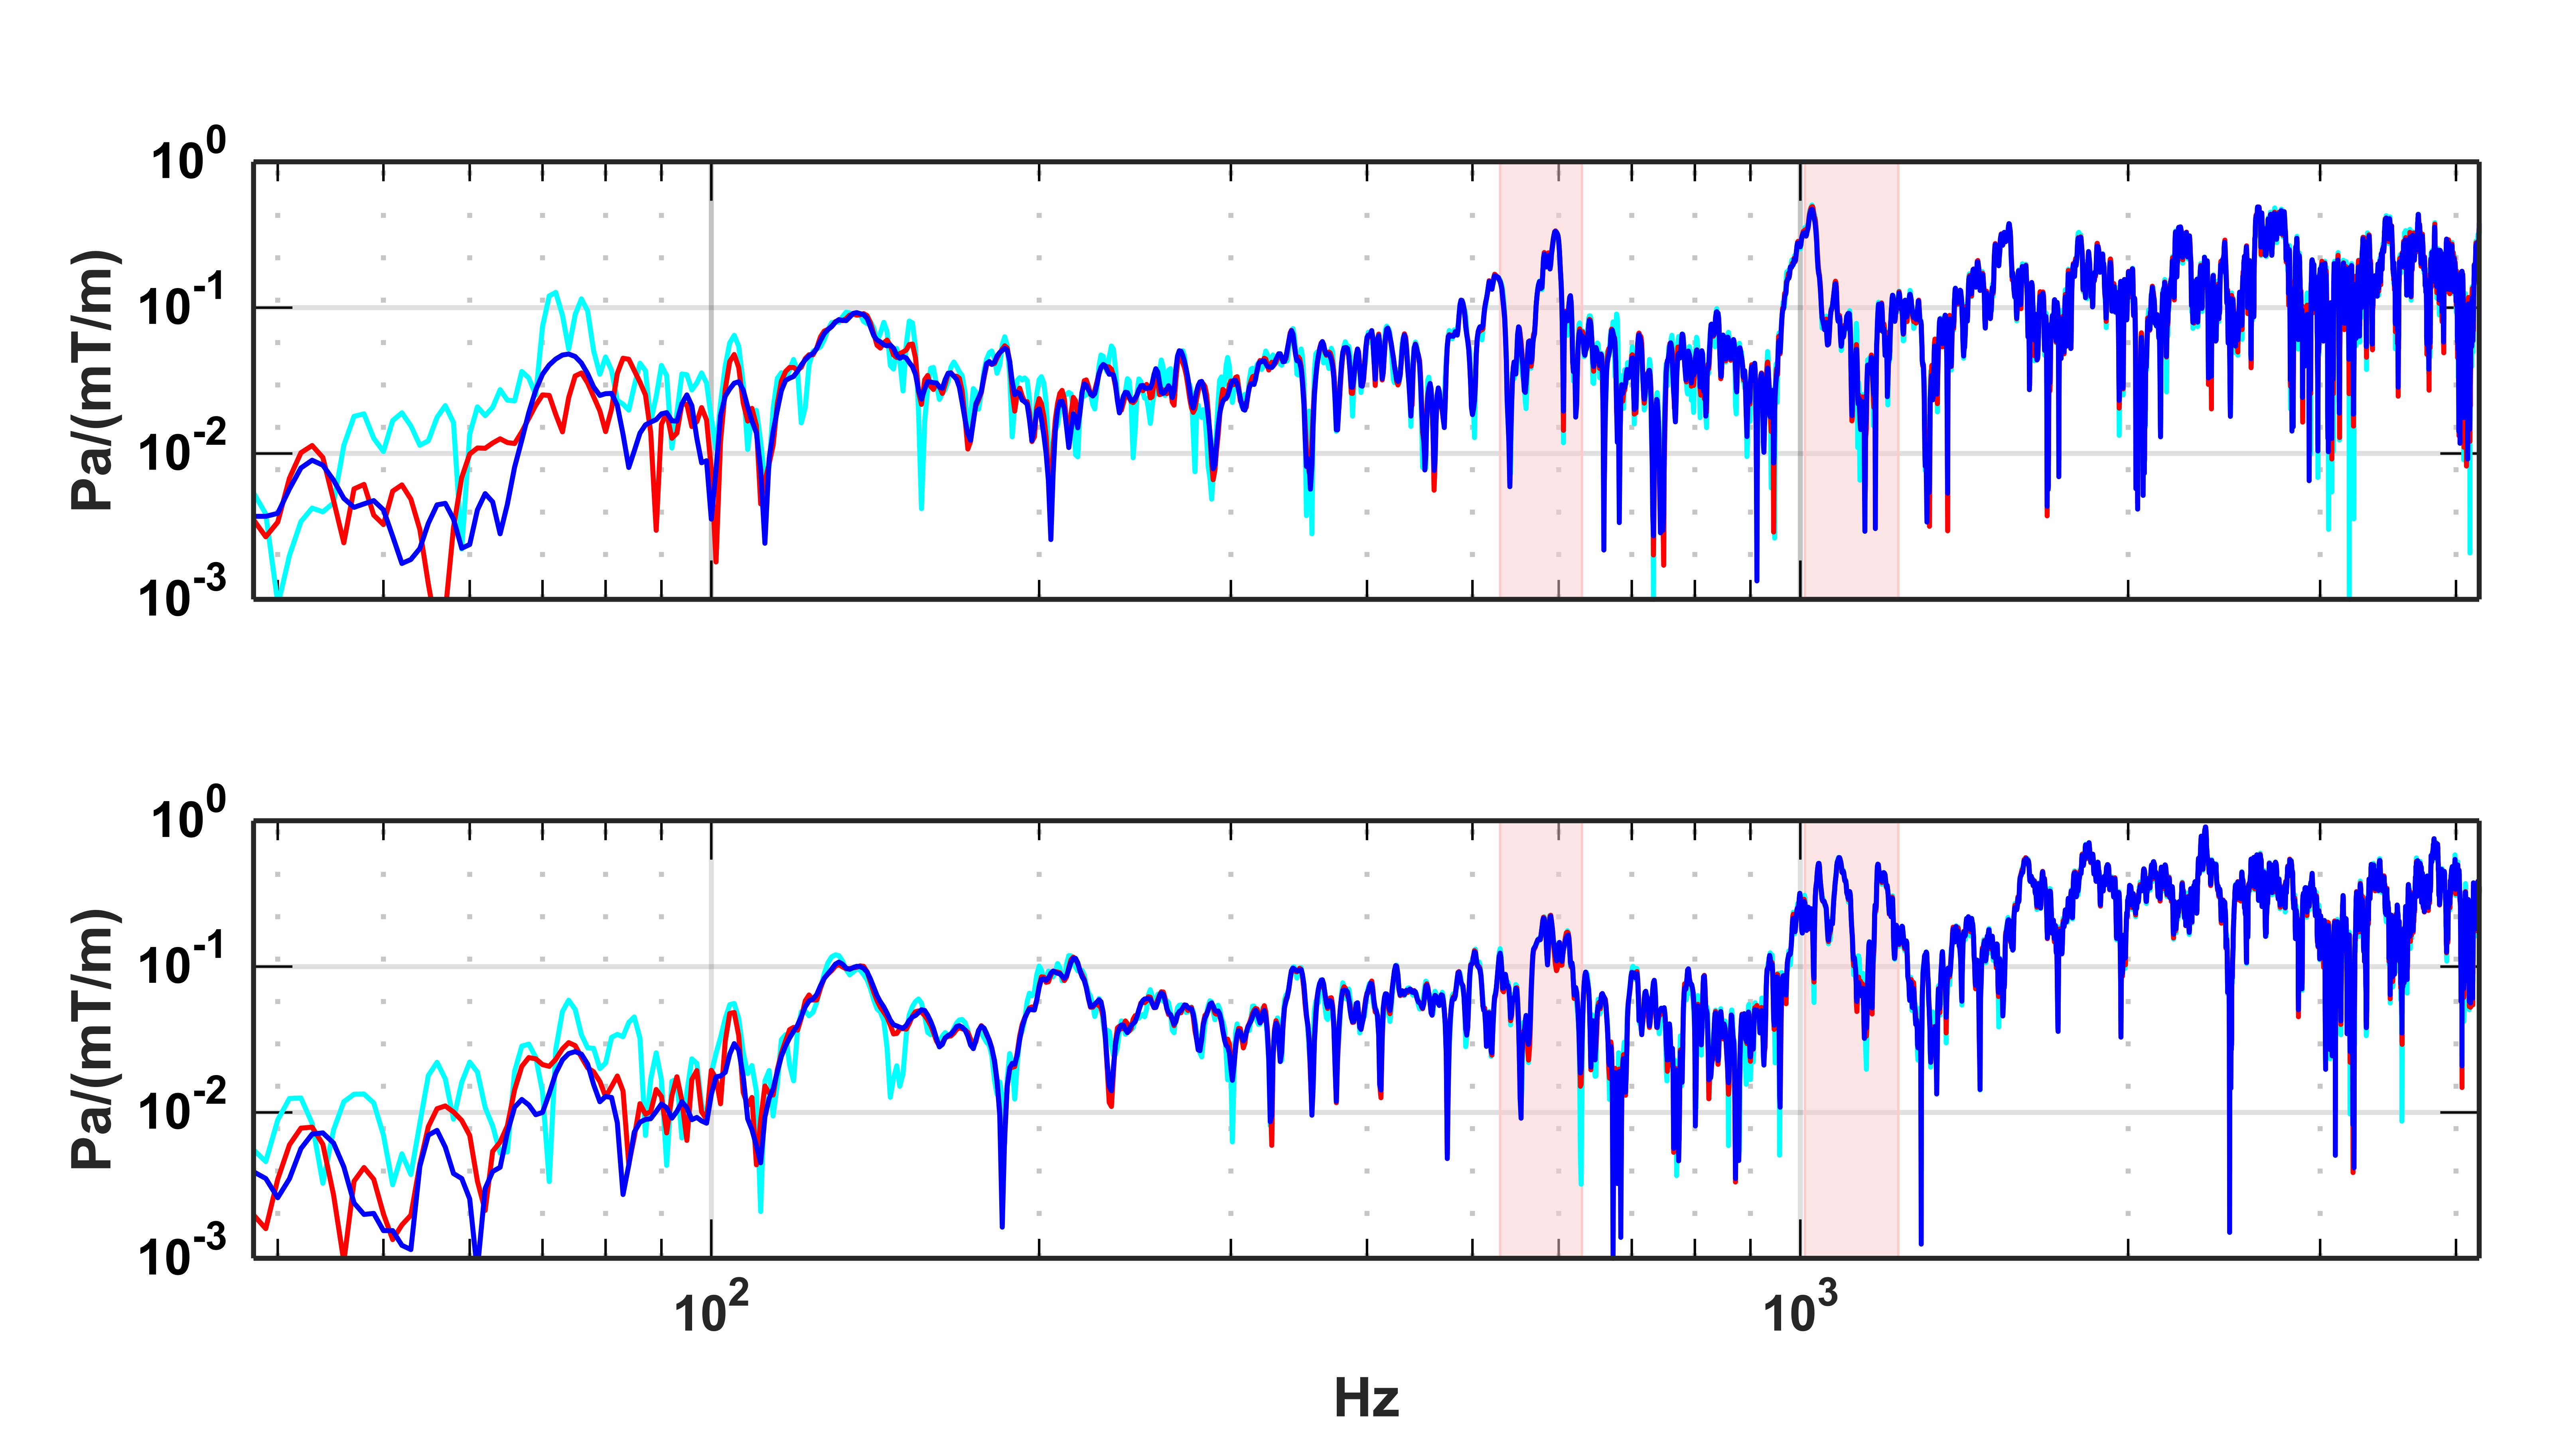
Gradient-to-acoustic transfer functions (magnitude of the averaged complex transfer functions along x, y, and z) at microphone positions near the center and entrance of the magnet bore (gradient amplitude per axis 10 mT/m, TR 885 ms, acqusition time 320 ms). Cyan, red and blue lines represent results with 1, 10, and 100 averages, respectively. Forbidden bands are highlighted by red shading. Calibration was performed outside the magnet with a reference sound pressure of 1 Pa at 1 kHz.
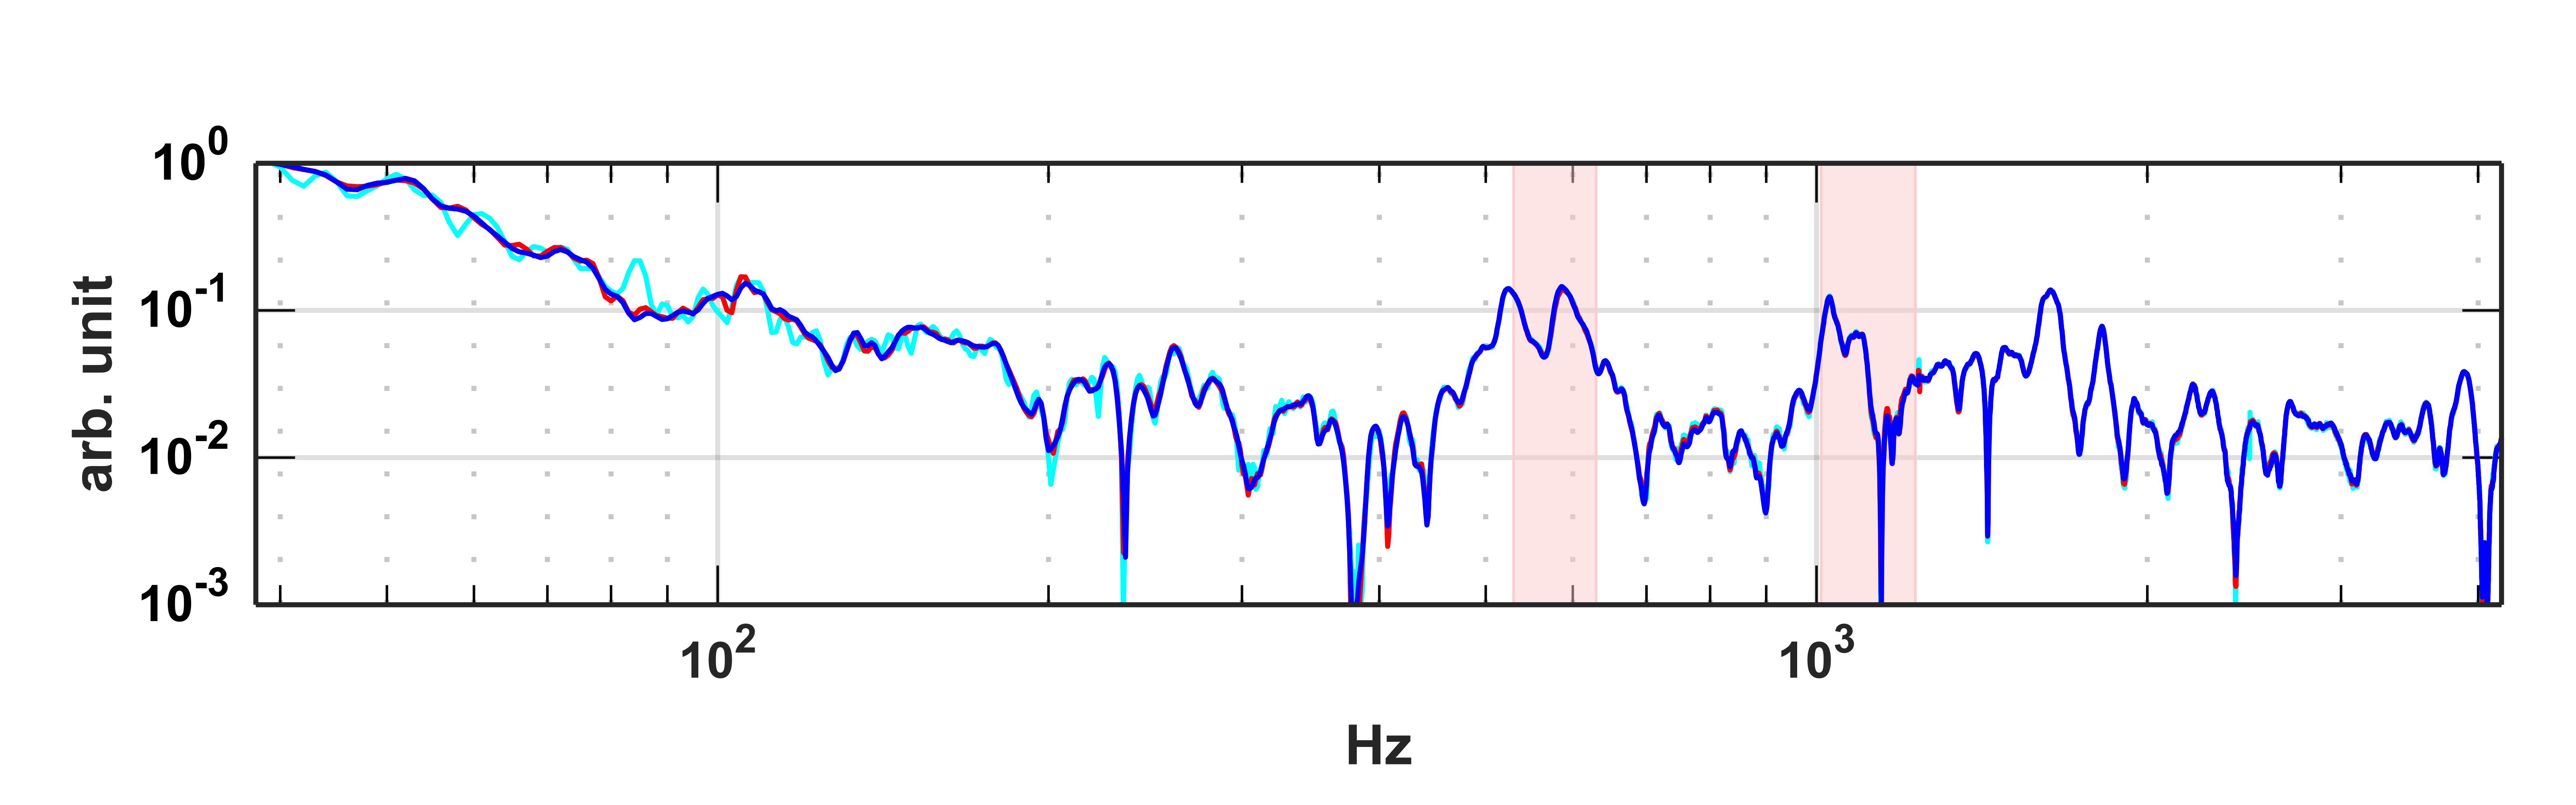
Uncalibrated gradient-to-displacement transfer function which was acquired simultaneously with the acoustic GTFs depicted in Figure 4 (bottom row), other specifications as described there. The accelerometer was attached to the bore wall with beeswax (approximately at 10:30 clock position, 10 cm distant from the bore entrance). The displacement signals were obtained by integrating the accelerations twice.