0901
Automatic estimation of T1, T2, T1ρ and fat fraction in calf muscles for patients with diabetic peripheral neuropathy1Bernard and Irene Schwartz Center for Biomedical Imaging, Department of Radiology, New York University Grossman School of Medicine, New York, NY, United States, 2Center for Advanced Imaging Innovation and Research (CAI2R), Department of Radiology, New York University Grossman School of Medicine, New York, NY, United States, 3Vilcek Institute of Graduate Biomedical Sciences, New York University Grossman School of Medicine, New York, NY, United States, 4Medical College of Wisconsin, Milwaukee, WI, United States, 5Department of Physical Therapy, New York University, New York, NY, United States
Synopsis
Keywords: Muscle, Diabetes
Motivation: Quantitative MRI is used for muscle parameter mapping, but single-parameter techniques and manual muscle segmentations take long.
Goal(s): Develop an automatic processing pipeline to generate parameter maps from 3D MRF and fat fraction images to extract quantitative biomarkers.
Approach: 3D MRF and fat fraction images were acquired on patients with diabetic peripheral neuropathy, deep-learning methods and post-processing were used to generate muscle masks and parameter maps before and after exercise intervention.
Results: Automatic muscle segmentation and 3D MRF are able to generate quantitative fat fraction, T1, T2, T1ρ volumetric maps within muscle ROIs for tracking changes in patients before and after exercise intervention.
Impact: Both the 3D MRF sequence and automatic muscle extraction help reduce acquisition and post-processing time, allowing faster assessment of treatment response in diabetic patients.
Introduction
Diabetic peripheral neuropathy (DPN) develops in type 2 diabetes patients, characterized by damage of the peripheral nerves causing muscle degeneration in the lower leg 1,2. Studies have shown that supervised exercise intervention can improve muscle strength3 that may be associated with reduced T1 and T2 relaxation times and fat fraction4,5. Quantitative MRI can detect changes in the muscles using parameter mapping, but conventional single-parameter techniques require long acquisition times, while individual muscle groups can be tedious to analyze. 3D-MRF is a fast, reproducible technique to measure T1, T2, T1ρ volumetric maps in a significant area of the lower leg in a single scan within a clinically feasible time 6. Furthermore, automatic segmentation reduces inter-reader variability and time-consuming manual annotation, making muscle-specific analysis possible in 3D multi-slice data feasible. In this pilot study, we (1) use a 3D-MRF sequence to extract T1, T2, T1ρ volumetric maps in the lower leg before and after exercise intervention, (2) use an automatic deep-learning based muscle segmentation pipeline to define muscle-specific regions of interest, and (3) attempt to determine with quantitative MRI whether intervention improves muscle tissue composition.Method
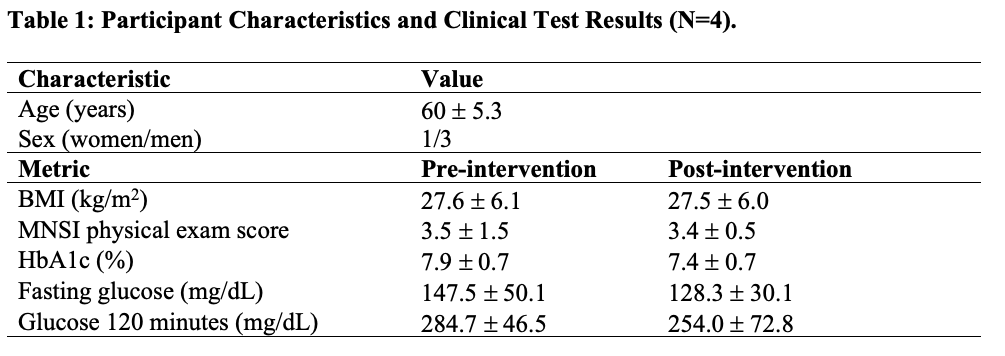
In this IRB approved study, 4 patients with diagnosed type-2 diabetes and symptoms such as lack of monofilament and vibration perception were recruited (Table 1). MRI scans were acquired on a Siemens 3T (MAGNETOM Prisma) scanner using a product 15-channel Tx/Rx lower extremity coil. Scans were performed before and after a 10-week personalized exercise intervention program supervised by a physical therapist that included moderate-intensity aerobic and resistance components7.A recently proposed 3D-MRF 6 sequence was acquired on each patient, which can achieve submillimetric proton density (PD) image and T1, T2, T1ρ volumetric maps in under 9 mins. The measured signal fingerprint was compressed using singular value decomposition and matched using an iterative approach to simulated MR fingerprints for possible T1, T2, T1ρ values, which were computed using extended phase graphs. A previous method based on random matrix theory was used to denoise the MRF parameter maps8. To measure fat fraction, a Dixon-based proton 3D gradient echo sequence was acquired and the proton density fat fraction maps were calculated using the Hierarchiacal IDEAL method9. Additionally, PSIF images were acquired for anatomical reference.
To measure fat fraction and T1, T2, T1ρ values within each muscle compartment, a previously trained convolutional neural network was used to infer segmentation masks on the gastrocnemius medialis (GM), gastrocnemius lateralis (GL), and soleus (SOL) muscles on each subject before and after intervention on the PSIF images10. Post-processing included retaining the largest connected component to minimize errors. SPM was used to register the gradient echo images for the fat fraction estimation to the PSIF images11. A multimodal registration pipeline was used to register the proton density images to the PSIF and applied to all MRF maps. Obtained muscle masks were then applied to the T1, T2, T1ρ volumetric maps to compute mean metrics in each muscle.
Results
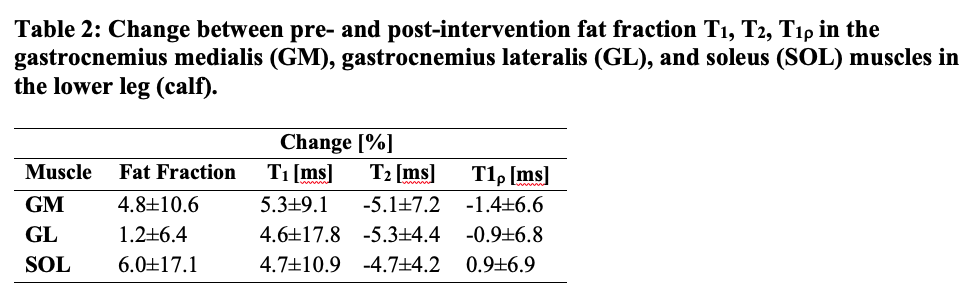
Figure 1 (row 1) shows that the automatic segmentation network delineated GM, GL, and SOL muscles on the PSIF images. Figure 1 (row 2) shows that the segmentations were aligned on the gradient echo derived fat fraction maps, which were registered to the PSIF images, thus enabling automatic estimation of fat fraction values in the three muscles. Figure 2 shows an example result of applying the denoising method on the MRF maps, resulting in enhanced SNR in the denoised images. Figure 3 shows a representative example of fat fraction, T1, T2, T1ρ in a patient before and after intervention. Table 2 shows a summary of change in fat fraction and relaxation times in the recruited cohort.Discussion
In this study we described an automatic method to extract clinically relevant biomarkers for patients with DPN to measure changes in their calf muscles before and after intervention. Relaxation times represent a range of muscle properties that reflect macromolecule makeup including proteins and membranes. A prior study showed prolonged T2 and increased fat fraction in diabetic peripheral neuropathy 12. The reduced T2 times observed following intervention in this study suggest a reduction of pathologic conditions in the muscle, although increased fat fraction after intervention appear to contradict this finding. Our previous work showed fat fraction reduction after intervention in the global leg cross-section (excluding the peripheral adipose and bones) but no significant difference in intramuscular fat fraction 4. Therefore, a larger cohort and inspection of the global cross-section may be needed to determine whether the results in this small study represent a consistent trend.Acknowledgements
No acknowledgement found.References
1. Tesfaye, S. & Selvarajah, D. Advances in the epidemiology, pathogenesis and management of diabetic peripheral neuropathy. Diabetes Metab Res Rev 28 Suppl 1, 8-14 (2012). https://doi.org:10.1002/dmrr.2239
2. Boulton, A. J. et al. Diabetic neuropathies: a statement by the American Diabetes Association. Diabetes Care 28, 956-962 (2005). https://doi.org:10.2337/diacare.28.4.956
3. Kruse, R. L., Lemaster, J. W. & Madsen, R. W. Fall and balance outcomes after an intervention to promote leg strength, balance, and walking in people with diabetic peripheral neuropathy: "feet first" randomized controlled trial. Phys Ther 90, 1568-1579 (2010). https://doi.org:10.2522/ptj.20090362
4. Brown, R. et al. Lower extremity MRI following 10-week supervised exercise intervention in patients with diabetic peripheral neuropathy. BMJ Open Diabetes Res Care 9 (2021). https://doi.org:10.1136/bmjdrc-2021-002312
5. Patten, C., Meyer, R. A. & Fleckenstein, J. L. T2 mapping of muscle. Semin Musculoskelet Radiol 7, 297-305 (2003). https://doi.org:10.1055/s-2004-815677
6. Sharafi, A., Zibetti, M. V. W., Chang, G., Cloos, M. & Regatte, R. R. 3D magnetic resonance fingerprinting for rapid simultaneous T1, T2, and T1rho volumetric mapping of human articular cartilage at 3 T. NMR Biomed 35, e4800 (2022). https://doi.org:10.1002/nbm.4800
7. Brown, R., Khegai, O. & Parasoglou, P. Magnetic Resonance Imaging of Phosphocreatine and Determination of BOLD Kinetics in Lower Extremity Muscles using a Dual-Frequency Coil Array. Sci Rep 6, 30568 (2016). https://doi.org:10.1038/srep30568
8. Veraart, J. et al. Denoising of diffusion MRI using random matrix theory. Neuroimage 142, 394-406 (2016). https://doi.org:10.1016/j.neuroimage.2016.08.016
9. Tsao, J. & Jiang, Y. in Proc Intl Soc Magn Reson Med. 653.
10. Shah, J. T. et al. Deep Learning and Fat Fraction Based Analysis of Calf MRI in Diabetic Patients Following Exercise Intervention.
11. Ashburner, J. SPM: a history. Neuroimage 62, 791-800 (2012). https://doi.org:10.1016/j.neuroimage.2011.10.025
Figures
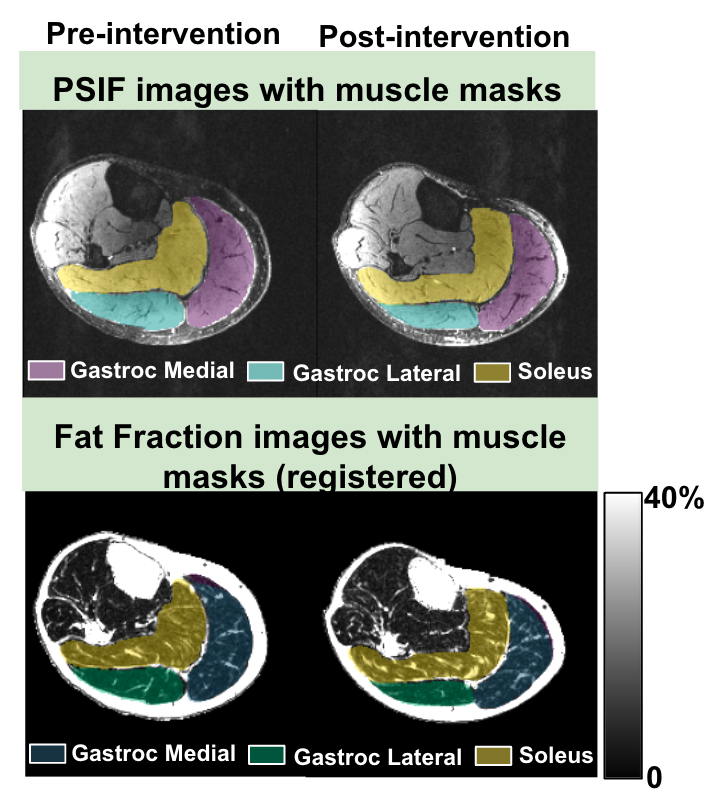
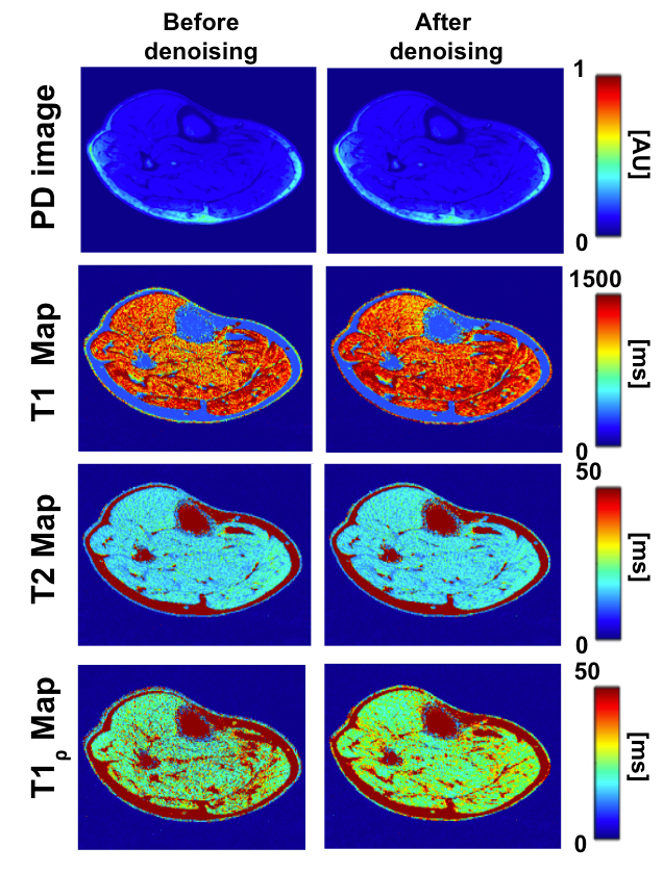
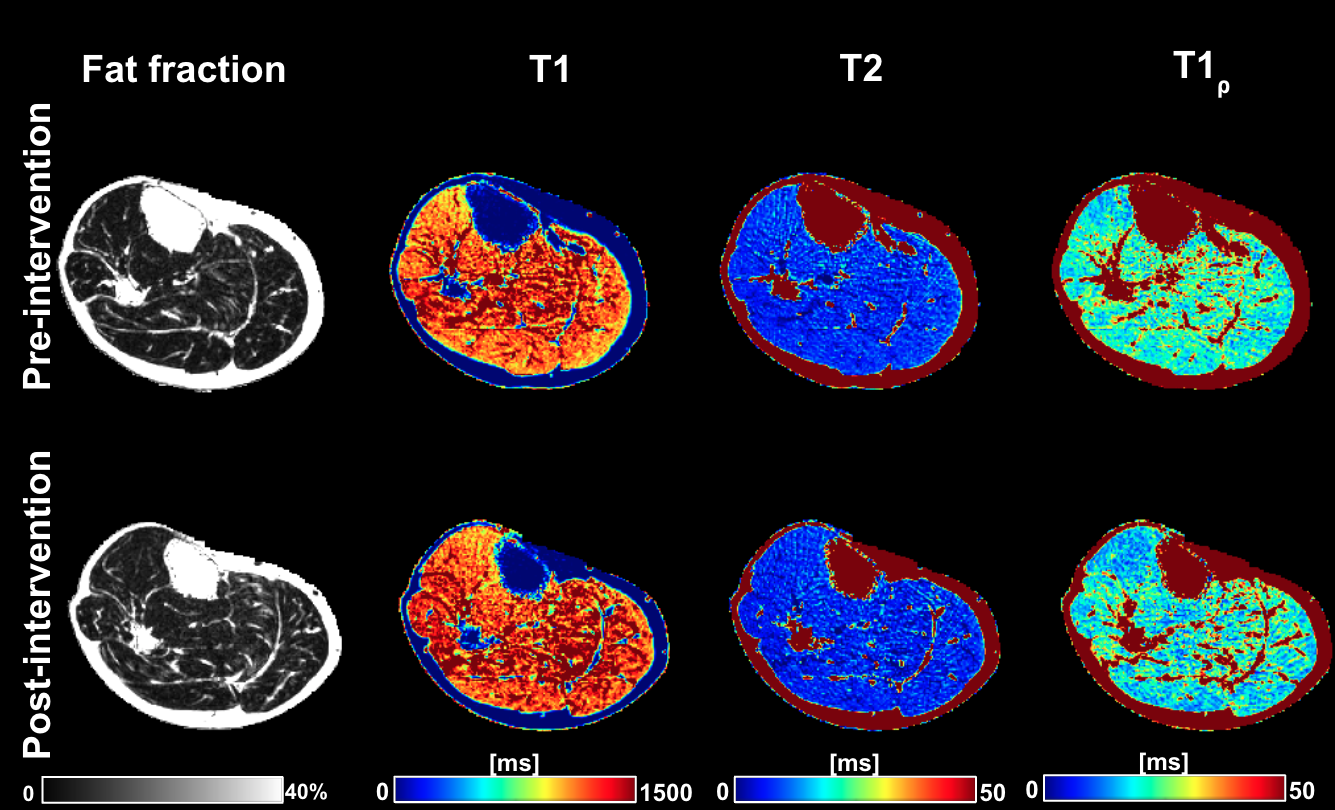
Figure 3: Representative fat fraction and relaxometry maps from the same patient before and after intervention: The 3D MRF sequence, fat fraction map generation and the image processing techniques result in parameter maps. As anticipated, T2 and T1ρ maps tend to show reduced values, however, the T1 map has larger areas of higher values indicating a global increase in T1.