0898
Potassium (39K) & Sodium (23Na) MRI of dystrophic skeletal muscle tissue at 7T: impact of fatty infiltration on measured tissue ion concentrations1Institute of Radiology,University Hospital Erlangen, Friedrich-Alexander-Universität Erlangen-Nürnberg (FAU), Erlangen, Germany, 2Department of Neurology, Friedrich-Alexander-Universität Erlangen-Nürnberg (FAU), Erlangen, Germany, 3NMR Laboratory, Neuromuscular Investigation Center, Institute of Myology, Paris, France, 4Division of Medical Physics in Radiology, German Cancer Research Center (DKFZ), Heidelberg, Germany
Synopsis
Keywords: Muscle, Muscle
Motivation: Combined 23Na/39K MRI at 7T can highlight ion disturbances related to patho-physiological processes within dystrophic muscle tissue. However, quantification of the apparent tissue potassium concentration (aTPC) using 39K MRI is challenging due to low signal-to-noise and rapid signal decay.
Goal(s): Here, we investigated the feasibility of quantitative 39K MRI in dystrophic muscle tissue.
Approach: The lower leg of 14 FSHD patients and 11 healthy controls was examined using 39K/23Na and 1H MRI at 7T.
Results: We found a strongly reduced aTPC in fat infiltrated muscles. After correction for reduced potassium concentration in fat, aTPC values in dystrophic muscles were similar to healthy muscles.
Impact: Potassium concentration in fatty tissue is strongly reduced compared to healthy skeletal muscle tissue. This has to be considered when investigating and interpreting aTPC values measured with 39K MRI in fat-replaced skeletal muscle tissue.
Introduction
Sodium and potassium ions play an essential role in the excitability of muscle cells due to their concentration gradients between the intracellular and extracellular space, which is maintained by the Na+-K+-ATPase. Various diseases, including muscular dystrophies, have been reported to alter the ATPase activity1. Sodium (23Na) MRI has already been successfully applied to detect altered apparent tissue sodium concentrations (aTSC) in muscle tissue of muscular dystrophy patients such as Facio-scapulo-humeral muscular dystrophy (FSHD)2. A combination with 39K MRI could provide a comprehensive insight into the ion homeostasis of dystrophic skeletal muscle tissue. However, 39K MRI suffers from a very low signal-to-noise ratio and a very rapid biexponential signal decay (T2short* = 1.2 ms, T2long* = 8.1 ms in muscle tissue3), making quantification of the apparent tissue potassium concentration (aTPC) challenging. So far, quantitative 39K MRI has mostly been applied to healthy skeletal muscle tissue3-5.Here, we examined the lower leg of FSHD patients using quantitative 39K MRI together with 23Na and 1H MRI at 7T. We investigated the impact of fat infiltration on the measured aTPC, and compared the resulting aTPC/aTSC values to healthy muscle tissue.
Methods
14 patients (6f/8m, mean age 47.7±14.0 years) with genetically proven FSHD and 11 healthy controls (4f/6m, mean age 45.4±13.5 years) were examined using a whole-body 7T MRI system (Magnetom Terra, Siemens Healthcare GmbH). 23Na/39K MRI data was acquired using a double-resonant 23Na/39K birdcage RF coil (Rapid Biomedical GmbH) and a 3D density-adapted radial readout scheme with cubic field-of-view (parameters see Table 1). During examinations, the leg was lying on a five-compartment reference container filled with different combinations of NaCl and K2HPO4 solution. In addition, T1 weighted water-excitation, and multi-echo spin-echo (MESE) 1H MRI data were acquired using a 28-channel 1H knee RF coil.Based on the T1 weighted 1H images, seven individual muscle regions and subcutaneous adipose tissue were segmented6. Using these segmentation masks, a region-based partial volume correction (PVC) was applied to the 39K/23Na MRI data4. Furthermore, a correction for relaxation biases was applied. aTPC/ aTSC values were then calculated by calibrating the 39K/23Na MRI signals based on the reference compartments using a linear regression. Median water T2 relaxation times (T2w) and fat fraction (FF) values were extracted from the MESE 1H MRI data using an extended phase-graph (EPG) fit7.
Results
Figure 1 shows 39K/23Na MR images after correction of relaxation effects together with T1 weighted 1H images and T2w maps. 39K MRI was highly sensitive to fat infiltration and clearly depicted the muscle degeneration. Particularly, even in regions with normally appearing or increased 23Na MR signal, a strongly reduced 39K MRI signal was observed.Figure 2 shows the dependence of the measured aTSC and aTPC values after PVC on the FF derived from the EPG fit. While aTSC values were increased for medium FFs and decreased for very high FFs, aTPC values strongly decreased with FF already at medium FF values. For very high FFs (> 80%), the mean aTPC value was close to zero (4.8 ± 2.9 mM). A comparison between the quantitative values measured in FSHD patients and healthy controls before and after fat correction (up to a FF of 60%) is shown in Figure 3. FF values were significantly increased in GM and TA muscles in FSHD patients compared to controls (p=0.046/0.008, Wilcoxon rank-sum test), while T2w values remained at a normal level. Fat corrected aTSC values were significantly increased in TA and EDL (p=0.033/0.010). After fat correction, aTPC values were in a similar range as corresponding values in healthy muscle tissue, and no significant differences were found.
Discussion
Due to the low potassium concentration in fat, aTPC showed a stronger dependence on fat infiltration than aTSC. To assess the aTPC in the remaining muscle tissue, a fat correction was performed analogously to the correction of aTSC as reported before2,8. For this correction, we used FF values resulting from the EPG T2w fit as no optimized Dixon-based fat-water separation was available at 7T. However, FF values resulting from EPG T2w fit might be biased, especially in regions of strong edema and high fat infiltration. As quantitative 1H MRI approaches are generally more challenging at ultra-high field (e.g. due to inhomogeneities in B0/B1), it might be advantageous to combine 39K/23Na MRI at 7T with more stable and reliable 1H MRI sequences for skeletal muscles at 3T.Conclusion
Quantitative combined 39K/23Na MRI of dystrophic skeletal muscles is feasible at 7T, however, it requires the correction of reduced ion concentrations in fatty tissue to assess changes in remaining muscle tissue.Acknowledgements
No acknowledgement found.References
1.Clausen T. Na+-K+ pump regulation and skeletal muscle contractility. Physiol Rev. 2003;83(4):1269-324.
2.Gerhalter T, Marty B, Gast LV, et al. Quantitative (1)H and (23)Na muscle MRI in Facioscapulohumeral muscular dystrophy patients. J Neurol. 2021;268(3):1076-1087.
3.Gast LV, Volker S, Utzschneider M, et al. Combined imaging of potassium and sodium in human skeletal muscle tissue at 7 T. Magn Reson Med. 2021;85(1):239-253.
4.Gast LV, Baier LM, Chaudry O, et al. Assessing muscle-specific potassium concentrations in human lower leg using potassium magnetic resonance imaging. NMR Biomed. 2022:e4819.
5.Gast LV, Baier LM, Meixner CR, et al. MRI of Potassium and Sodium Enables Comprehensive Analysis of Ion Perturbations in Skeletal Muscle Tissue After Eccentric Exercise. Invest Radiol. 2022.
6.Santini F, Wasserthal J, Agosti A, et al. Deep Anatomical Federated Network (Dafne): an open client/server framework for the continuous collaborative improvement of deeplearning-based medical image segmentation. arXiv. 2023;2302.06352
7. Marty B, Baudin PY, Reyngoudt H, et al. Simultaneous muscle water T2 and fat fraction mapping using transverse relaxometry with stimulated echo compensation. NMR Biomed. 2016;29(4):431-43.
8. Gerhalter T, Gast LV, Marty B, et al. (23) Na MRI depicts early changes in ion homeostasis in skeletal muscle tissue of patients with duchenne muscular dystrophy. J Magn Reson Imaging. 2019;50(4):1103-1113.
Figures
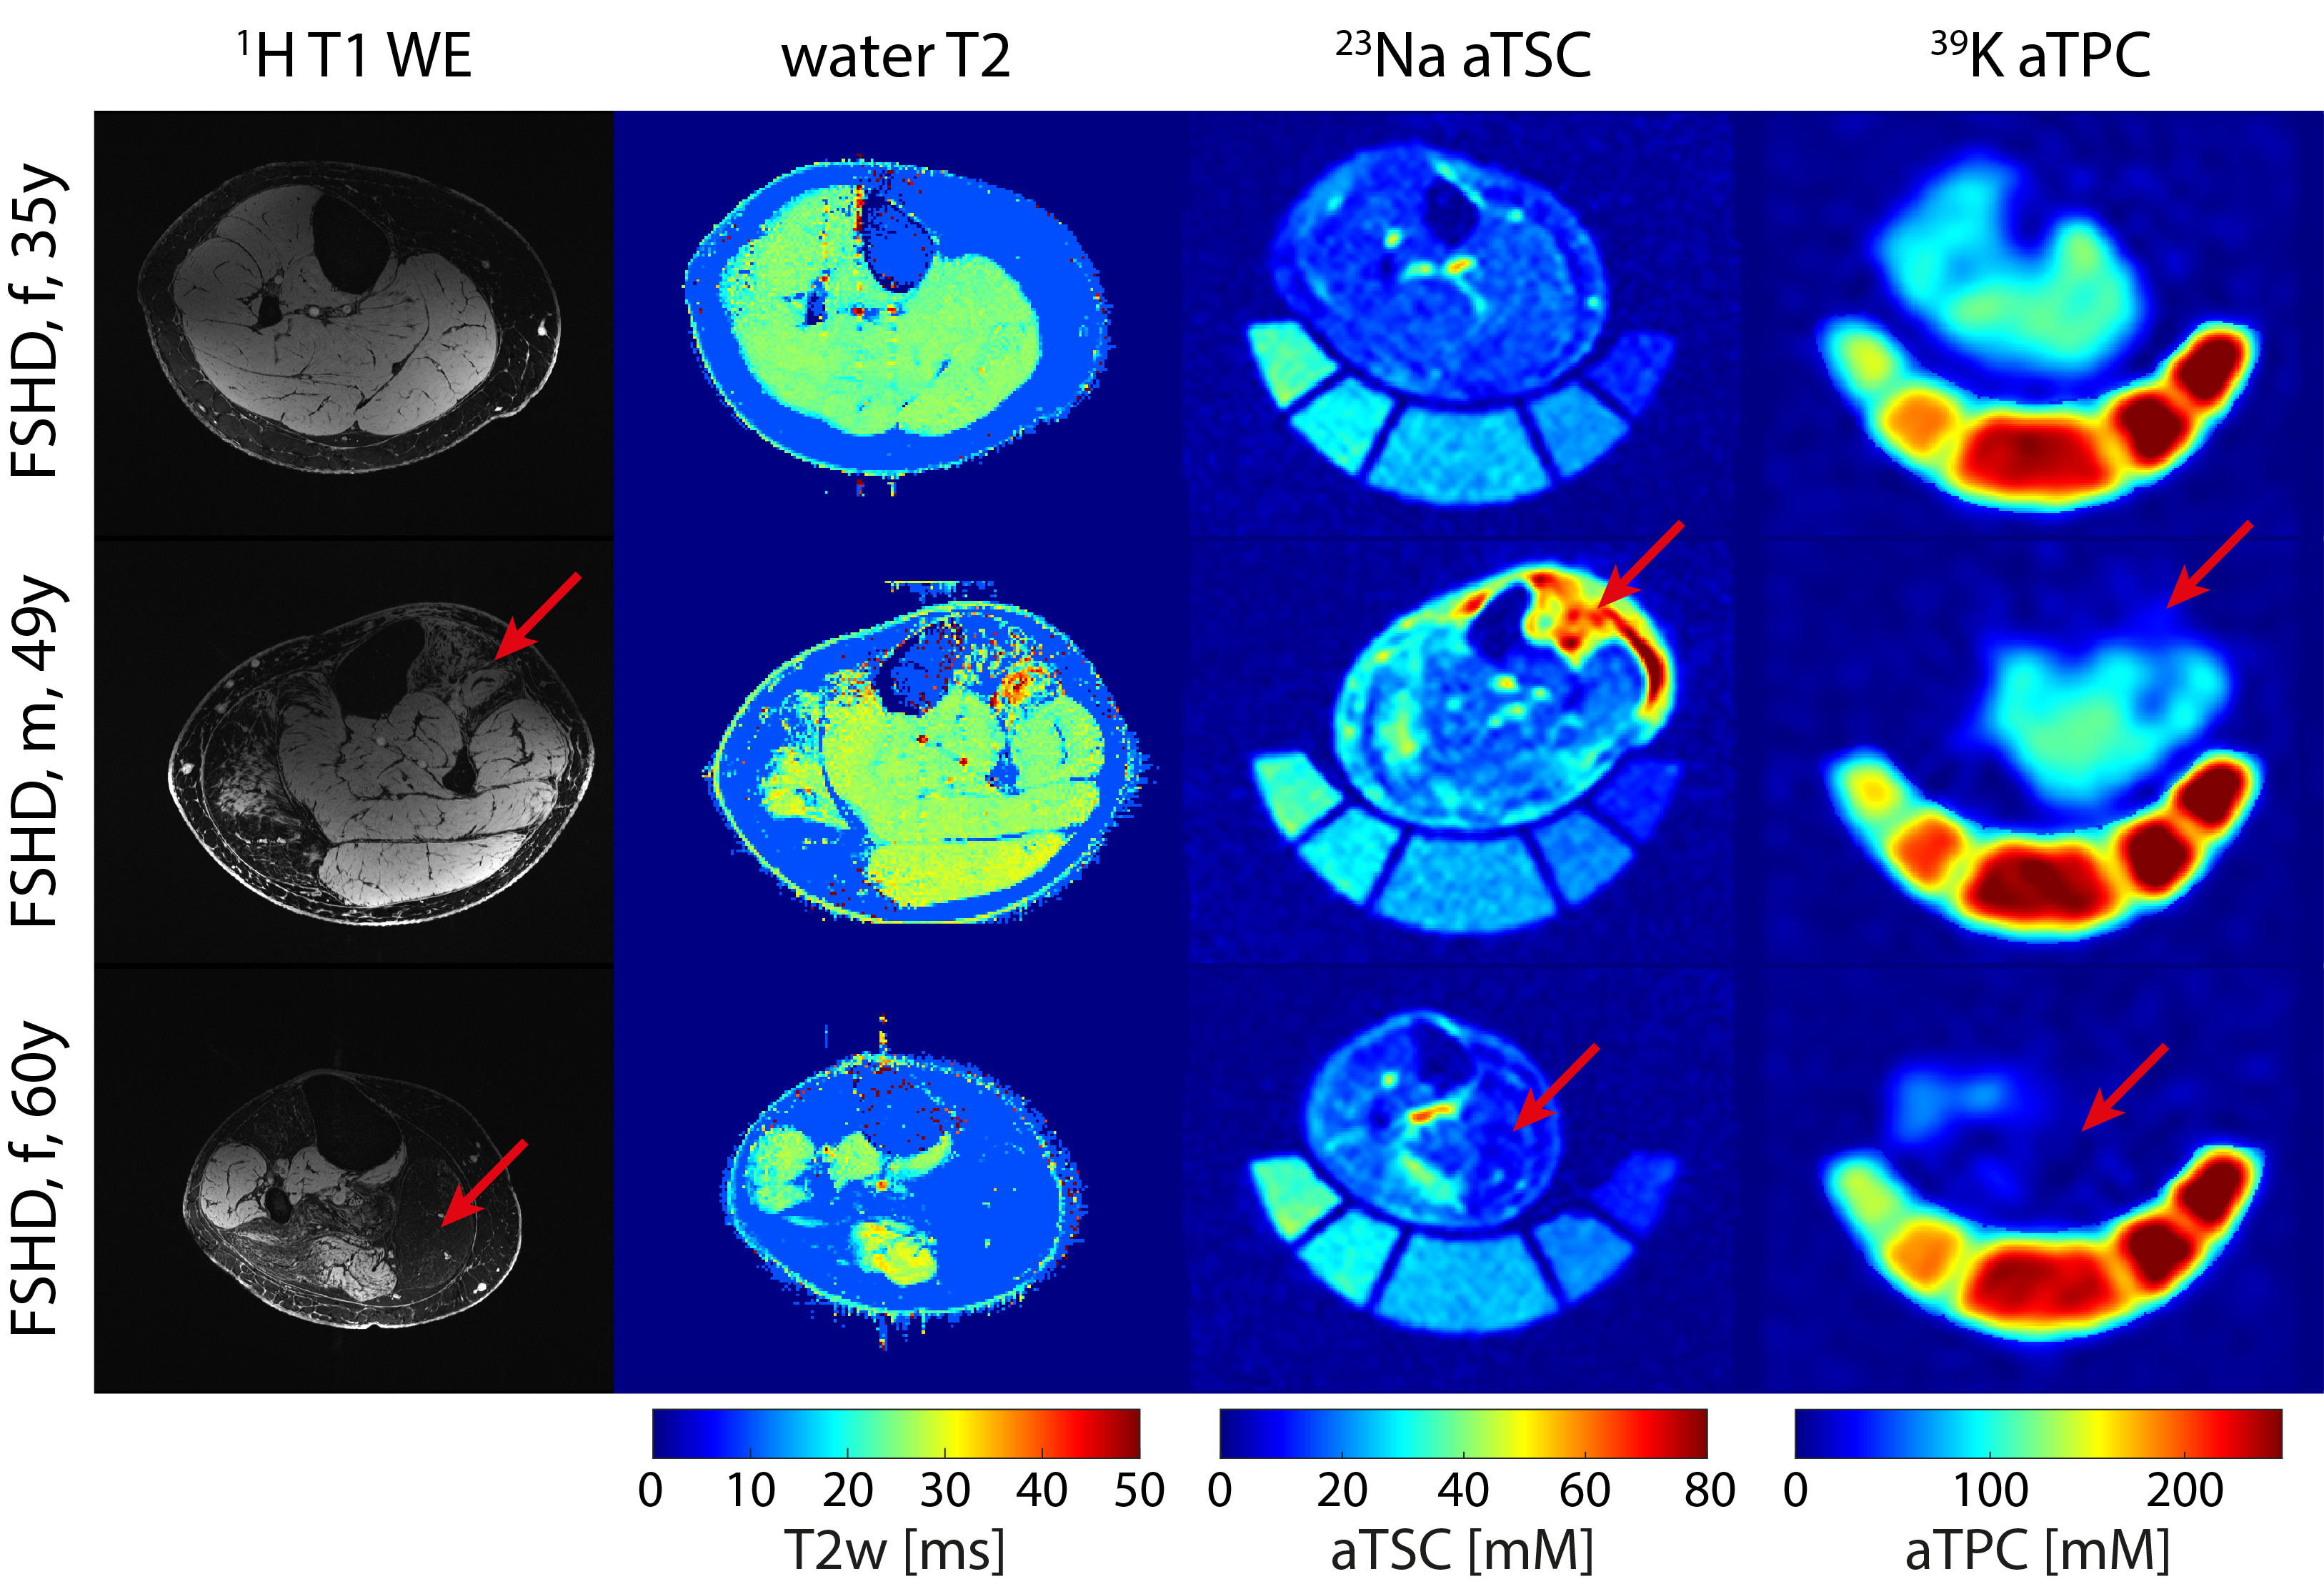
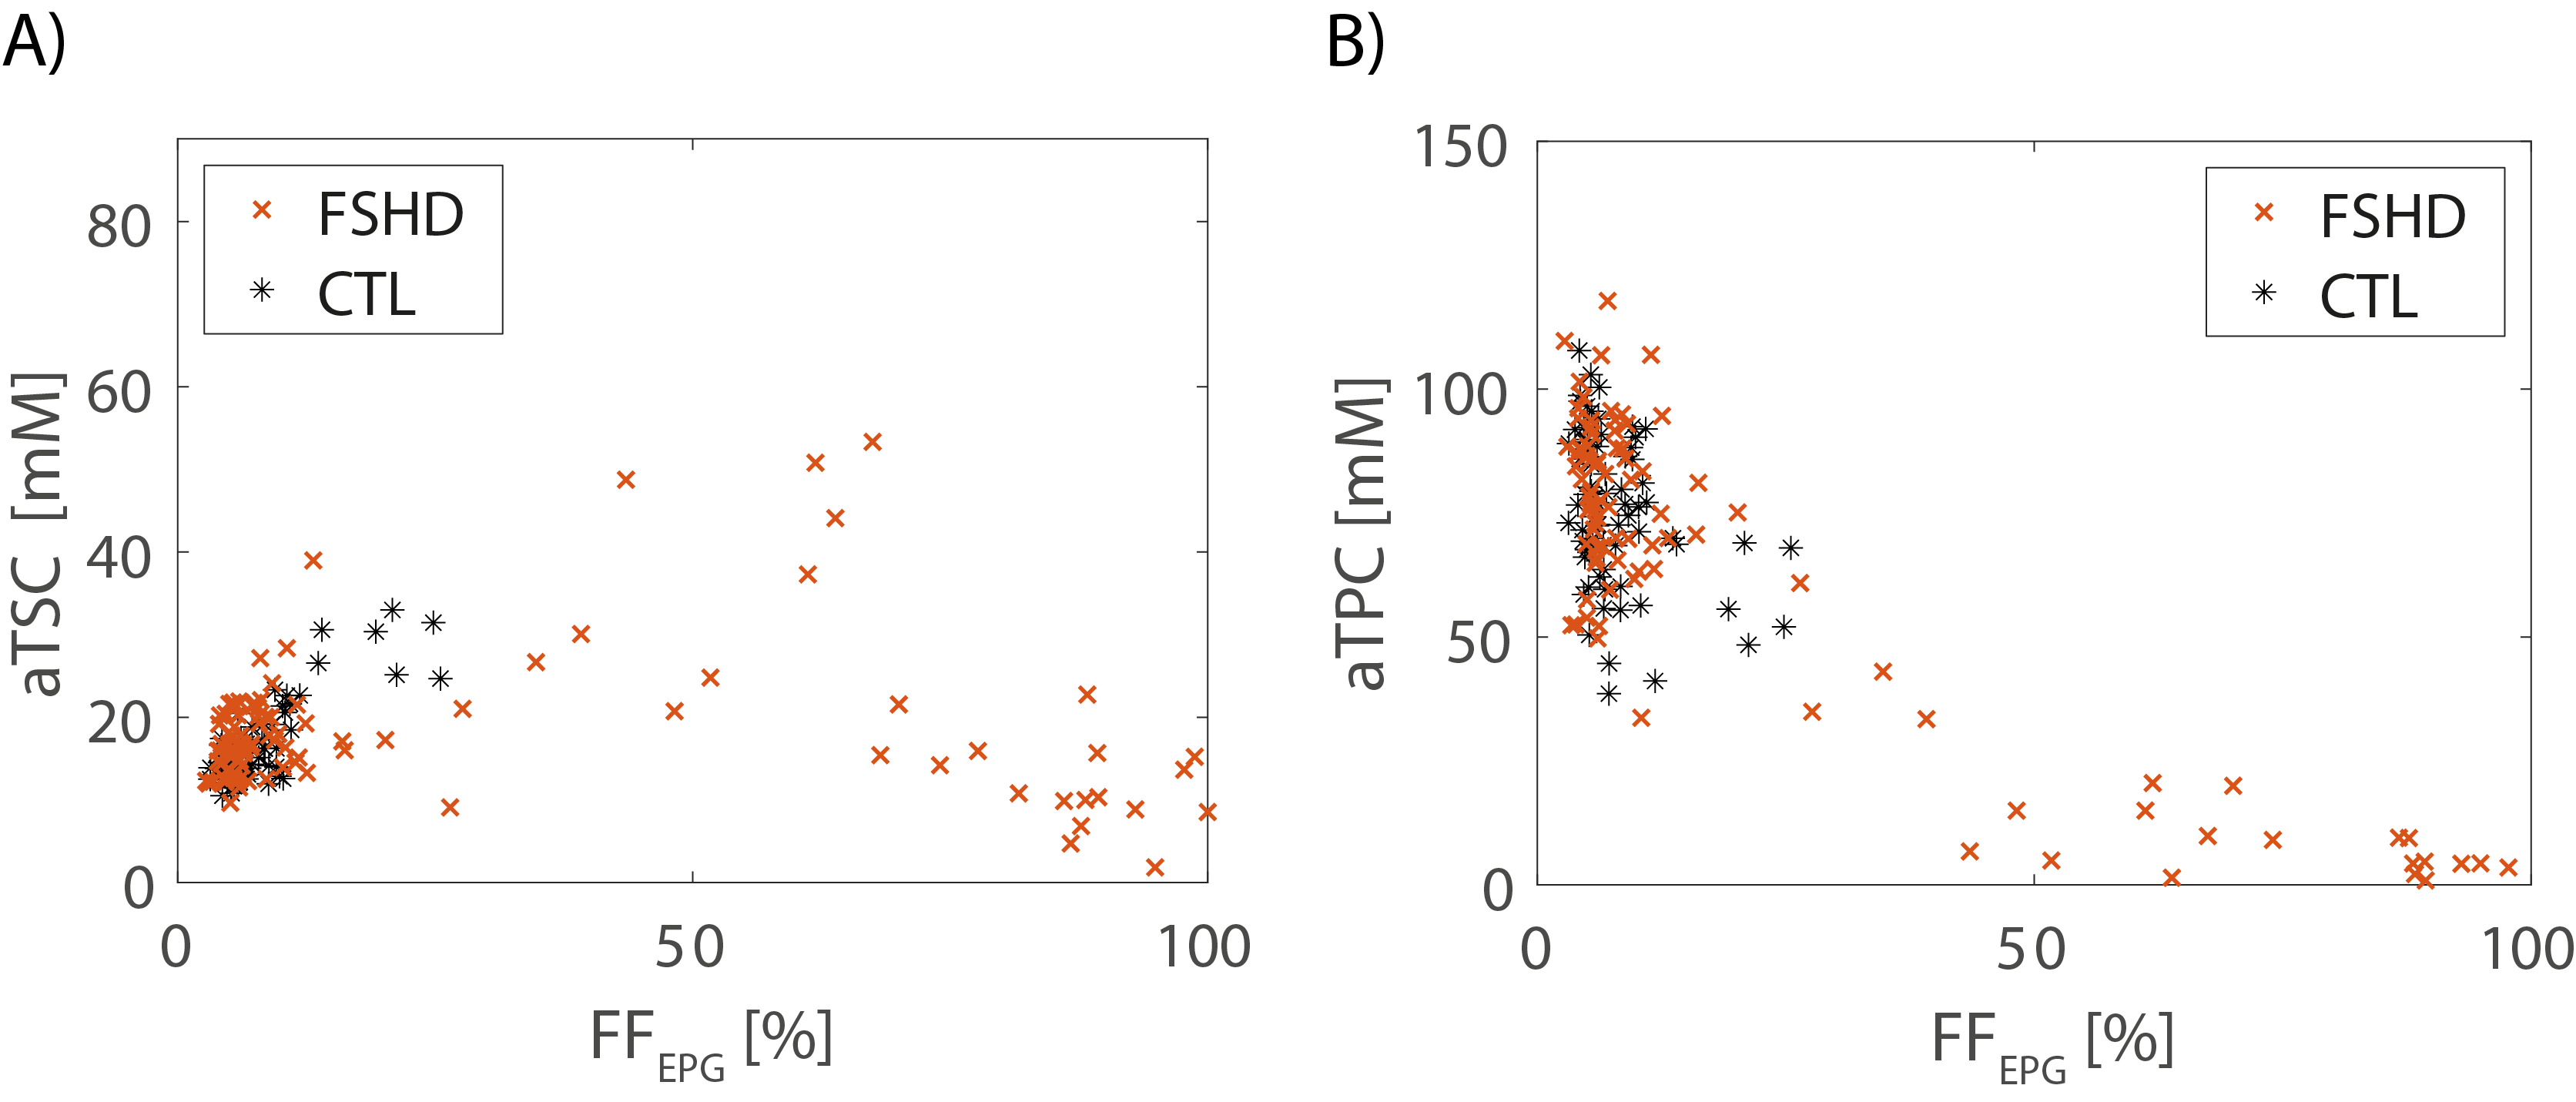
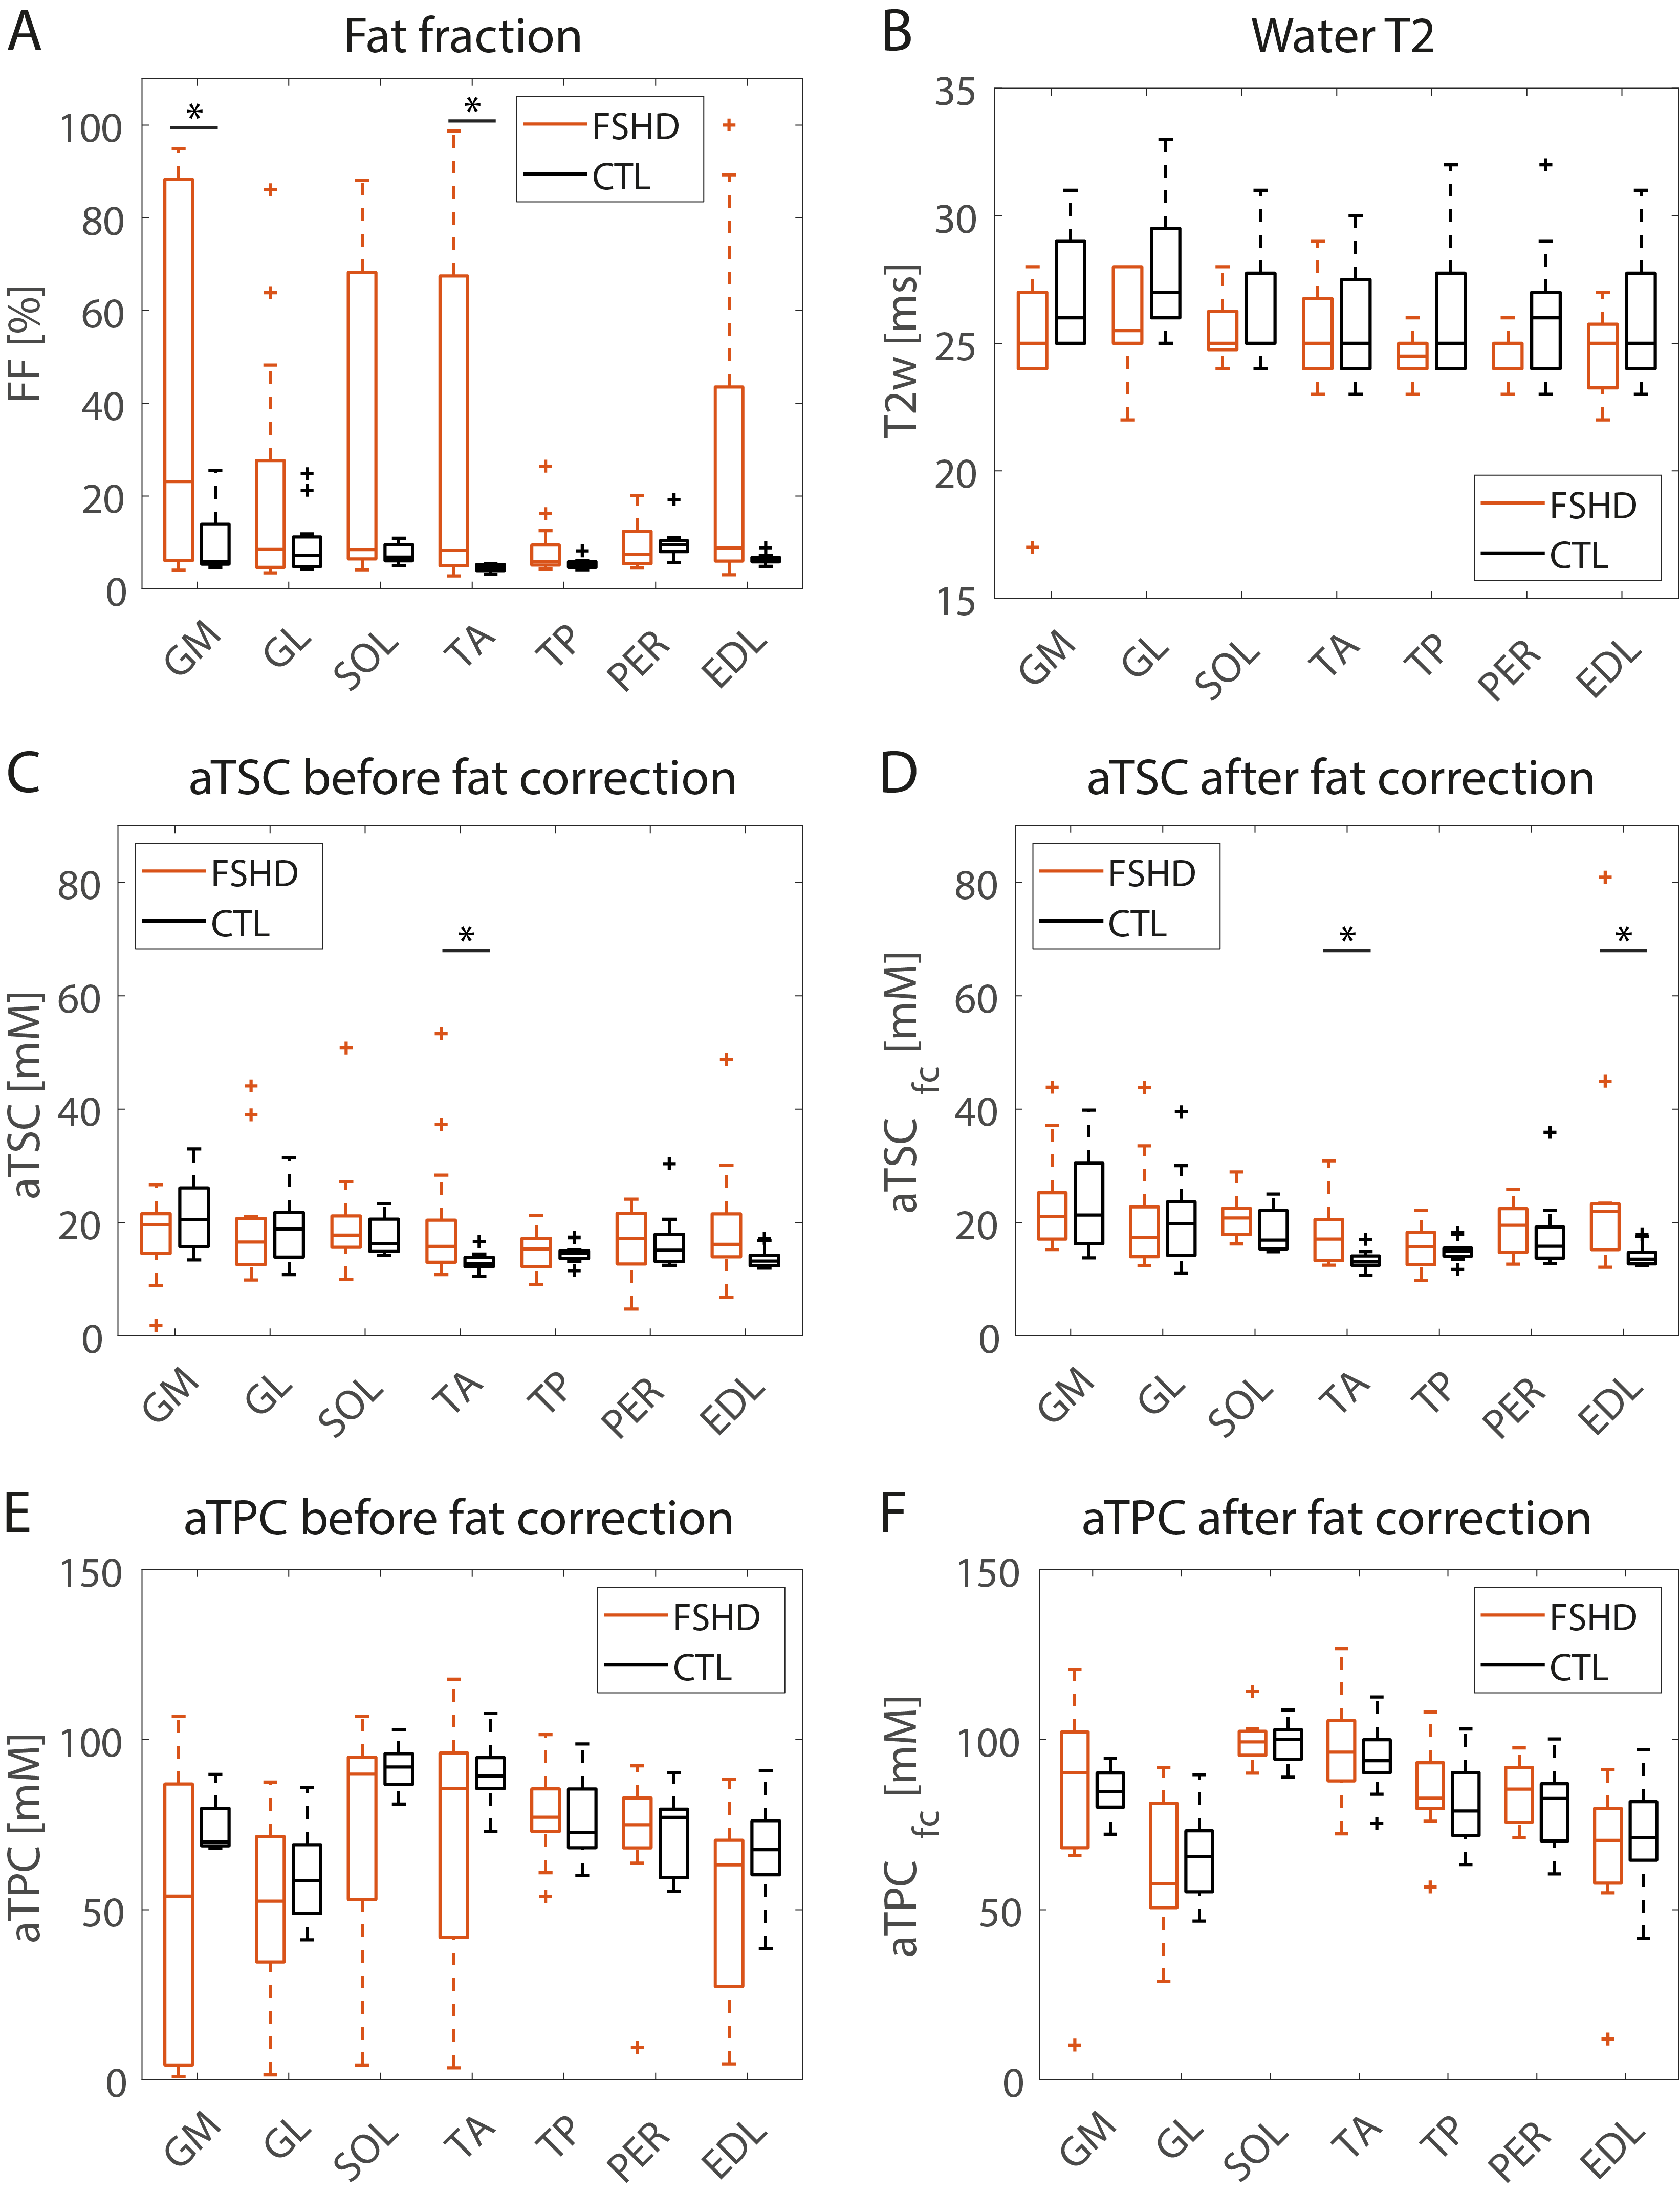
Figure 3: Comparison of quantitative MRI measures in individual lower leg muscle regions of FSHD patients and healthy controls. For calculation of fat corrected ion concentrations (aTSCfc/aTPCfc), aTSCfat = 7.9 mM8 and aTPCfat = 0 mM were assumed for fatty tissue. Only muscles with FF<60% were considered for evaluation of T2w and aTSCfc/aTPCfc. Significant differences between patients and controls are marked with *.
Abbreviations: Gastrocnemius medialis/lateralis (GL/GM), Soleus (SOL), Tibialis Anterior/Posterior (TA/TP), Peroneus (PER), Extensor Digitorum Longus (EDL)