0897
Muscle-specific fat fractions during childhood development in typically developing children and children with cerebral palsy1Neuroscience Research Australia (NeuRA), Sydney, Australia, 2Graduate School of Biomedical Engineering, University of New South Wales, Sydney, Australia, 3School of Biomedical Sciences, University of New South Wales, Sydney, Australia, 4School of Psychology, University of New South Wales, Sydney, Australia, 5Cerebral Palsy Alliance Research Institute, The University of Sydney, Sydney, Australia, 6Philips Australia & New Zealand, Sydney, Australia, 7Rehab2Kids, Sydney Children's Hospital, Sydney, Australia, 8Faculty of Medicine and Health, The University of Sydney, Sydney, Australia
Synopsis
Keywords: Muscle, Fat, cerebral palsy
Motivation: Little is known about the fat content of the skeletal muscles of typically developing children or children with cerebral palsy.
Goal(s): To describe and compare muscle-specific intramuscular fat fractions in typically developing children and children with cerebral palsy.
Approach: Proton density fat fractions were calculated for 11 lower leg muscles using mDixon MRI scans of 280 children (5 to 15 years), including 79 with cerebral palsy.
Results: Age and sex did not affect mean fat fractions in typically developing children. Fat fractions varied across muscles. Fat fractions were larger, more variable, and increased with age in children with cerebral palsy.
Impact: The comprehensive dataset and automation measurement techniques for measurement of muscle-specific fat fractions in typically developing children and children with cerebral palsy may be used to monitor muscle-specific disease progression or measure the effect of interventions.
INTRODUCTION
Neuromuscular conditions, including cerebral palsy (CP), often cause fat infiltration in skeletal muscles1. Fat infiltration may contribute to motor dysfunction. Measurements of fat fractions may assist monitor disease progression or measure the effect of interventions2.Quantitative magnetic resonance imaging methods, based on slight differences in resonance frequencies between protons in water and fat (Dixon method), can be used to measure voxel-specific fat fractions3. A previous study quantified muscle fat fractions in children with CP, but only in two muscles of a small cohort of 40 children1. Therefore, it is largely unknown how muscle-specific fat fractions change during typical childhood development, and how muscle-specific fat fractions may be affected by CP.
The aims of this study are to (1) determine the effect of age, sex and muscle on fat fractions of typically developing lower leg muscles and (2) determine the effect of CP on intramuscular fat.
METHODS
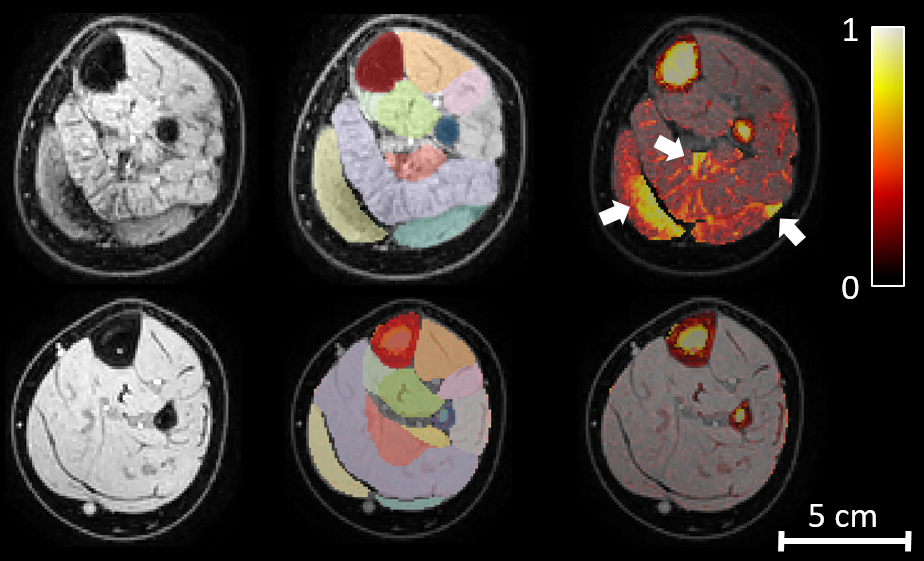
Lower legs of 280 children were scanned at 3T (Ingenia CX, Philips Healthcare, Best, The Netherlands). Five children withdrew or had unusable scans from motion artefacts. We report data (Fig. 1) from 197 typically developing children (boys/girls: 114/83, age: 10.0 ± 2.6 [5.1 – 15.0] years, weight: 36 ± 12 [17-81] kg, height: 142 ± 16 [108-180] cm, values are mean ± SD [min-max]) and 78 children with CP (boys/girls: 49/29, age: 10.0 ± 2.8 [5.4-15.0] years, weight: 36 ± 15 [17-91.2] kg, height: 139 ± 17.0 [108-172] cm, Gross Motor Function Classification System Level 1/2/3 = 59/35/3%, hemiplegic/diplegic/quadriplegic = 55/30/15%). For typically developing children, a randomly chosen leg was scanned. For children with CP, the more-affected side was scanned. Muscle growth data from typically developing children in this cohort was published elsewhere4.Settings for the mDixon scans were: 2-point 3D T1-Fast Field Echo (T1FFE) sequence, TR/TE1/TE2 = 6.0-6.2/3.5/4.6 ms, NSA = 2, acquisition voxel size = 1×1×2 mm (reconstructed to 1×1×1 mm), acquisition matrix = 160×160, number of slices = 290-485, scan duration = 164-276 s. Philips software was used to reconstruct water and fat images from the in-phase and out-of-phase images5.
Eleven lower leg muscles/muscle groups were segmented on all scans (mostly) automatically using the nnU-Net that was iteratively trained on increasing amounts of training data4. Voxel-specific proton density fat fractions (PDFF) were calculated by dividing the intensity of the fat image by the sum of the intensities of the fat and water image. Muscle-specific PDFF were calculated as the mean PDFF of all voxels in a muscle. A participant’s mean fat fraction was calculated as the mean PDFF across muscles.
A linear mixed model was used to determine the effect of age, sex and the interaction between age and sex on mean PDFF in typically developing children. To test whether fat fractions differed between muscles in typically developing children, models with and without a fixed factor for muscle were compared using a likelihood ratio test. A linear mixed model with fixed effects for CP, age and interaction between CP and age was used to test for an effect of CP on PDFF. In all models, a random factor for family was included to account for correlations between measurements on siblings.
RESULTS
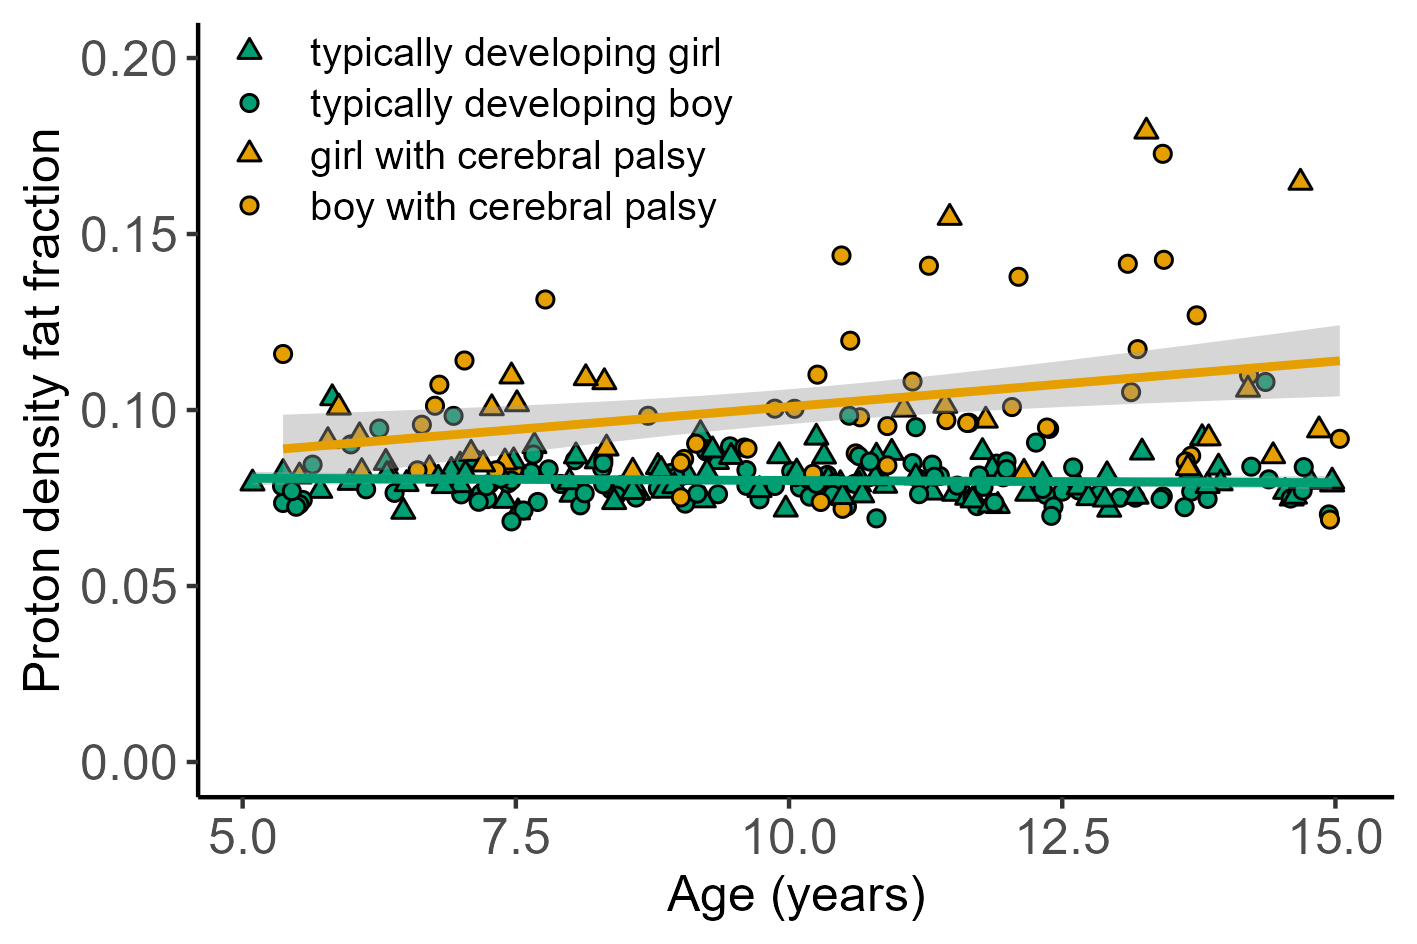
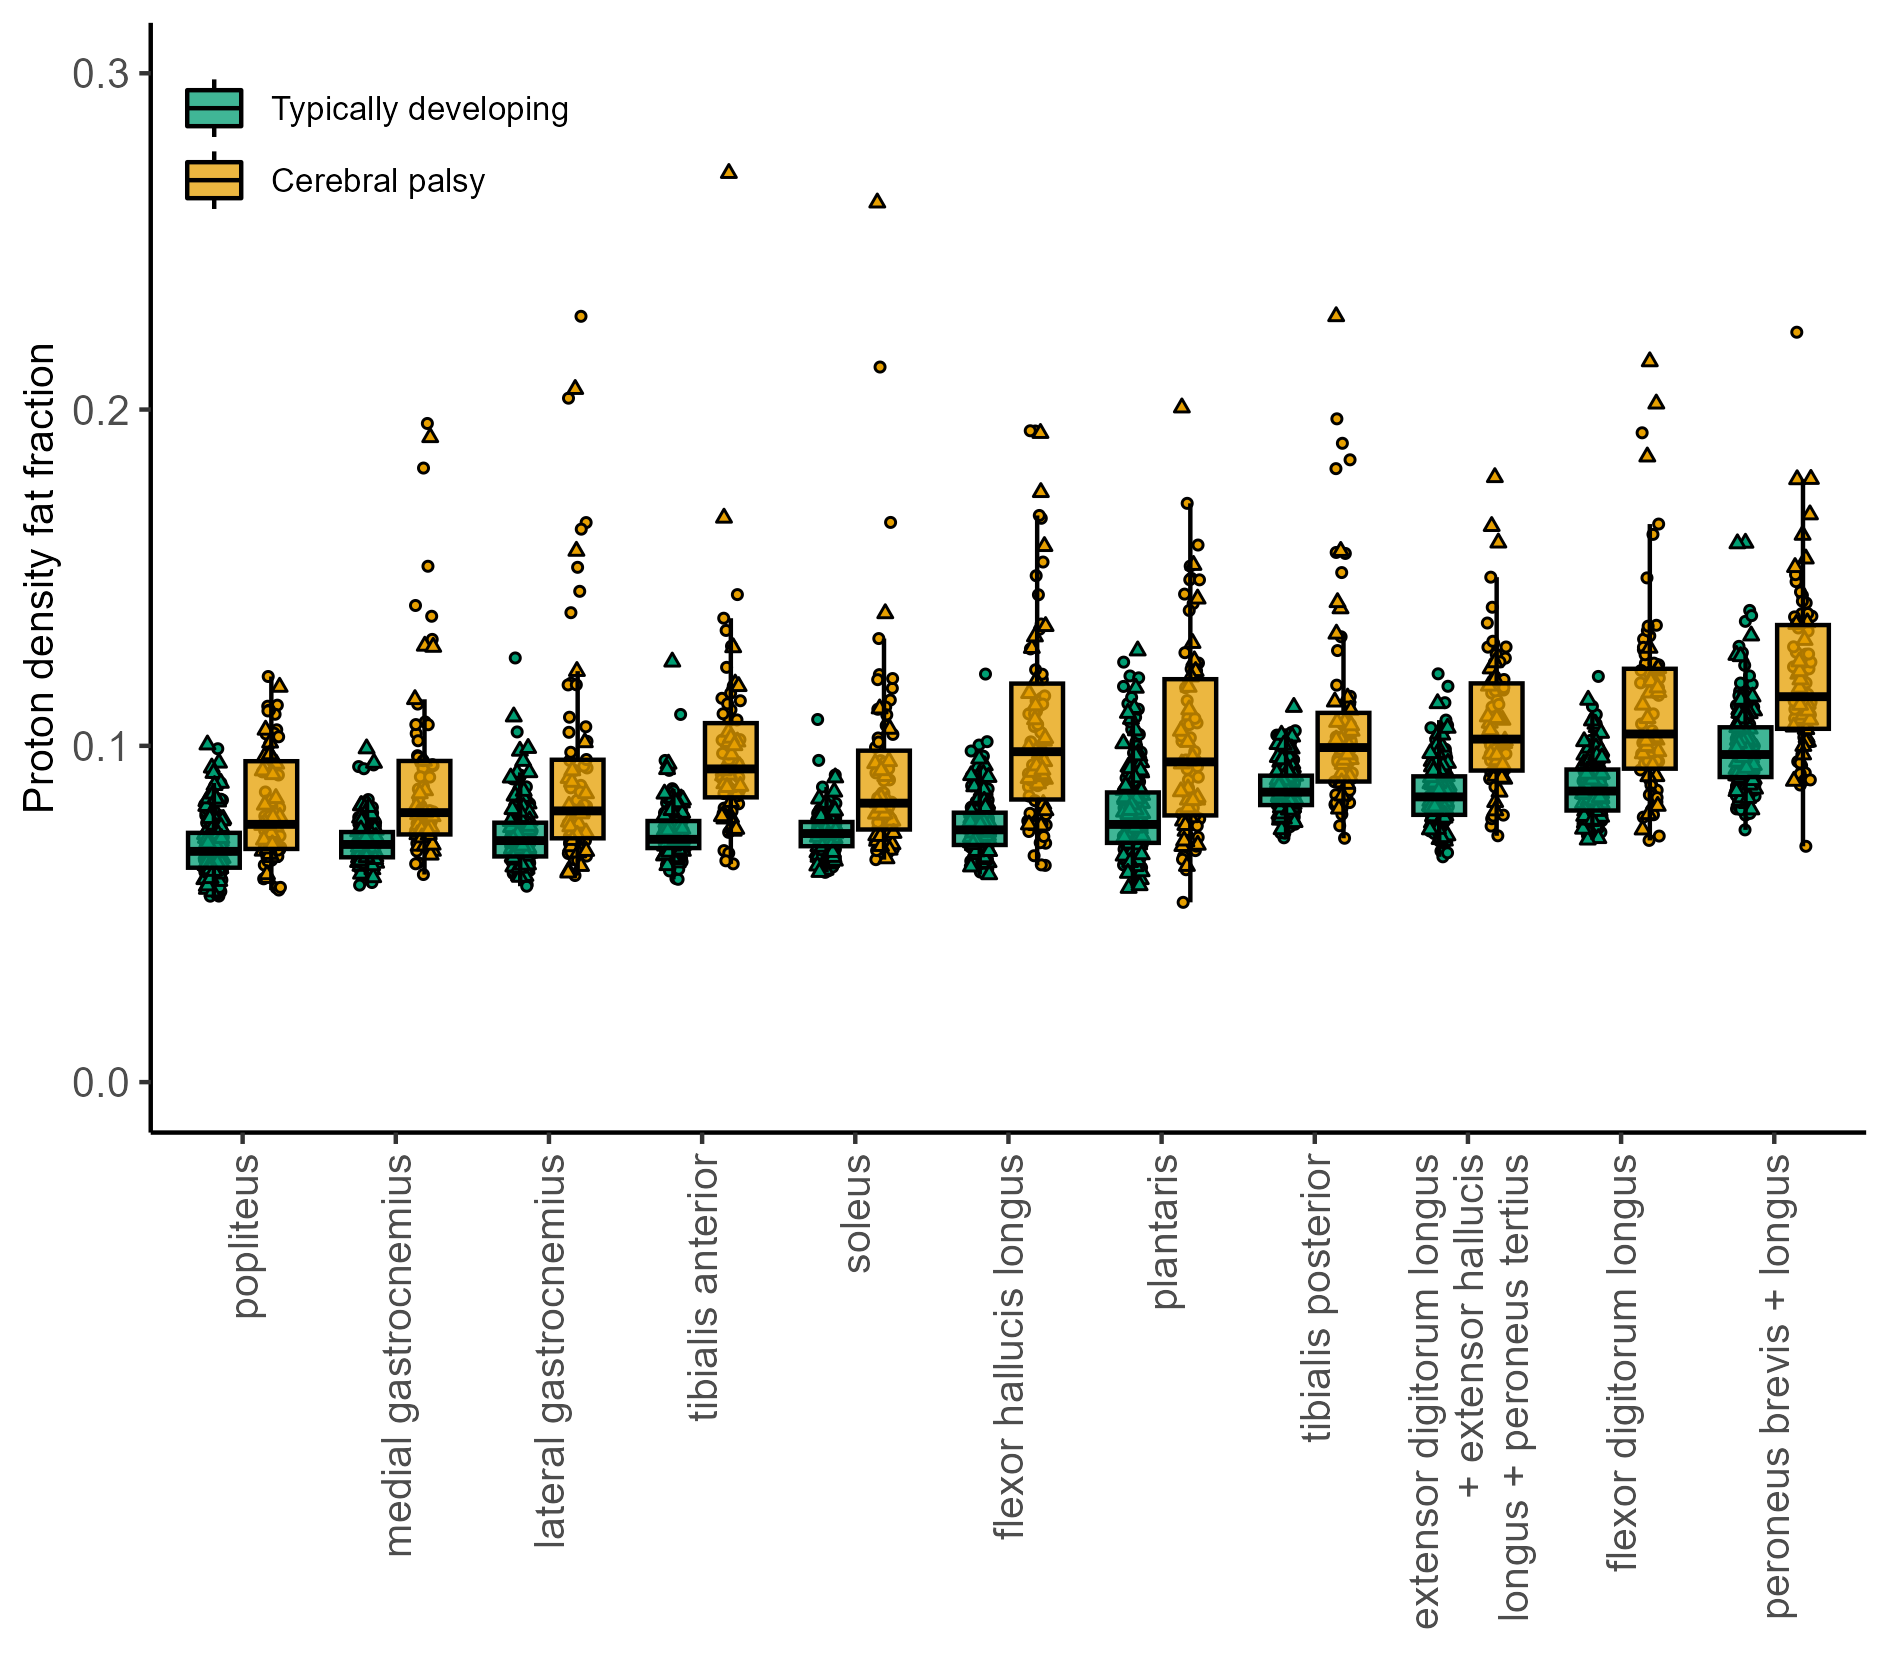
Fat fractions were measured in 3,025 muscles from 275 children. In typically developing children, we found no effect of age (p=0.93), sex (p=0.15) or an interaction between age and sex (p=0.223) on mean PDFF (Fig. 2). There was an effect of muscle (p<0.001). PDFFs, averaged across participants, ranged from 0.070 for the popliteus to 0.099 for the peroneus (Fig. 3).There was a statistically significant effect of the interaction between age and CP on mean PDFF (0.0028 [95% CI 0.0016 to 0.0039] /year, p<0.001). Compared to typically developing children, children with CP had higher median and more variable fat fractions in all lower leg muscles (Fig. 3).
DISCUSSION
During childhood development from 5 to 15 years, the fat fractions of lower leg muscles are independent of age. Boys and girls have similar fat fractions, but fat fractions vary across muscles. The narrow distribution of fat fractions in typically developing children means that even small changes caused by, for example, neuromuscular disease can be detected using the mDixon method.Children with CP generally have larger muscle fat fractions than typically developing children. In line with the progressive but heterogeneous functional impairment caused by CP, fat fractions in lower leg muscles of children with CP increase with age, but vary considerably between children.
Acknowledgements
This study was supported by the Australian National Health and Medical Research Council (NHMRC) grants APP1156394 and APP1117192. The authors acknowledge the facilities and scientific and technical assistance of the National Imaging Facility, a National Collaborative Research Infrastructure Strategy (NCRIS) capability, at the NeuRA Imaging, NeuRA, UNSW Node. BC is supported by a University of New South Wales (UNSW) Scientia scholarship and an Australian Government Research Training Program (RTP) scholarship.References
- D'Souza, A., Bolsterlee, B., Lancaster, A., Herbert, R.D., 2020. Intramuscular fat in children with unilateral cerebral palsy. Clin Biomech 80, 105183.
- Hooijmans, M.T., Schlaffke, L., Bolsterlee, B., Schlaeger, S., Marty, B., Mazzoli, V., 2023. Compositional and Functional MRI of Skeletal Muscle: A Review. J Magn Reson Imaging. Online available: https://doi.org/10.1002/jmri.29091.
- Burakiewicz, J., Sinclair, C.D.J., Fischer, D., Walter, G.A., Kan, H.E., Hollingsworth, K.G., 2017. Quantifying fat replacement of muscle by quantitative MRI in muscular dystrophy. J Neurol 264, 2053-2067.
- Chow, B.V.Y., Morgan, C., Rae, C., Warton, D.I., Novak, I., Davies, S., Lancaster, A., Popovic, G.C., Rizzo, R.R.N., Rizzo, C.Y., Kyriagis, M., Herbert, R.D., Bolsterlee, B., 2023. Human lower leg muscles grow asynchronously. J Anatomy. Online available: https://doi.org/10.1111/joa.13967.
- Eggers, H., Bornert, P., 2014. Chemical shift encoding-based water-fat separation methods. J Magn Reson Imaging 40, 251-268.
Figures