0896
Longitudinal Assessment of Denervated Muscles in Parsonage-Turner Syndrome with Quantitative MRI1Radiology and Imaging, Hospital for Special Surgery, New York, NY, United States, 2Weill Cornell Medical College, New York, NY, United States
Synopsis
Keywords: Muscle, Quantitative Imaging
Motivation: Parsonage-Turner syndrome (PTS) is a spontaneous peripheral neuropathy affecting upper extremity nerves and leading to severe muscle denervation. Quantitative MRI (qMRI) can objectively evaluate the degree of denervation and muscle recovery from PTS over time.
Goal(s): To characterize PTS-related muscle denervation using qMRI biomarkers and to assess longitudinal changes.
Approach: In 21 PTS subjects at up to four timepoints, the associations of T2, apartment fiber diameter (AFD), fat fraction (FF), and muscle volume with electromyography and muscle function were analyzed.
Results: Associations between qMRI biomarkers reflect severity of muscle denervation in PTS. Recovery, involving reduced edema and increased atrophy, may follow non-linear patterns.
Impact: Quantitative MRI biomarkers including T2 mapping, apparent fiber diameter, fat fraction, and muscle volumetry correlate with electrodiagnostic and functional assessments of denervation and muscle function impairment in Parsonage-Turner syndrome (PTS), and they can longitudinally characterize PTS-related changes.
Introduction
Parsonage-Turner syndrome (PTS) is a rare peripheral neuropathy characterized by spontaneous pain followed by profound weakness in the upper extremity secondary to muscle denervation1,2. Patterns of disease progression and recovery from PTS are poorly understood, with patients typically recovering in 1-2 years and experiencing residual pain and fatigue3,4. Techniques for obtaining quantitative MRI (qMRI) biomarkers, including T2 mapping, apparent fiber diameter (AFD), fat fraction (FF), and muscle volumetry can characterize PTS-related muscle denervation5,6. Muscle function and motor unit recruitment (MUR) are evaluated by physical exam and electromyography (EMG), respectively4,7. This study aimed to: (1) evaluate associations between qMRI biomarkers, (2) evaluate the relationship among qMRI, muscle function, and EMG in patients with PTS, and (3) characterize the longitudinal behavior of qMRI biomarkers. We hypothesized that longitudinal qMRI changes would explain patterns of muscle edema, atrophy, and fatty infiltration, and would correlate with muscle function and EMG MUR.Methods
Patients with a clinical diagnosis of PTS (confirmed with EMG) involving the suprascapular nerve (supplying the supraspinatus/infraspinatus muscles) and/or axillary nerve (supplying the deltoid muscle) provided written, informed consent for this prospective, IRB-approved study. Subjects were imaged at baseline (within 6 months of symptom onset) and after 3, 6, and 12 months. MRI was performed at 3-Tesla (Signa Premier, GE Healthcare) using a protocol that included a 2D multi-echo-spin-echo sequence for T2 mapping, multi-shell DTI for AFD, and 3D Dixon gradient echo for volumetry and fat fraction assessments. Manual segmentations of the supraspinatus, infraspinatus, deltoid and subscapularis (as a control) muscles were performed by two independent raters (MeVis Medical Solutions AG (muscle volume); ITK-Snap (qMRI)). Linear regressions were performed to evaluate associations between qMRI, EMG, and muscle function (evaluated using the medical research council (MRC) scale for shoulder abduction and external rotation). A linear mixed effect model was used to evaluate associations between time from symptom onset and qMRI biomarkers, with variation between subjects accounted for as a random effect.Results
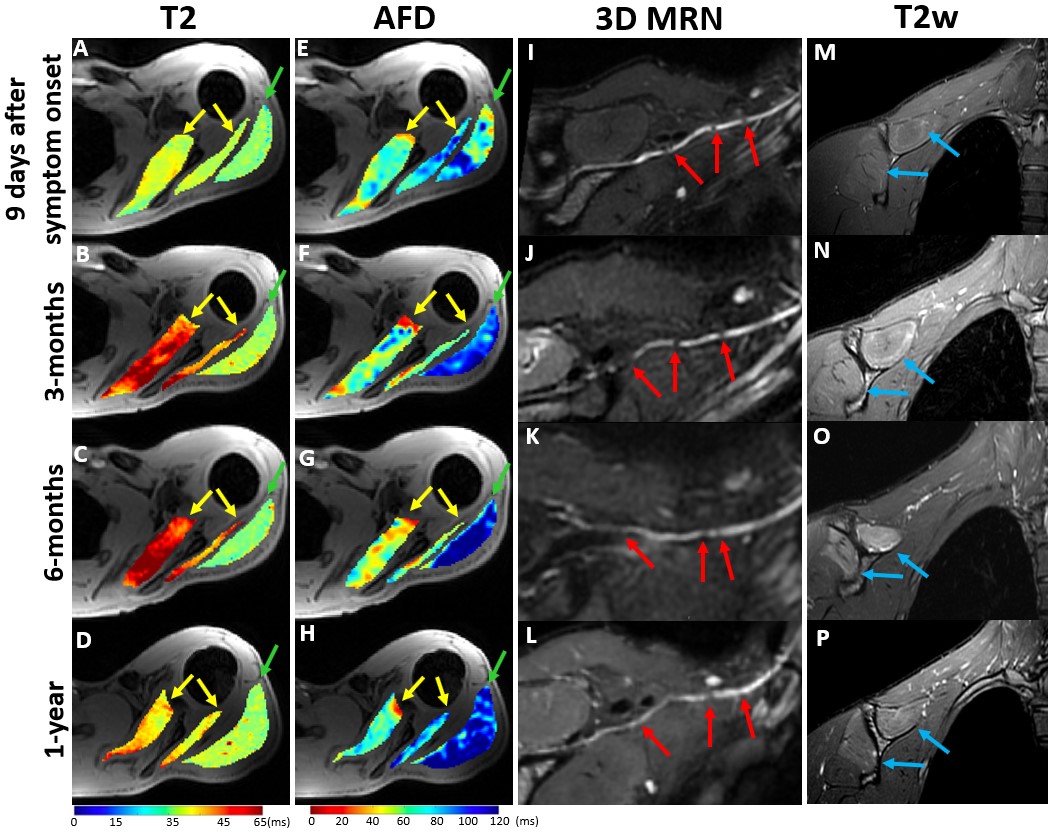
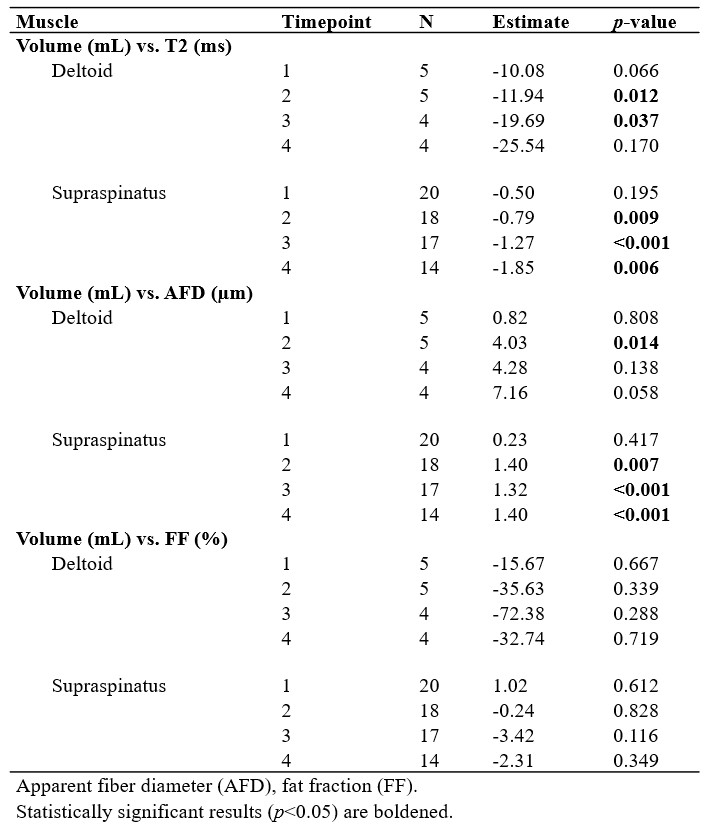
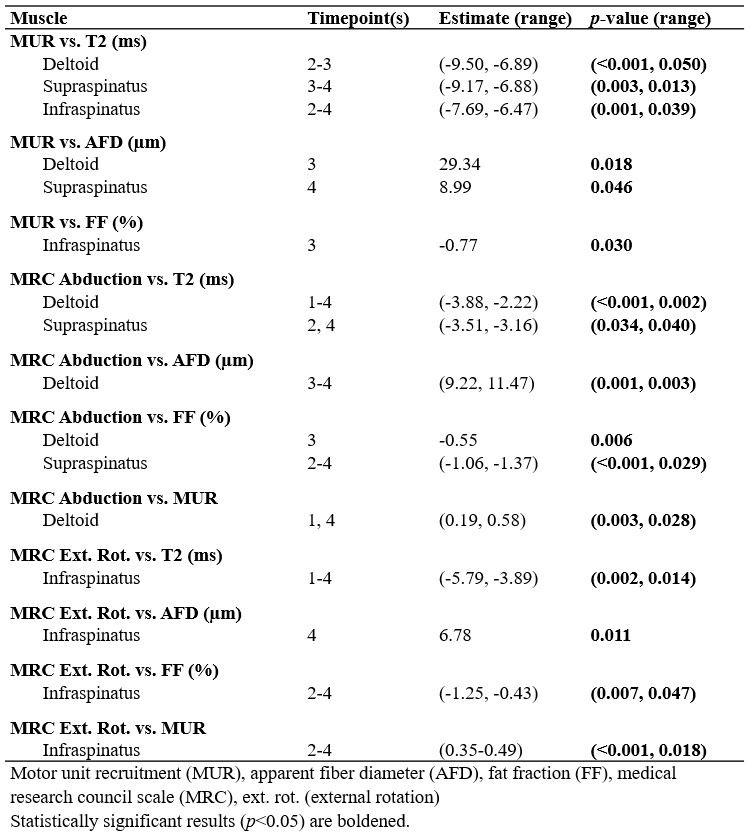
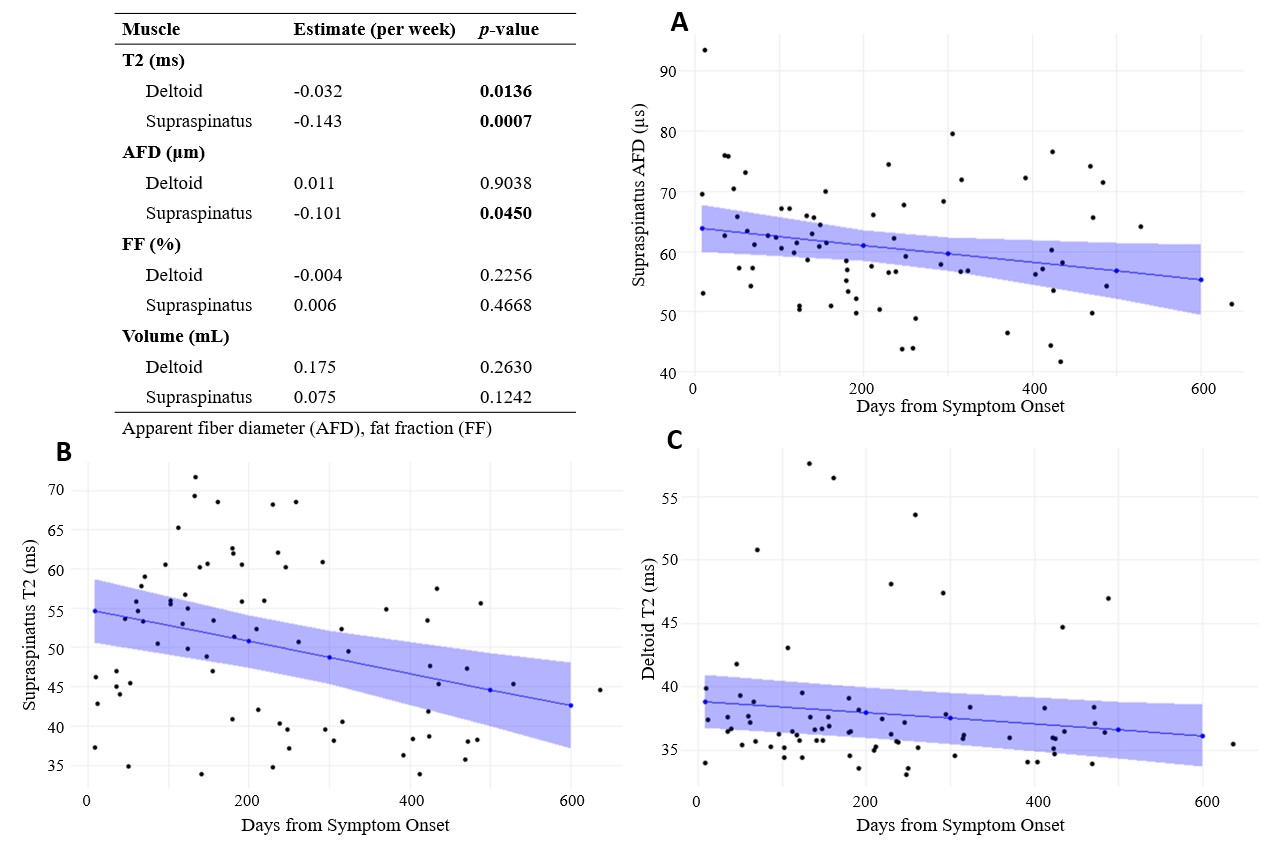
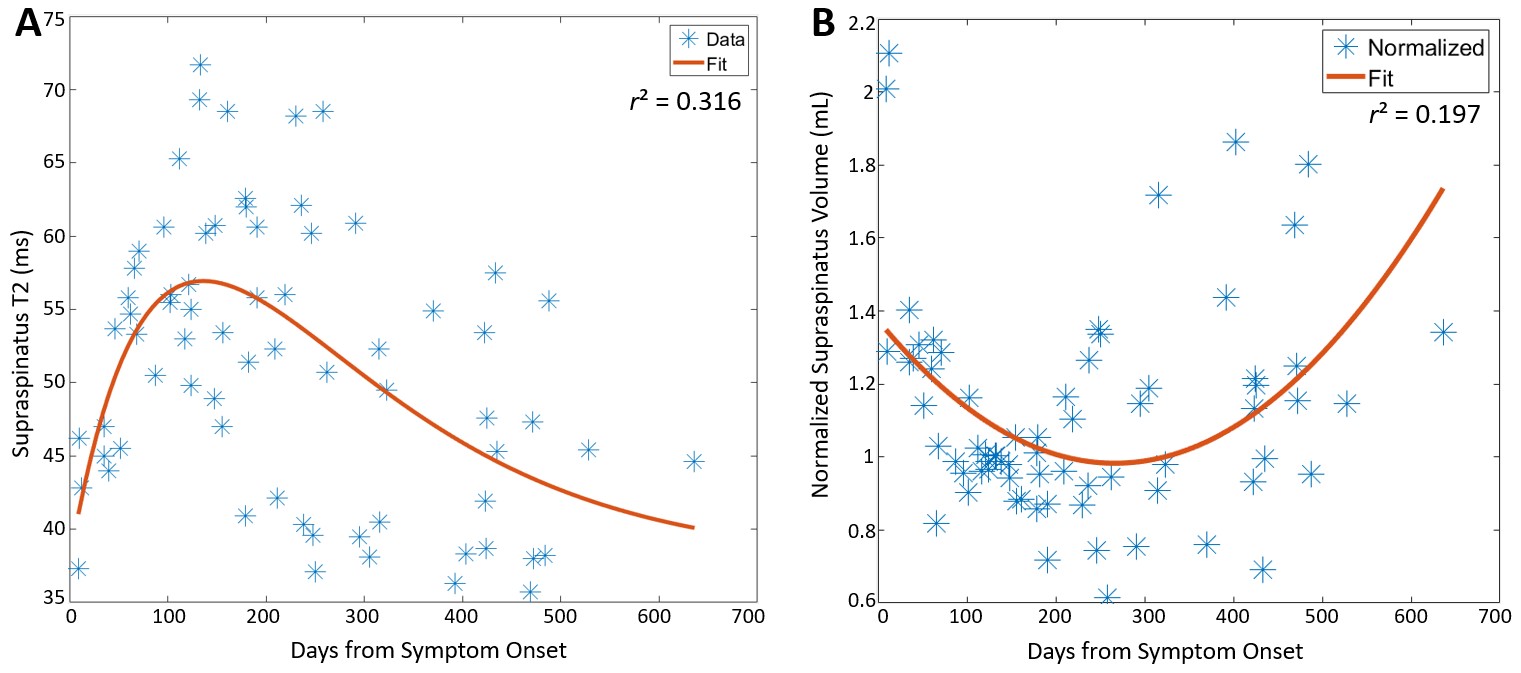
A total of 21 subjects (47±15 years-old, 13 men) were included, with 13 subjects completing all 4 timepoints, 6 completing 3, and 2 completing 2 (Figure 1). The intraclass correlation coefficients for inter-rater agreement of manual muscle segmentations were 0.95-0.99. In PTS-involved muscles, negative associations were observed between muscle volume and T2, while positive associations were observed between volume and AFD (Table 1). Associations between volume and FF were not significant. Associations between EMG MUR severity and T2 or FF were mostly negative, while associations between MUR and AFD were mostly positive (Table 2). Similarly, associations between MRC scores and qMRI metrics followed expected polarity (Table 2). Longitudinal analysis showed significant negative linear associations between T2 and time from symptom onset in the deltoid and supraspinatus, and between AFD and time from symptom onset in the supraspinatus (Figure 2). Additionally, supraspinatus T2 vs. time from symptom onset appeared to follow a nonlinear pattern and was fitted with a gamma distribution curve (shape=2, θ=136 days, r2 =0.316); supraspinatus volume (normalized to volume estimated at 136 days) vs. time was fitted with a quadratic curve (r2 =0.197) (Figure 3).Discussion
This study revealed significant associations between muscle volume, T2, and AFD that suggest that qMRI biomarkers reflect the severity of muscle denervation and impairment of muscle function in PTS. The associations between EMG MUR and T2 or AFD suggest that qMRI biomarkers parallel muscle electrical activity. While shoulder abduction function was strongly associated with qMRI of either the deltoid or supraspinatus, these associations reveal that PTS involving both the suprascapular and axillary nerves has a more severe impact on shoulder abduction. There were fewer associations involving FF, which may be expected, as many PTS patients do recover in 12-18 months.This study also elucidated important longitudinal patterns of decreased T2 and AFD with time, reflecting reduced muscle edema but increased atrophy during recovery. Nonlinear fitting of T2 may further characterize the initial increase in T2, peaking at approximately 200 days post symptom onset, followed by a more gradual recovery period. Similarly, nonlinear fitting of supraspinatus volume shows an initial decrease and eventual recovery of muscle bulk.
This study was limited by relatively few data points in the early (<30 days) and late (>400 days) timepoints, as well as variation between subjects. The data are part of a larger, ongoing longitudinal PTS study, which includes other commonly affected nerves in PTS, such as the long thoracic and anterior interosseous.
Conclusion
Analysis of qMRI biomarkers in denervated muscle in PTS reveal important associations between individual qMRI biomarkers, associations with EMG and muscle function, and changes with time.Acknowledgements
We would like to thank Drs Joeseph Feinberg and Carlo Milani for their contributions to the study (electromyography and physical exams) and Joseph Nguyen for useful discussions.References
1. Alfen N van, Engelen BGM van. The clinical spectrum of neuralgic amyotrophy in 246 cases. Brain. 2006;129(2):438-450. doi:10.1093/brain/awh722
2. Feinberg JH, Radecki J. Parsonage-Turner Syndrome. Hss J. 2010;6(2):199-205. doi:10.1007/s11420-010-9176-x
3. Cup EH, Ijspeert J, Janssen RJ, et al. Residual Complaints After Neuralgic Amyotrophy. Arch Phys Med Rehab. 2013;94(1):67-73. doi:10.1016/j.apmr.2012.07.014
4. Feinberg JH, Nguyen ET, Boachie‐Adjei K, et al. The electrodiagnostic natural history of parsonage–turner syndrome. Muscle Nerve. 2017;56(4):737-743. doi:10.1002/mus.25558
5. Argentieri EC, Tan ET, Whang JS, et al. Quantitative T2‐mapping magnetic resonance imaging for assessment of muscle motor unit recruitment patterns. Muscle Nerve. 2021;63(5):703-709. doi:10.1002/mus.27186
6. Tan ET, Zochowski KC, Sneag DB. Diffusion MRI fiber diameter for muscle denervation assessment. Quant Imaging Med Surg. 2022;0(0):0-0. doi:10.21037/qims-21-313
7. Pons C, Borotikar B, Garetier M, et al. Quantifying skeletal muscle volume and shape in humans using MRI: A systematic review of validity and reliability. PLoS ONE. 2018;13(11):e0207847. doi:10.1371/journal.pone.0207847
Figures