0895
Motor unit magnetic resonance imaging to assess muscle twitch dynamics in mitochondrial disease after an exercise programme.1Translational and Clinical Research Institute, Newcastle University, Newcastle upon Tyne, United Kingdom, 2Northern Medical Physics and Clinical Engineering, Newcastle upon Tyne NHS Foundation Trust, Newcastle upon Tyne, United Kingdom, 3Department of Neuroradiology, Newcastle upon Tyne NHS Foundation Trust, Newcastle upon Tyne, United Kingdom, 4Wellcome Centre for Mitochondrial Research, Newcastle University, Newcastle upon Tyne, United Kingdom, 5National Institute for Health and Care Research Newcastle Biomedical Research Centre, Newcastle University, Newcastle upon Tyne, United Kingdom, 6NHS Highly Specialised Service for Rare Mitochondrial Disorders, Newcastle upon Tyne NHS Foundation Trust, Newcastle upon Tyne, United Kingdom
Synopsis
Keywords: Functional/Dynamic, Muscle, Genetic Diseases
Motivation: Changes to muscle twitch dynamics are overlooked in trials assessing resistance exercise in primary mitochondrial myopathies (PMM).
Goal(s): Motor unit MRI to measure twitch dynamics in PMM participants before and after a 12-week exercise programme.
Approach: Voxel-wise measurements of rise time (Trise), contraction time (Tcontract) and half-relaxation time (Thalf-relax) in the tibialis anterior in 10 controls and 9 PMM participants. PMM participants scanned twice, before and after a 12-week exercise programme.
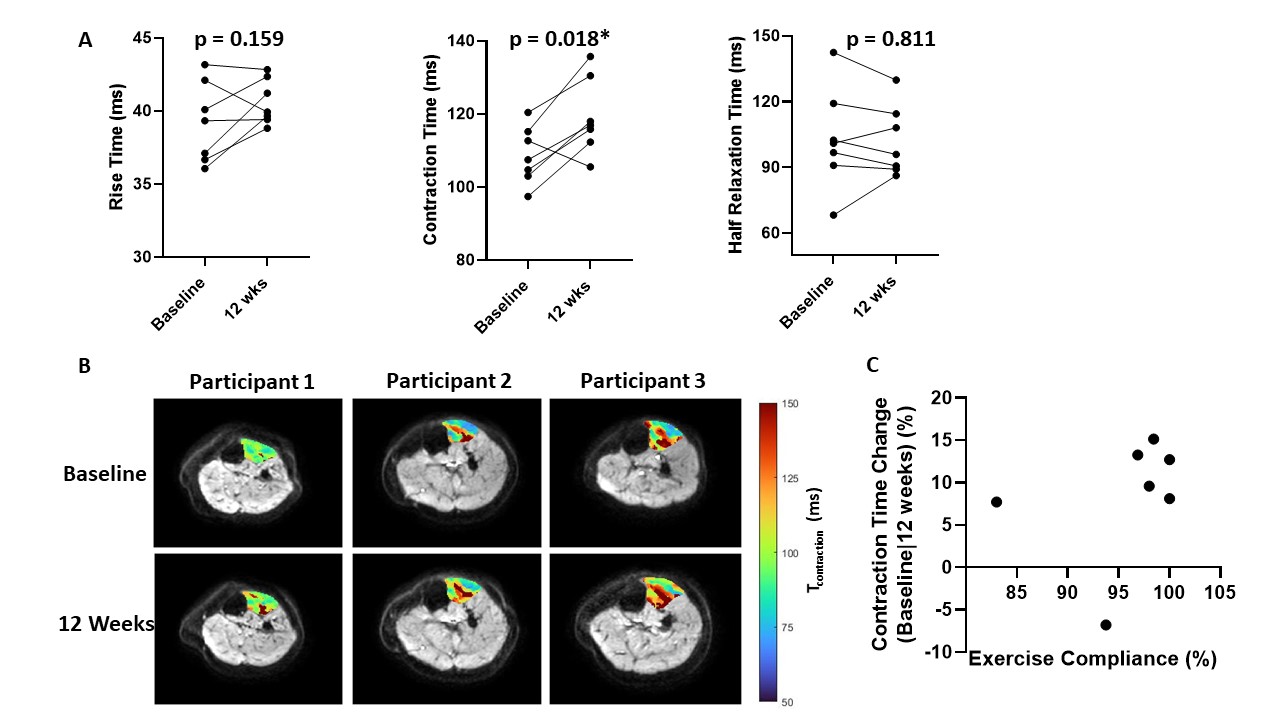
Results: Tcontract of the tibialis anterior was significantly longer in PMM participants post exercise; Trise, Thalf-relax demonstrated no change. In participants who had the highest adherence to exercise Tcontract increased the most.
Impact: Motor unit MRI (MUMRI) detected slower muscle contraction times in primary mitochondrial myopathies post resistance exercise programme. This may evidence increased numbers of type-I fibres post-exercise. MUMRI could be used to measure changes in muscle twitch dynamics in neuromuscular diseases.
Introduction
Primary mitochondrial myopathies (PMMs) lead to muscle fatigue and weakness. Resistance exercise has been shown to increase mitochondrial content in skeletal muscle in PMMs.1,2 Outcome measures in clinical trials focus on increased oxidative capacity. Typically, this involves a muscle biopsy, which is invasive, samples a tiny volume of muscle and gives limited information on muscle function.3 Motor Unit Magnetic Resonance Imaging (MUMRI) has shown promise in measurement of muscle twitch dynamics.4 We used MUMRI to measure tibialis anterior (TA) twitch dynamics in PMM participants before and after a 12-week exercise programme.Methods
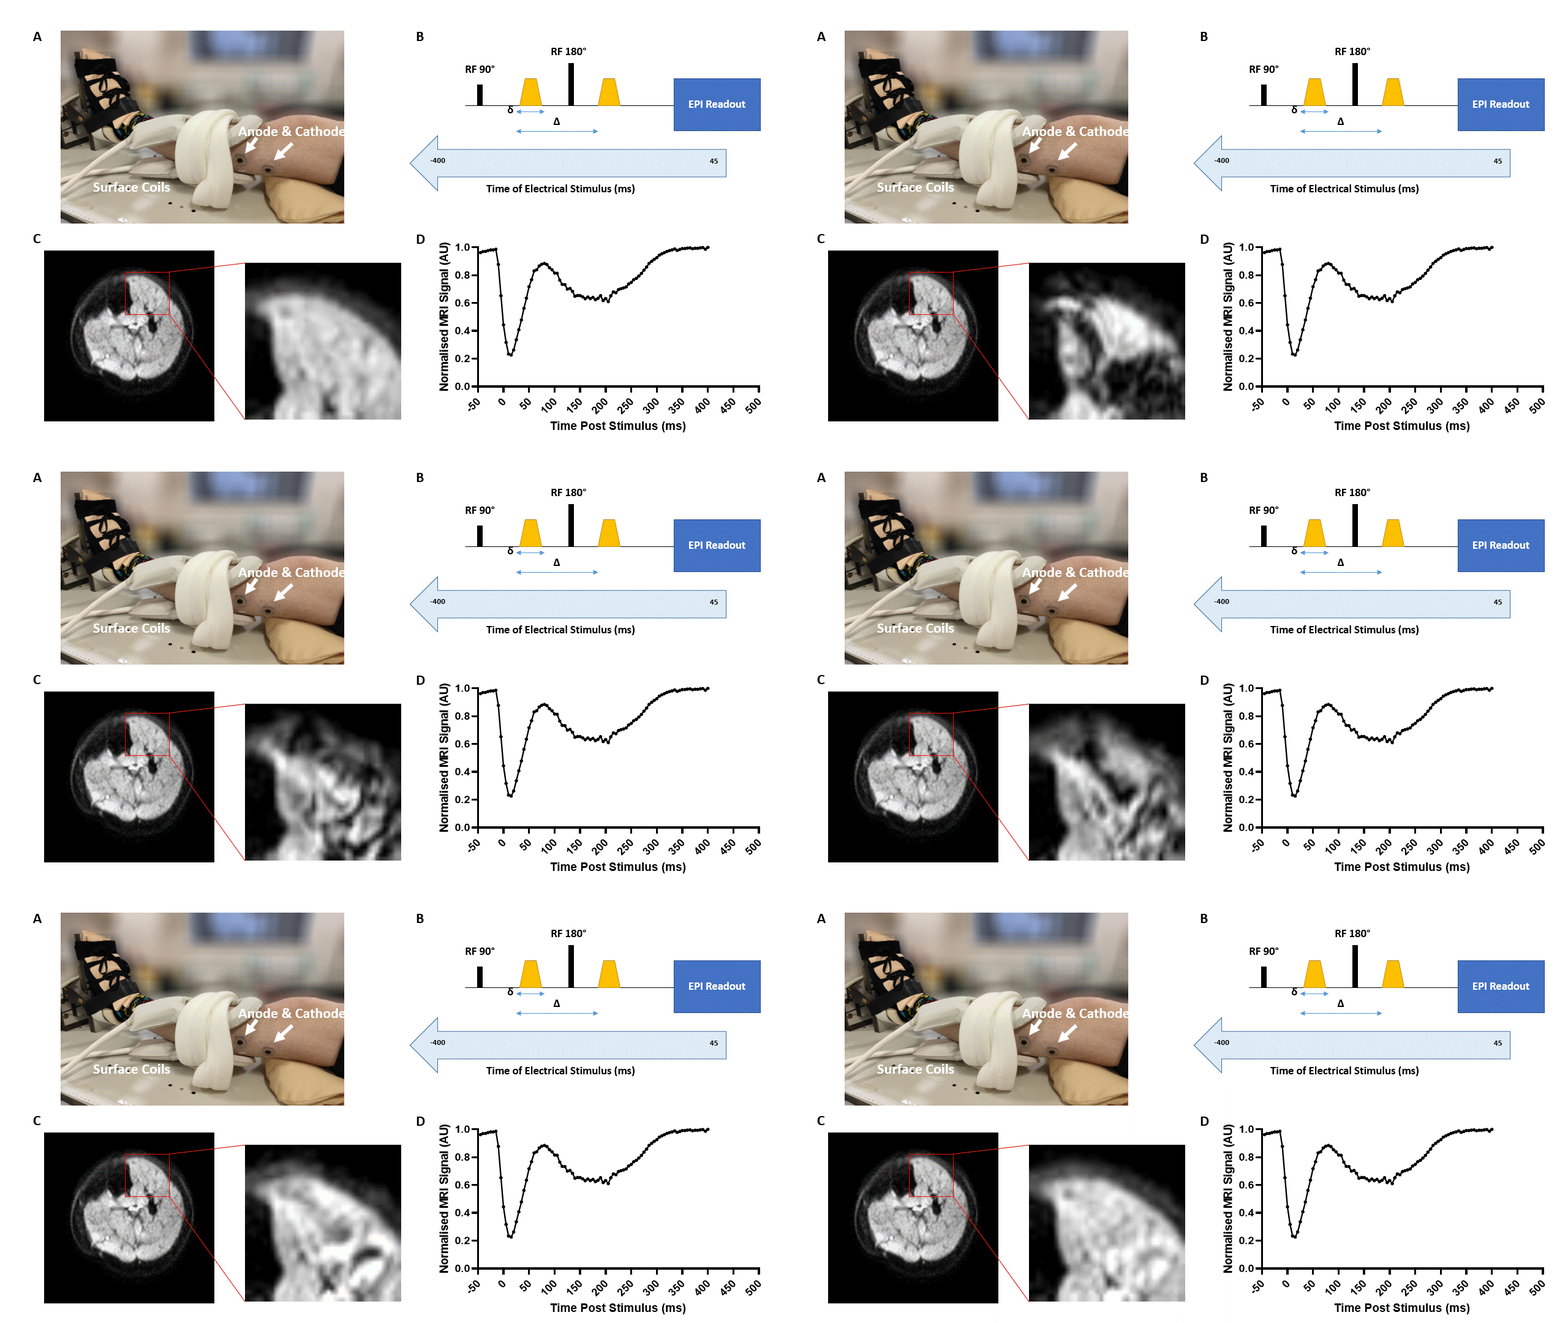
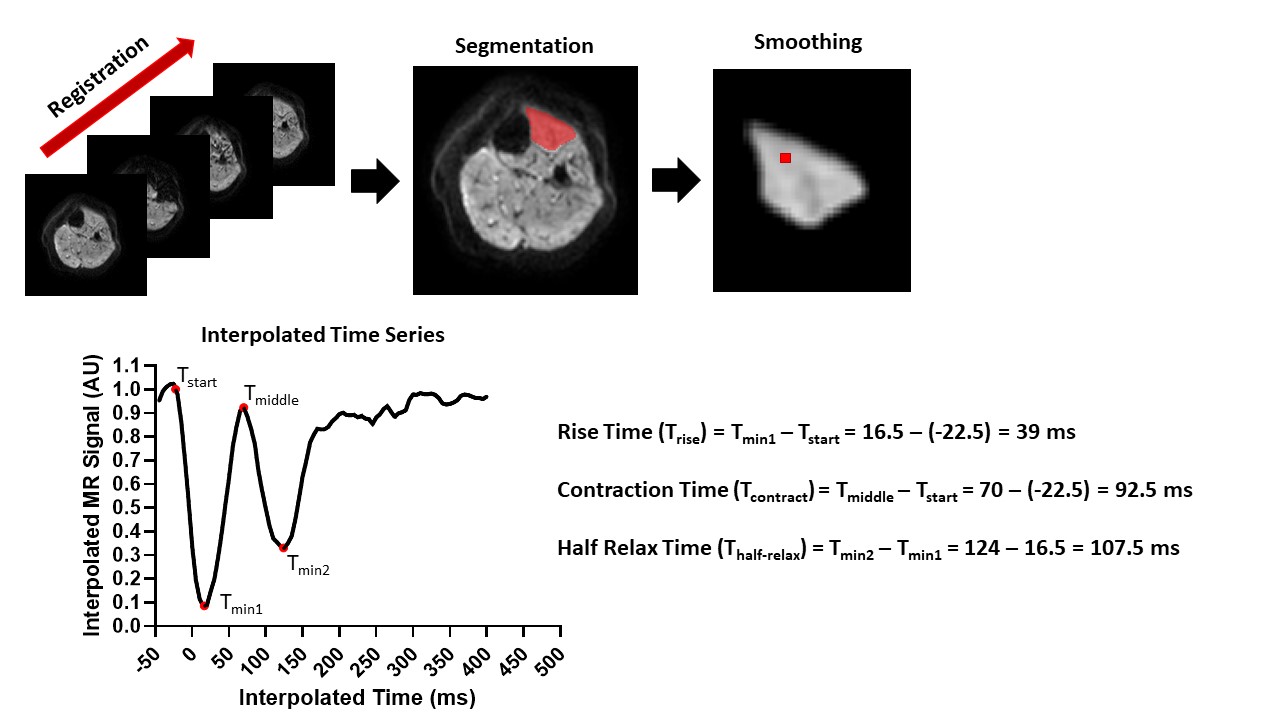
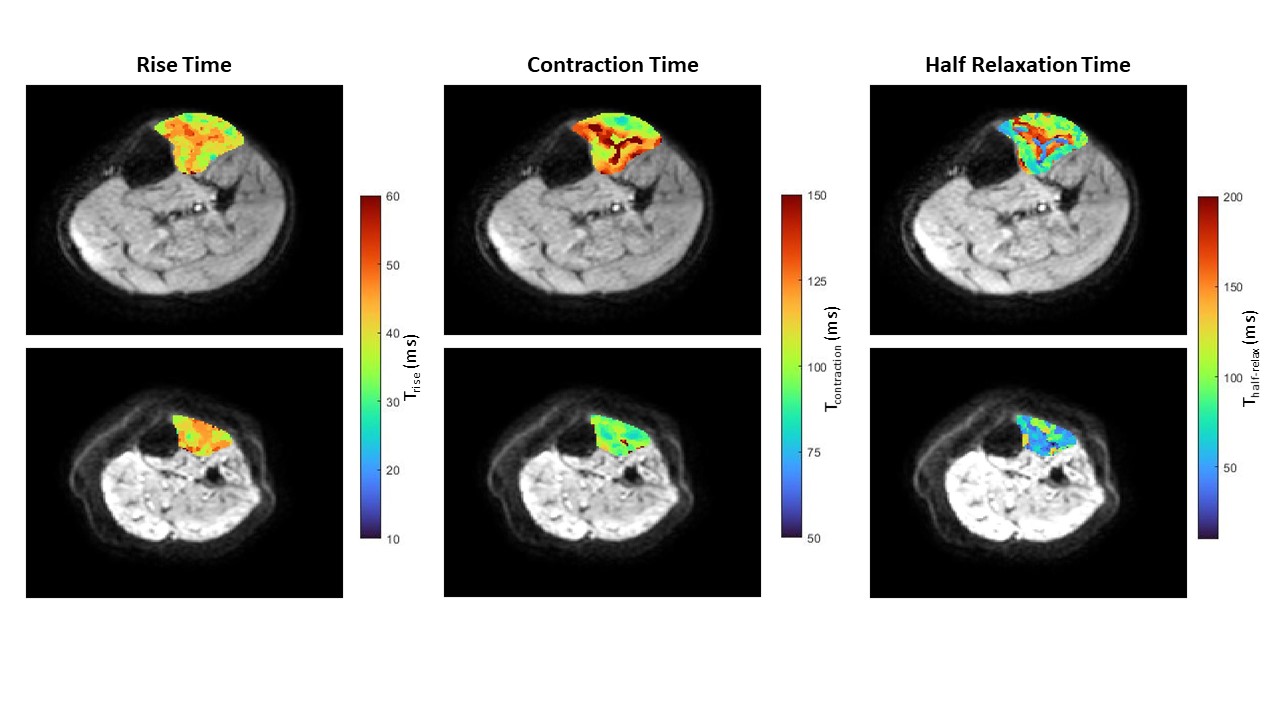
Data Acquisition: Left lower leg muscles of 10 healthy controls (mean ± SD, age: 45.8±11.4) and 9 participants with single deletion PMM (mean ± SD, age: 59.6±10.7) were scanned with a pulsed gradient spin echo (PGSE) sequence with echo planar imaging readout (field of view=160 x 160, in-plane resolution=1.5x1.5 mm, slice thickness=8 mm, slices=2, TR=1000 ms, TE=36 ms, b value=20 s/mm2, Δ/δ=16.9/2.2 ms). Their foot was strapped into an MR compatible force plate, with stimulating electrodes placed over the common peroneal nerve4 (figure 1A). First, the stimulation (Imuscle) was determined, i.e. the current that produced a visible muscle twitch and sufficient image contrast by gradually increasing the stimulation current from 0 mA to ~ 20 mA within ~20 acquisitions. The temporal shape of the muscle twitch of the TA was captured by repeating the PGSE sequence while stimulating the nerve with Imuscle and the stimulus gated between 400 ms before to 45 ms after the 90° radiofrequency pulse (in steps of 5 ms, 90 acquisitions; figures 1B-D). Repeatability of the technique was tested by repeating the scan twice in 5 controls.Data Analysis: Images were registered to the first image within the time series using a non-rigid registration in Matlab. The TA was delineated using a manual segmentation in ITKSnap. Voxel-wise, analysis was performed in Matlab, the time-series data from the region were smoothed and interpolated to a time step of 0.5ms. For each time-series four points were automatically calculated: the beginning of the signal change (Tstart), defined as the first time point at which the signal decreased to a value 3 times less than the standard deviation of the baseline, the first signal minima (Tmin1), in between the first and second signal minima (Tmiddle) and the second signal minima (Tmin2), figure 2. Voxel-wise twitch rise time (Trise), contraction time (Tcontract) and half-relaxation time (Thalf-relax) of the TA were then calculated and the average of all voxels taken (figure 3).
Exercise Programme: PMM participants underwent a 12-week home-based exercise programme (Giraffe Healthcare) with fortnightly remote monitoring. Exercises were predominantly lower limb, with mandatory exercises to activate TA. Participants recorded completed exercises in a diary, used to calculate compliance to the exercise programme and compared to the percentage change in Trise, Tcontract and Thalf-relax between baseline and post exercise programme.
Statistics: Trise, Tcontract and Thalf-relax were compared between controls and PMM participants at baseline using unpaired parametric students t-tests. Repeatability was assessed for each variable using the absolute average percentage difference between the two scans. Trise, Tcontract and Thalf-relax were compared for PMM participants between baseline and post exercise programme using paired parametric students t-tests. Results are presented as mean ± standard deviation.
Results
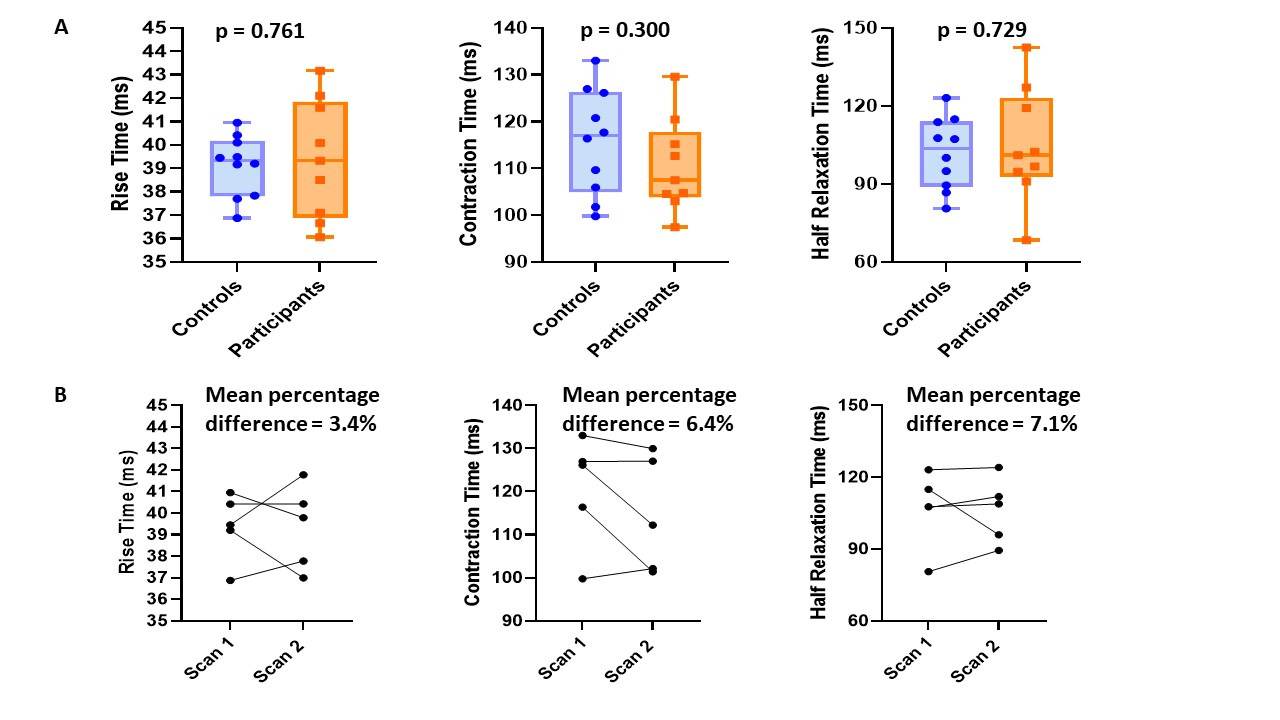
Baseline: No significant differences in Trise, Tcontract and Thalf-relax were detected between control and PMM participants, for Trise: controls-39.1±1.3 vs. PMM participants-39.4±2.5ms; p=0.761, for Tcontract: 115.8±11.3 vs. 110.6±10.0ms; p=0.300 and for Thalf-relax: 101.9±13.8 vs. 104.8±21.9ms; p=0.729 (figure 4A).Repeatability: Data were reproducible between the two scans, absolute percentage differences were (Trise=3.4%, Tcontract=6.4% and Thalf-relax=7.1%), figure 4B.
PMM participants: Two participants were lost to follow-up. Tcontract was significantly longer: baseline-108.7±7.9 vs. post-119.3±10.4ms; p=0.018. Trise was longer but not significant post exercise programme: 39.2 ± 2.8 vs. 40.6 ± 1.5ms; p=0.159. There was no difference in Thalf-relax: 103.0±23.1 vs. 102.1±16.0ms; p=0.811 (figure 5A-B). PMM participants who had the highest overall increase in Tcontract demonstrated the highest adherence to the exercise programme (figure 5C).
Discussion & Conclusions
Contraction times were significantly longer in PMM participants post-exercise programme. This may be due to the increased activity in type I fibres due to the exercise, leading to an increase in mitochondria and overall slower muscle twitch in the TA. Participants with the highest adherence to the exercise programme demonstrated the greatest increase in Tcontract, supporting the objective changes.In future, it will be important to compliment the observed changes in muscle twitch dynamics with 31P MRS to measure the metabolic recovery post exercise and use a muscle biopsy measure accompanying fibre type changes post exercise.
Acknowledgements
The authors are grateful to the participants who dedicated their time to take part in the study and the radiographers: Tim Hodgson, Dorothy Wallace and Louise Ward for scanning the participants. PMM participants were recruited through the Wellcome Centre for Mitochondrial Research Patient Cohort: A Natural History Study and Patient Registry (REC Ref: 13/NE/0326) and the Newcastle NHS Highly Specialised Services (HSS) for rare mitochondrial disorders.References
1) Cejudo P, Bautista J, Montemayor T, Villagómez R, Jiménez L, Ortega F, Campos Y, Sánchez H, Arenas J. Exercise training in mitochondrial myopathy: A randomized controlled trial. Muscle and Nerve, 2005, 32(3), pg. 342 – 350.
2) Adhihetty PJ, Irrcher I, Joseph AM, Ljubicic V, Hood DA. Plasticity of skeletal muscle mitochondria in response to contractile activity, Experimental Physiology 2003, 88(1), pg. 1 – 190.
3) Stefanetti RJ, Blain A, Jimenez-Moreno C, Errington L, Shiau Ng Y, McFarland R, Turnbull DM, Newman J, Gorman GS. Measuring the effects of exercise in neuromuscular disorders; as systematic review and meta-analyses. Wellcome Open Research 2020, 5, pg. 84.
4) Heskamp L, Birkbeck MG, Whittaker RG, Schofield IS, Blamire A. The muscle twitch profile assessed with motor unit magnetic resonance imaging. NMR in Biomedicine, 2021, 34(3), e4466.
Figures