0893
Distinct laminar neurovascular and metabolism responses across eccentricity revealed by multi-contrast visual fMRI at 7T1Laboratory of FMRI Technology (LOFT), Mark & Mary Stevens Neuroimaging and Informatics Institute, Keck School of Medicine, University of Southern California, Los Angeles, CA, United States, 2Vivian L. Smith Department of Neurosurgery, UTHealth Houston Medical School, Houston, TX, United States, 3Department of Neuroscience, Baylor College of Medicine, Houston, TX, United States
Synopsis
Keywords: Task/Intervention Based fMRI, High-Field MRI, Arterial spin labeling, cortical layers, calibrated fMRI, CMRO2, negative BOLD
Motivation: To better understand the complex interplay between neurovascular responses and metabolism.
Goal(s): The goal was to develop a multi-contrast laminar fMRI tool to concurrently measure CBF, CBV, BOLD, and CMRO2 signals.
Approach: We employed a novel pulse sequence to simultaneously acquire ASL CBF, VASO CBV, and T2-BOLD signals at a high spatial resolution of 7T. We also incorporated a calibrated fMRI approach (Davis model) to calculate CMRO2, using parameters estimated from breath-hold induced hypercapnia.
Results: We found distinct neurovascular and metabolic responses across cortical layers and eccentricities in response to a ring-shaped visual stimulus.
Impact: Multi-contrast laminar fMRI significantly impacts neuroscientific research by providing a more comprehensive understanding of neurovascular (CBF, CBV, BOLD) and metabolic (CMRO2) interactions across cortical layers. It opens doors for exploring complex brain functions and disorders.
Background
The complex interplay between neurovascular responses and metabolism requires careful interpretation of fMRI signals. For instance, negative BOLD responses (NBR) in fMRI could possibly be associated with increased or decreased neuronal activity1. The concurrent measurement of cerebral blood flow (CBF), cerebral blood volume (CBV), BOLD, and cerebral metabolic rate of oxygen (CMRO2) signals would be an invaluable tool to investigate underlying vascular and metabolic activities across cortical layers2. We have developed a novel pulse sequence6 that enables the simultaneous acquisition of ASL CBF, vascular space occupancy (VASO)3, and T2 GRASE BOLD signals with high spatial resolution at 7T. In this study, we employed a calibrated fMRI approach (Davis model4) to calculate CMRO2 with breath-hold (BH) induced hypercapnia. The goal of this study is to explore distinct neurovascular and metabolic responses induced by a ring-shaped visual stimulus across cortical layers and eccentricities.Method
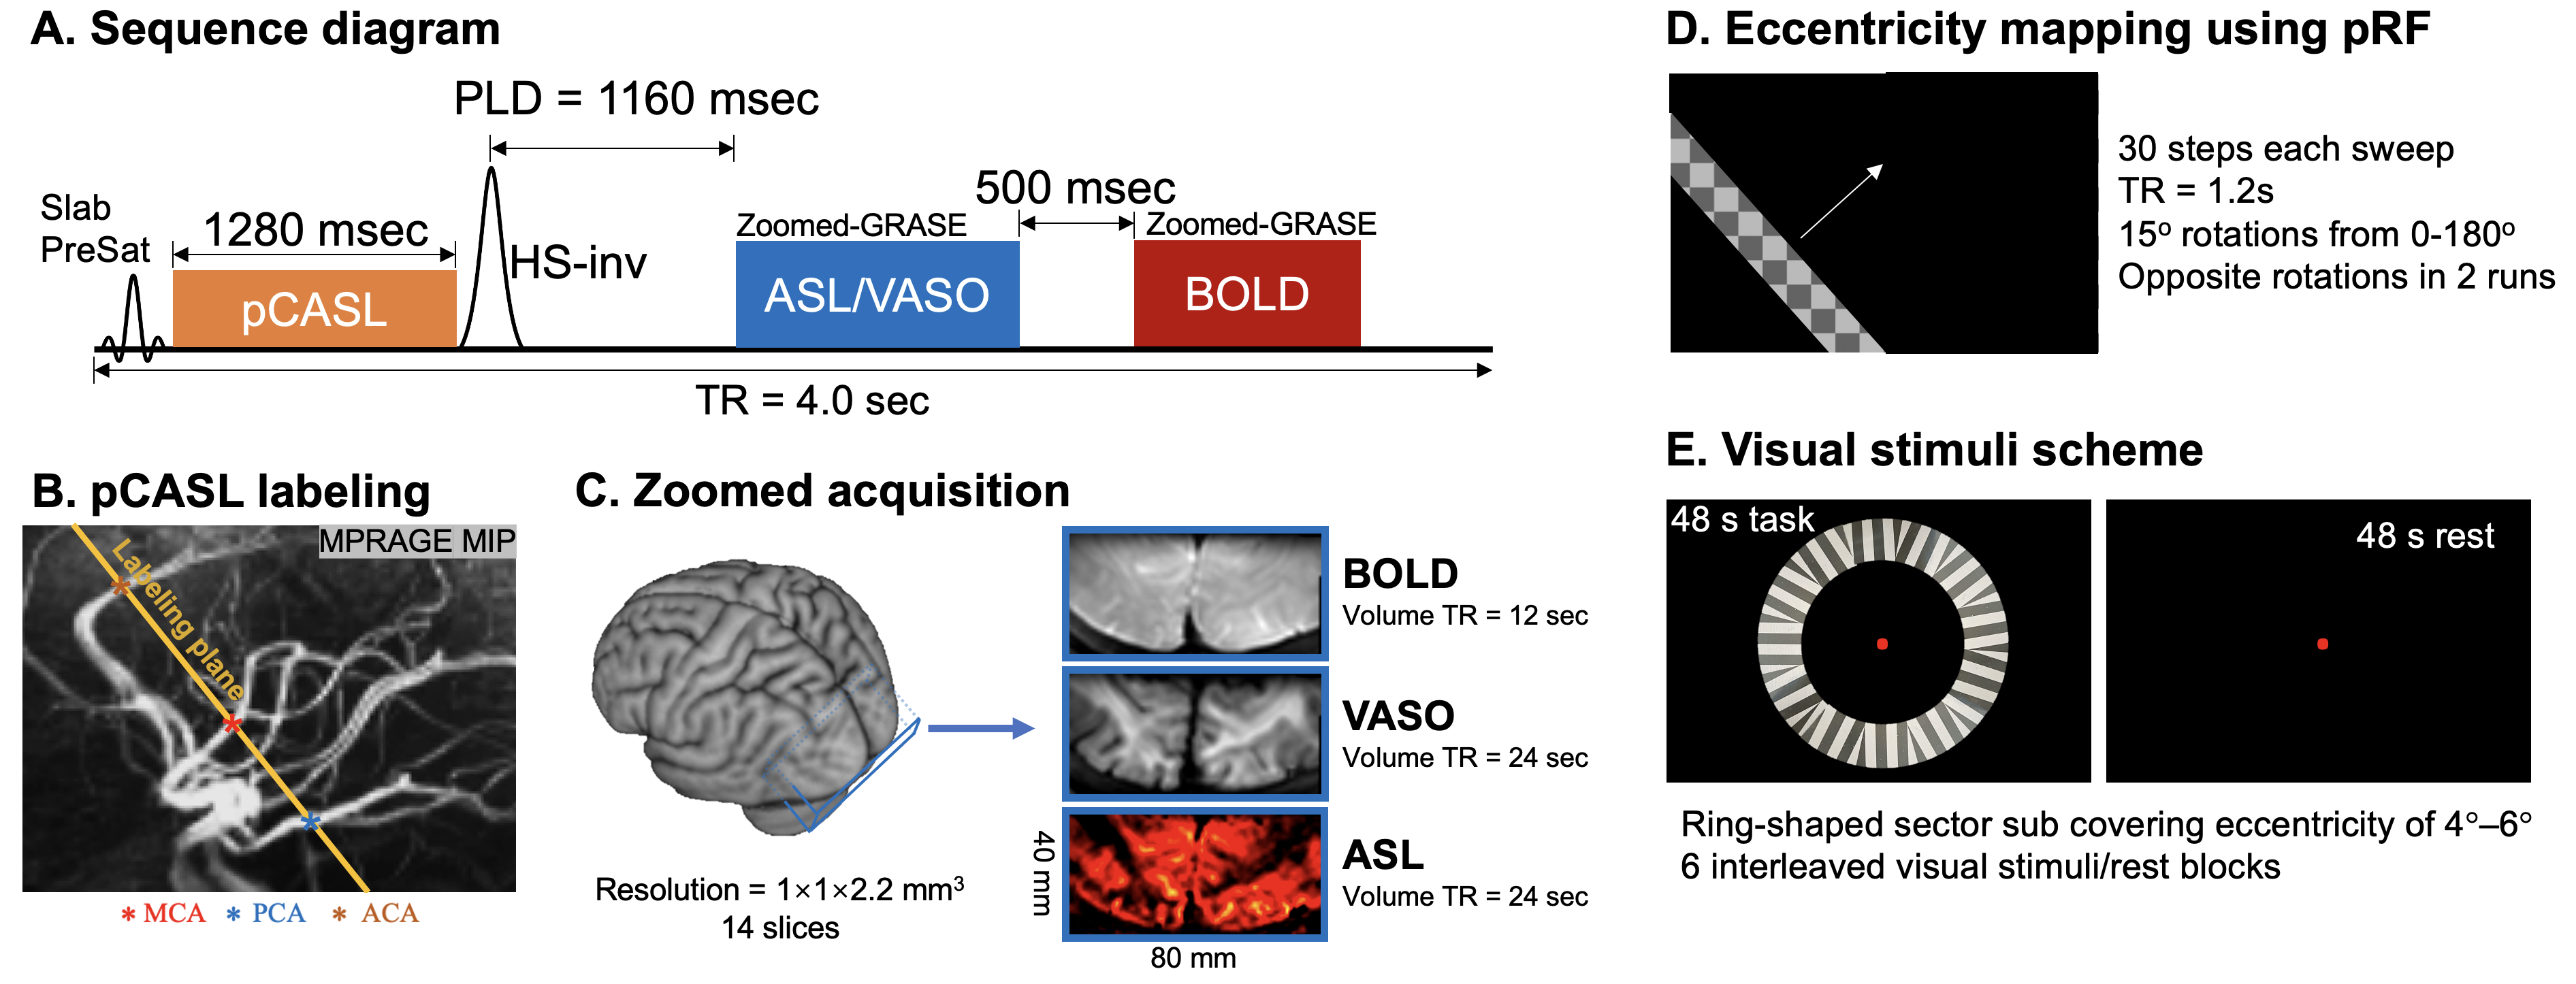
MRI experiments: We developed a novel pulse sequence6 to simultaneously acquire ASL CBF, VASO and T2 BOLD signals with high spatial resolution at 7T (Fig.1A). Imaging parameters were: FOV=80×40mm2, 14 slices, 1-mm2 in-plane resolution and 2.2mm slice thickness.CBF was calculated with simulated labeling efficiency of 82.1%5,6. VASO signals were divided by BOLD to minimize venous contamination and then used to calculate CBV changes3. AFNI/SUMA and custom python codes were used to generate the equi-volume surfaces between WM and pial surfaces from MP2RAGE (0.7 mm3 isotropic). 8 cortical layers were then projected back to volume space. Concurrently measuring CBF, CBV and BOLD changes allow us to calculate CMRO2 using the Davis model4:
$$\Delta BOLD = M\times(1-\% CMRO_2 \times \%CBV \times \%CBF^{-\beta}) $$
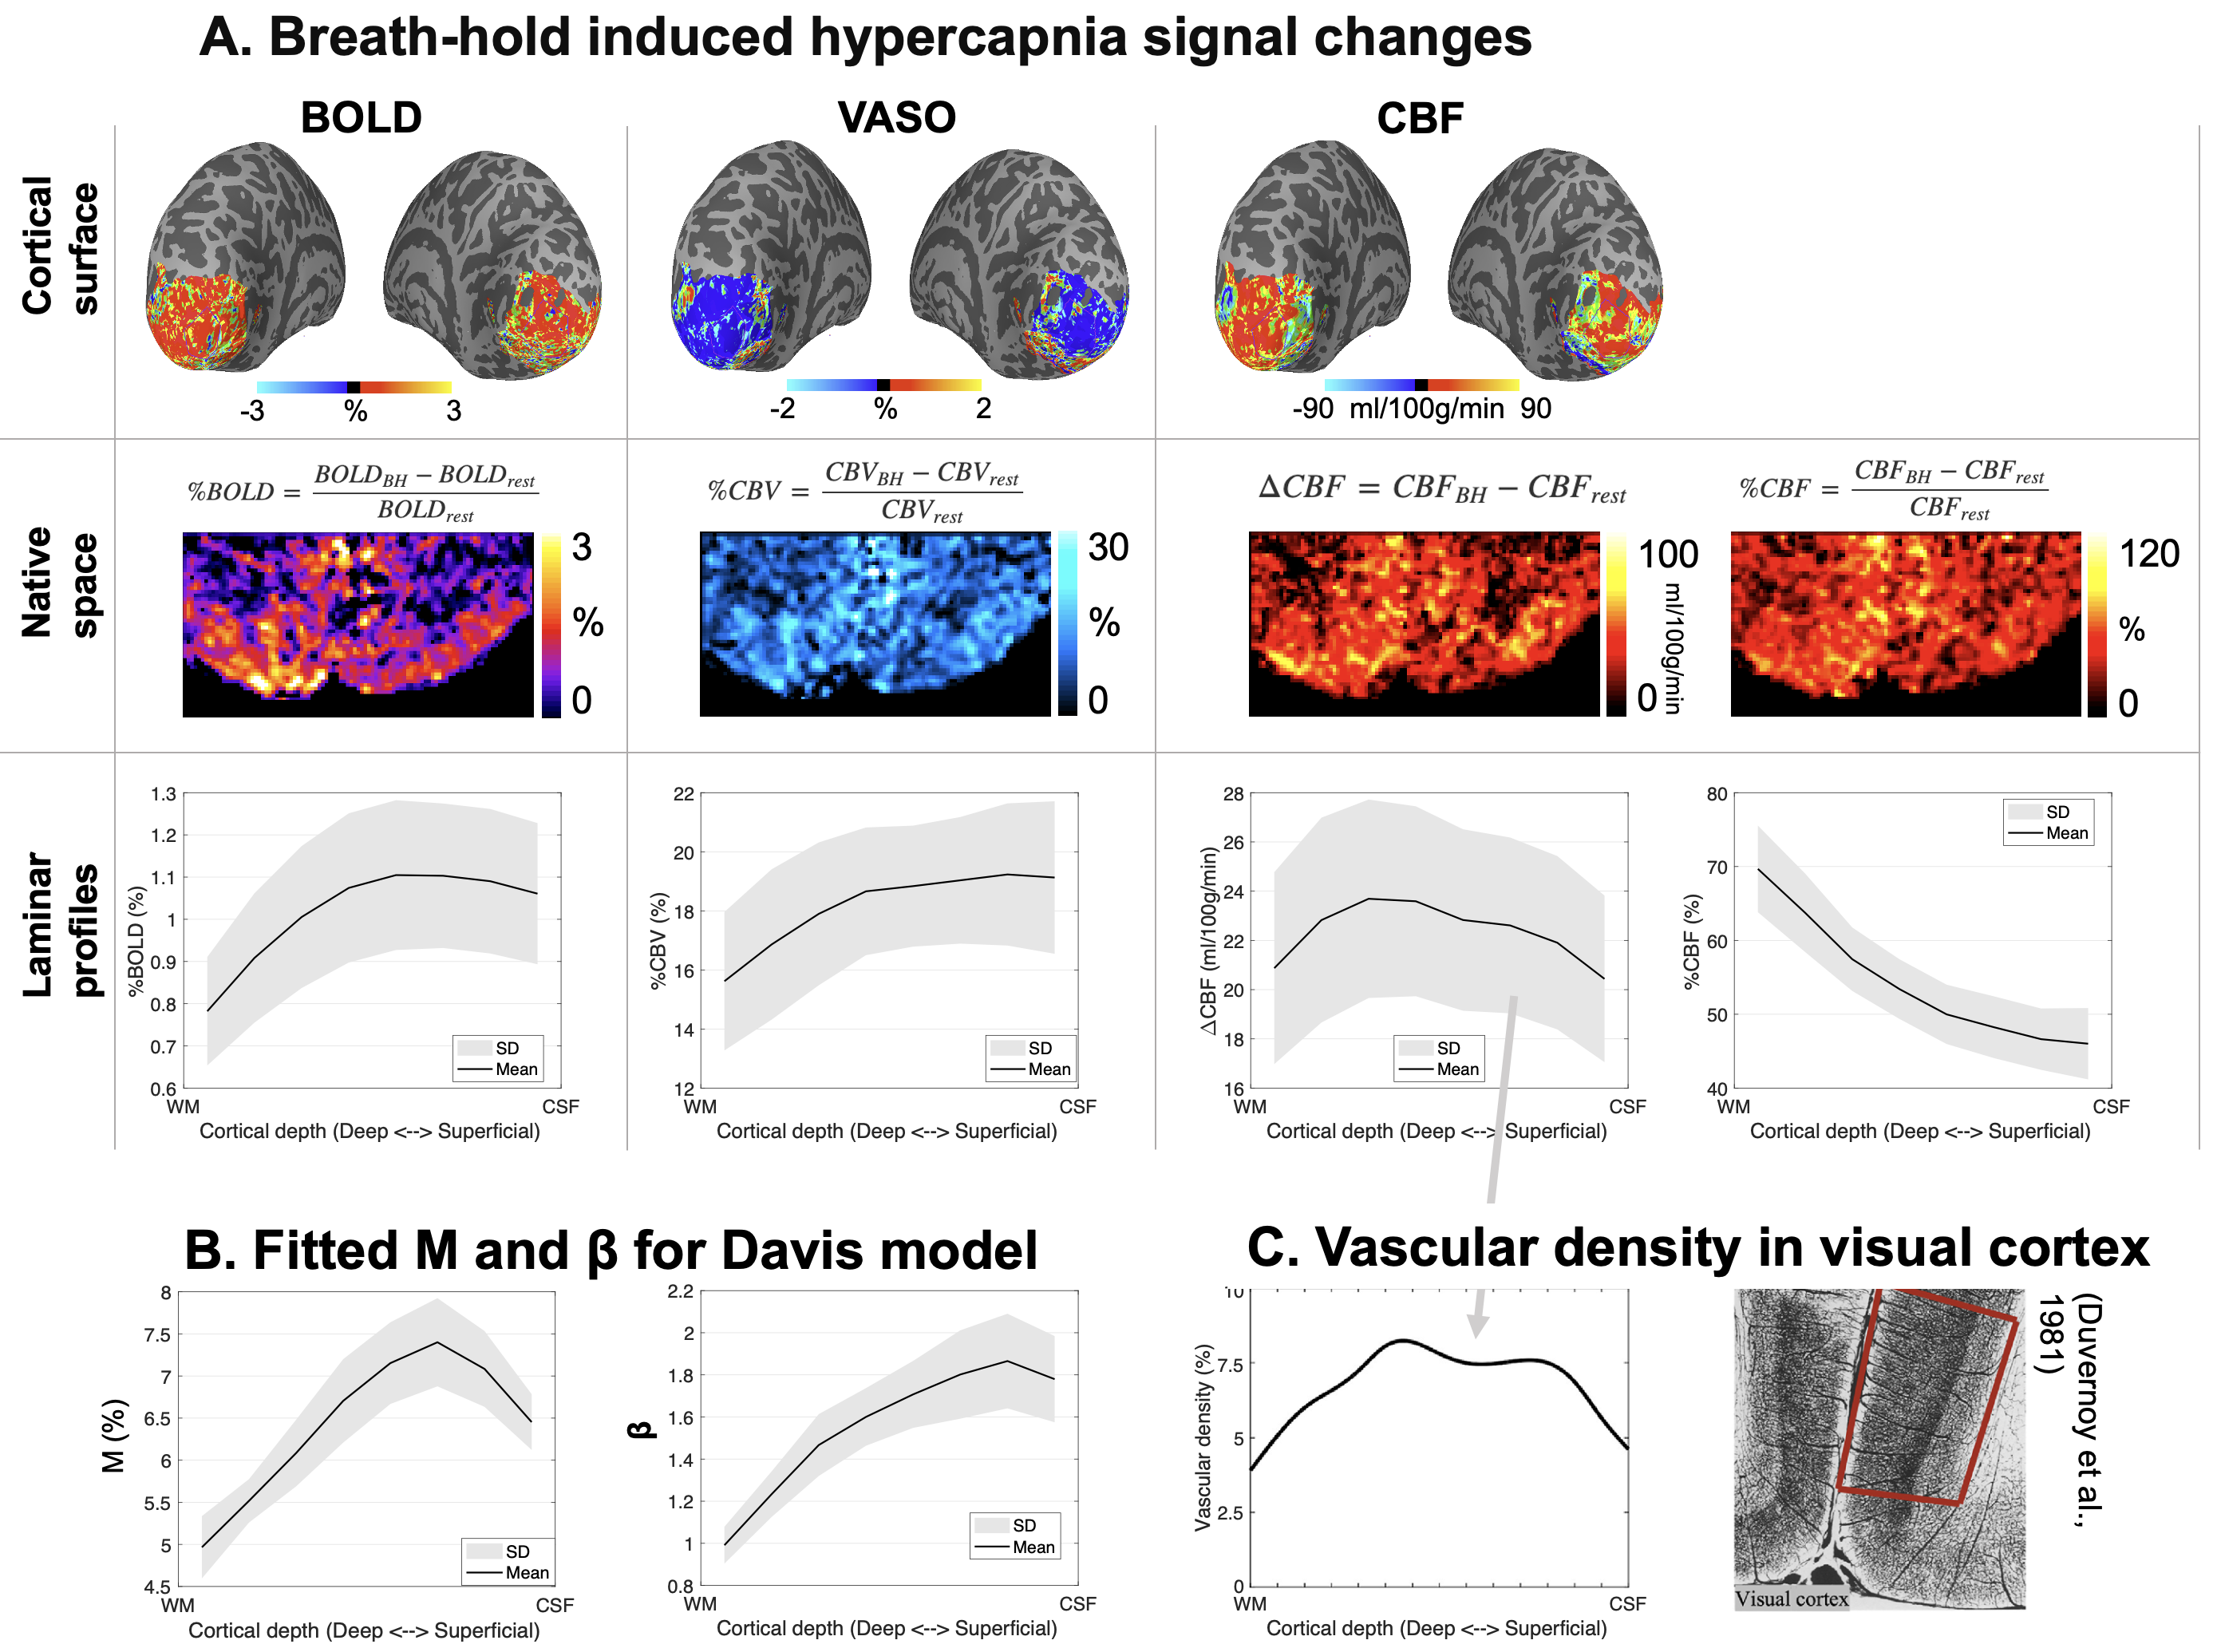
Estimation of M and β with BH hypercapnia: Two runs of multi-contrast fMRI were acquired with 12 cycles of interleaved 24s rest and 24s BH (19min20s). Assuming CMRO2 does not change during hypercapnia, we can estimate M and β using CBF, CBV, and BOLD signals between resting state and BH.
Measuring eccentricity with a population receptive field (pRF) stimulus: We used a flickering checkerboard stimulus that sweep across the screen, sequentially stimulating different visual field (Fig.1D). We collected two pRF runs using 1.6 mm³ isotropic EPI, and acquired 420 volumes in 8min24s for each run. Eccentricity masks from 0 to 8o within V1 were then reconstructed from the BOLD signals.
fMRI experiments: We conducted fMRI experiments using visual stimulus consisted of a mean-gray background with a ring-shaped sector covering an eccentricity range of 4° to 6° (Fig.1E). Each subsector contained a high-contrast (100%) radial grating that reversed contrast at 4Hz. Each run comprised six blocks of 48s of visual stimulus followed by 48s rest, and four runs were acquired in 39mins.
Six subjects (3M/3F, age=25.2±4.1 years) underwent MRI scans for all 3 experiments on a Siemens 7T Terra scanner with a NOVA 1Tx/32Rx head coil.
Results and discussion
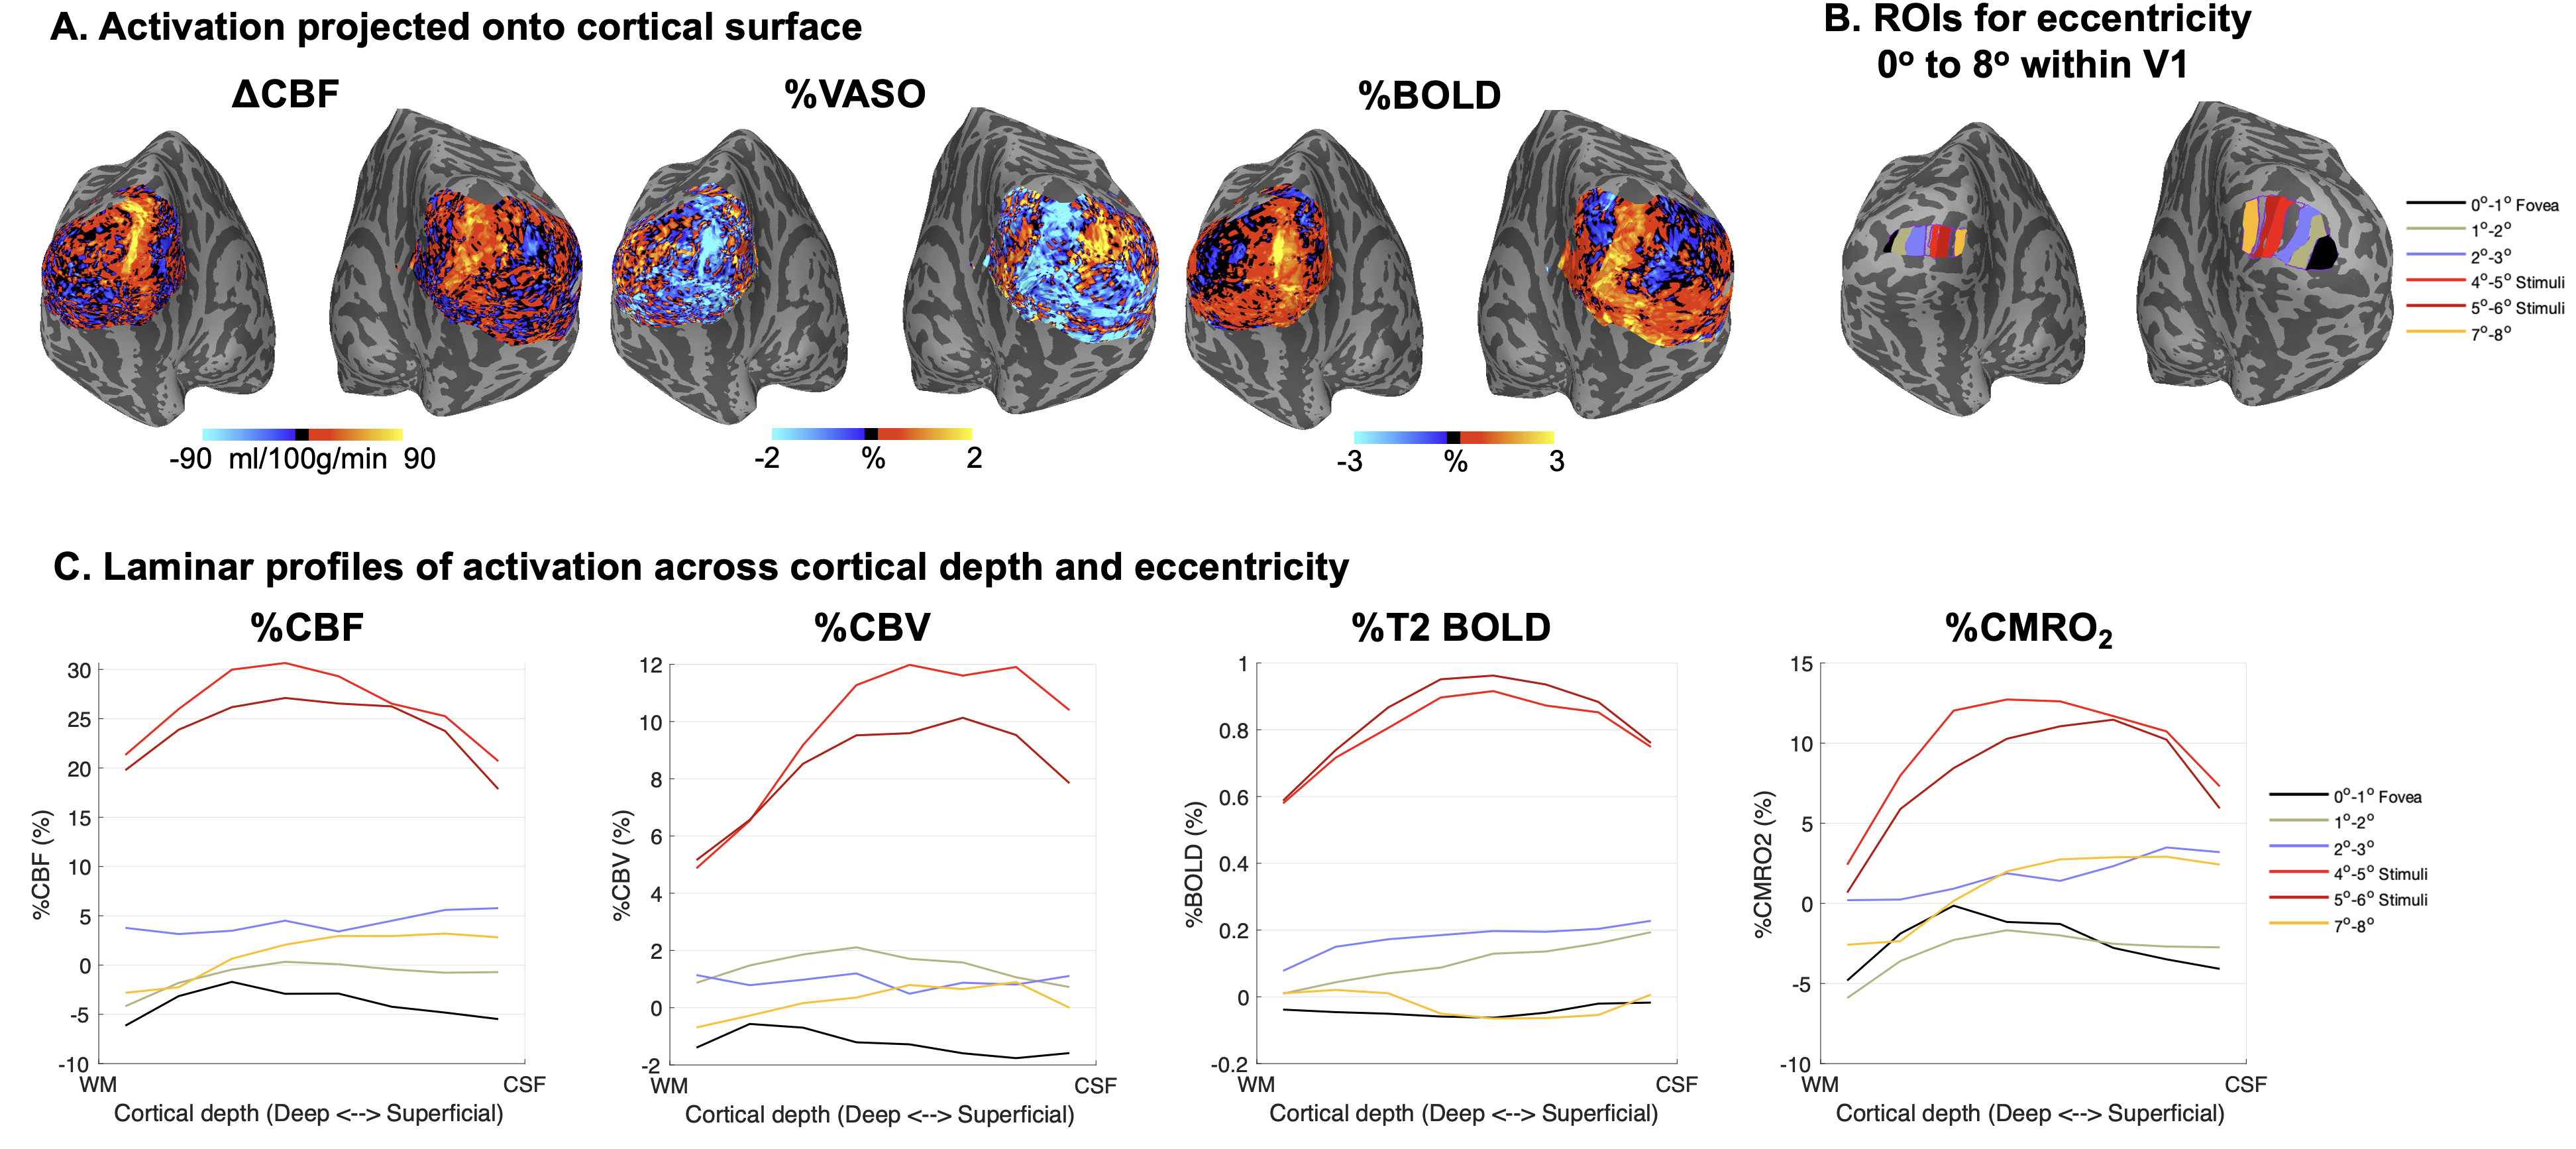
Fig.2 shows hypercapnia induced BOLD, VASO/CBV, and CBF changes. A global increase in BOLD and CBF and decrease in VASO can be observed. The peak in CBV increase within superficial layers is likely due to the larger dilation of pial vessels. Absolute CBF increase (ΔCBF) exhibits a laminar profile closely matching with the vascular density in V17, indicating the accuracy of our measurements. On average, BH induced 1.0±0.1% BOLD increase, 18.2±1.3% CBV increase and 54.5±8.6% CBF increase across layers. Laminar profiles of M peaked in middle layers while β towards superficial layers with average of 6.4±0.9% and 1.6±0.4 cross layers, respectively.Fig.3 shows fMRI results. We observed a clear increase in CBF and BOLD signals, and a decrease in VASO within the 4-6 eccentricity range, while opposite responses were found in adjacent regions. Distinct patterns of neurovascular and metabolism responses to the visual stimulus were observed:
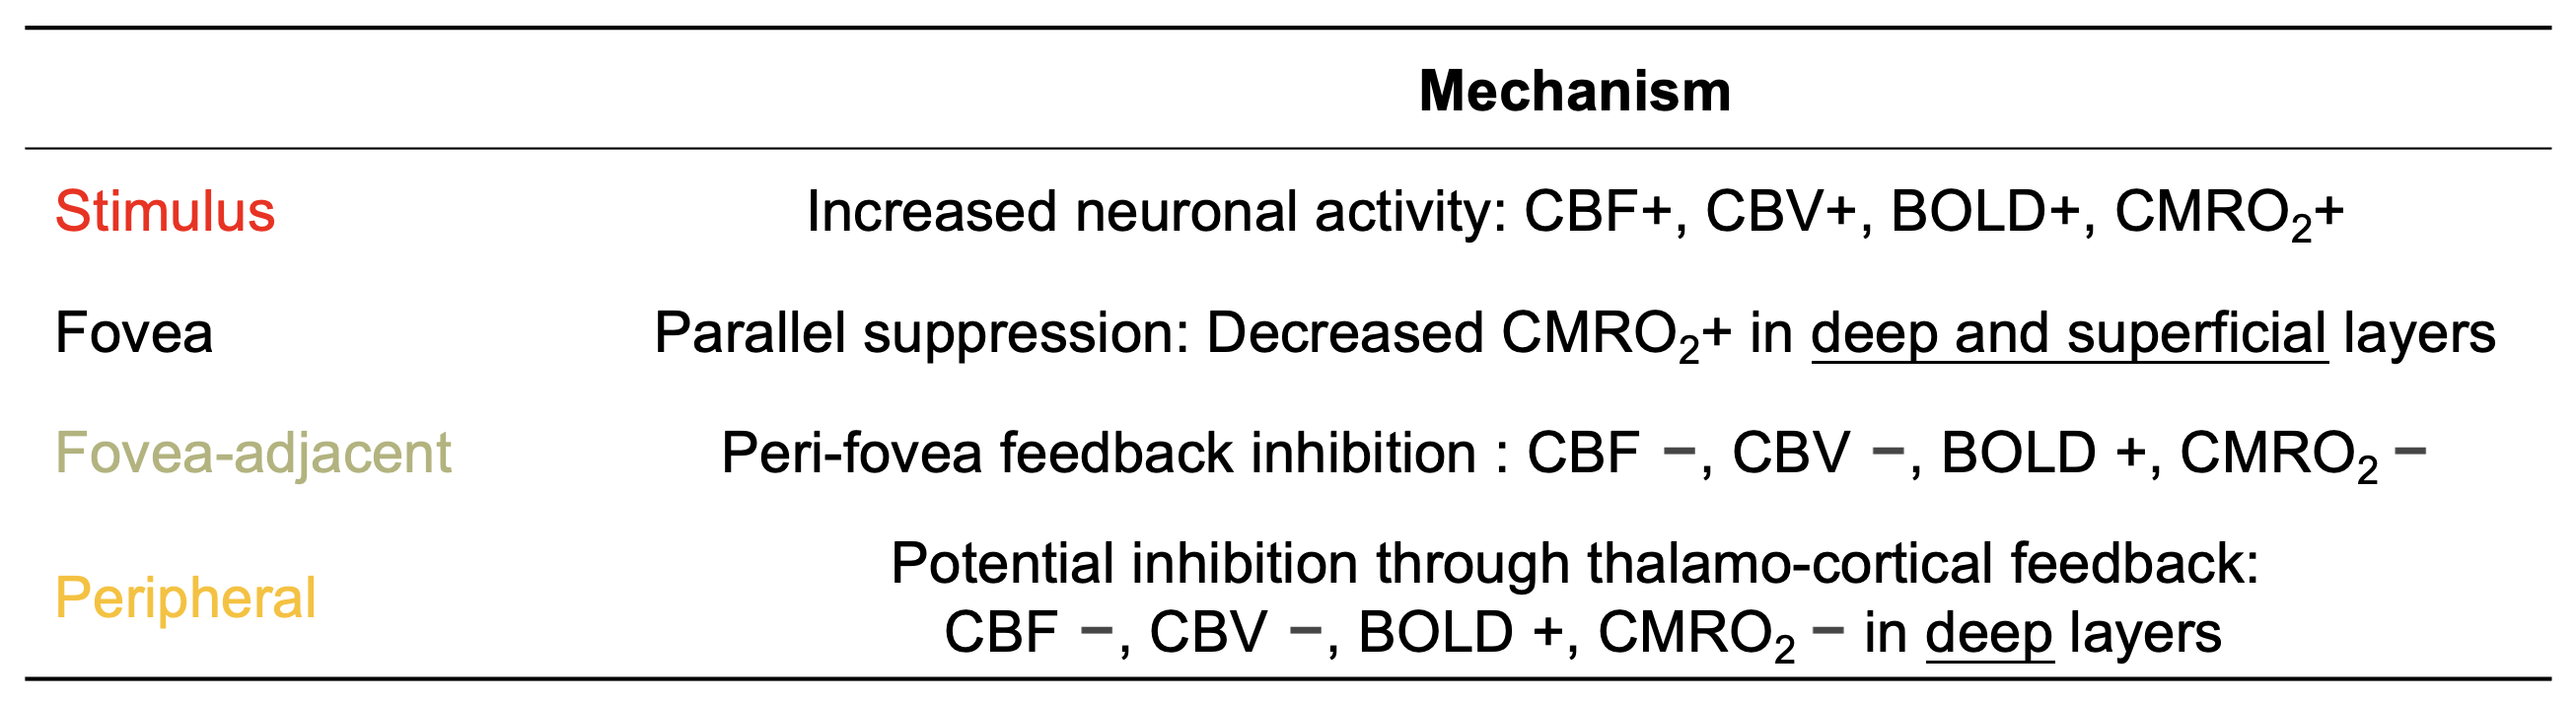
1) Significant increases in CBF, CBV, BOLD, and CMRO2 within the 4-6o (stimulus), indicating increased neuronal activity.
2) Inhibition to the fovea, as evidenced by decrease in CMRO2 in both deep and superficial layers (0-1o, feedback pathway from higher visual cortex8).
3) Despite an increase in BOLD, we observed decreases in CBF, CBV, and CMRO2 in the eccentricity adjacent to the fovea (1-2o), suggesting peri-fovea feedback inhibition.
4) A similar pattern in the peripheral region (7-8o) and (2-3o) with reduced CMRO2 in deep layers, with opposite responses in superficial layers, suggesting potential inhibition through thalamo-cortical feeback8.
The hypothesized mechanisms underlying these four patterns of signal responses are summarized in Table 1.
Conclusion
Concurrent mapping of CBF, CBV, T2 BOLD and CMRO2 delineates distinct neurovascular and metabolic responses across cortical layers and eccentricities, leading to a better understanding of the complex interplay between neurovascular dynamics and cerebral metabolism.Acknowledgements
This work was supported by National Institute of Health (NIH) grant S10-OD025312, R01-NS114382, R01-EB032169 and R01-EB028297.References
1. Schridde U, Khubchandani M, Motelow JE, Sanganahalli BG, Hyder F, Blumenfeld H. Negative BOLD with large increases in neuronal activity. Cerebral cortex 2008;18(8):1814-1827.
2. Yang Y, Gu H, Stein EA. Simultaneous MRI acquisition of blood volume, blood flow, and blood oxygenation information during brain activation. Magnetic Resonance in Medicine: An Official Journal of the International Society for Magnetic Resonance in Medicine 2004;52(6):1407-1417.
3. Huber L, Handwerker DA, Jangraw DC, Chen G, Hall A, Stüber C, Gonzalez-Castillo J, Ivanov D, Marrett S, Guidi M. High-resolution CBV-fMRI allows mapping of laminar activity and connectivity of cortical input and output in human M1. Neuron 2017;96(6):1253-1263. e1257.
4. Davis TL, Kwong KK, Weisskoff RM, Rosen BR. Calibrated functional MRI: mapping the dynamics of oxidative metabolism. Proceedings of the National Academy of Sciences 1998;95(4):1834-1839.
5. Alsop DC, Detre JA, Golay X, Günther M, Hendrikse J, Hernandez‐Garcia L, Lu H, MacIntosh BJ, Parkes LM, Smits M. Recommended implementation of arterial spin‐labeled perfusion MRI for clinical applications: a consensus of the ISMRM perfusion study group and the European consortium for ASL in dementia. Magnetic resonance in medicine 2015;73(1):102-116.
6. Shao X, Guo F, Shou Q, Wang K, Jann K, Yan L, Toga AW, Zhang P, Wang DJ. Laminar perfusion imaging with zoomed arterial spin labeling at 7 Tesla. NeuroImage 2021;245:118724.
7. Duvernoy HM, Delon S, Vannson J. Cortical blood vessels of the human brain. Brain research bulletin 1981;7(5):519-579.
8. Liu C, Guo F, Qian C, Zhang Z, Sun K, Wang DJ, He S, Zhang P. Layer-dependent multiplicative effects of spatial attention on contrast responses in human early visual cortex. Progress in Neurobiology 2020:101897.
Figures