0892
Decoding directionality of information in cortical networks using layer-based connective field model1Laboratory of Preclinical MRI,Champalimaud Experimental Clinical Research Programme, Champalimaud Foundation, Lisboa, Portugal, 2Donders Institute for Brain Cognition and Behaviour, Nigmegen, Netherlands
Synopsis
Keywords: Functional Connectivity, Brain Connectivity, BOLD, difusion fMRI, visual system, connective field model
Motivation: To disentangle feedback and feedforward signals in cortical circuits.
Goal(s): To unravel the intricate neural connections within cortical layers.
Approach: We implemented a layer connective field (lCF) model and applied it to ultrafast RS data and RS dfMRI data.
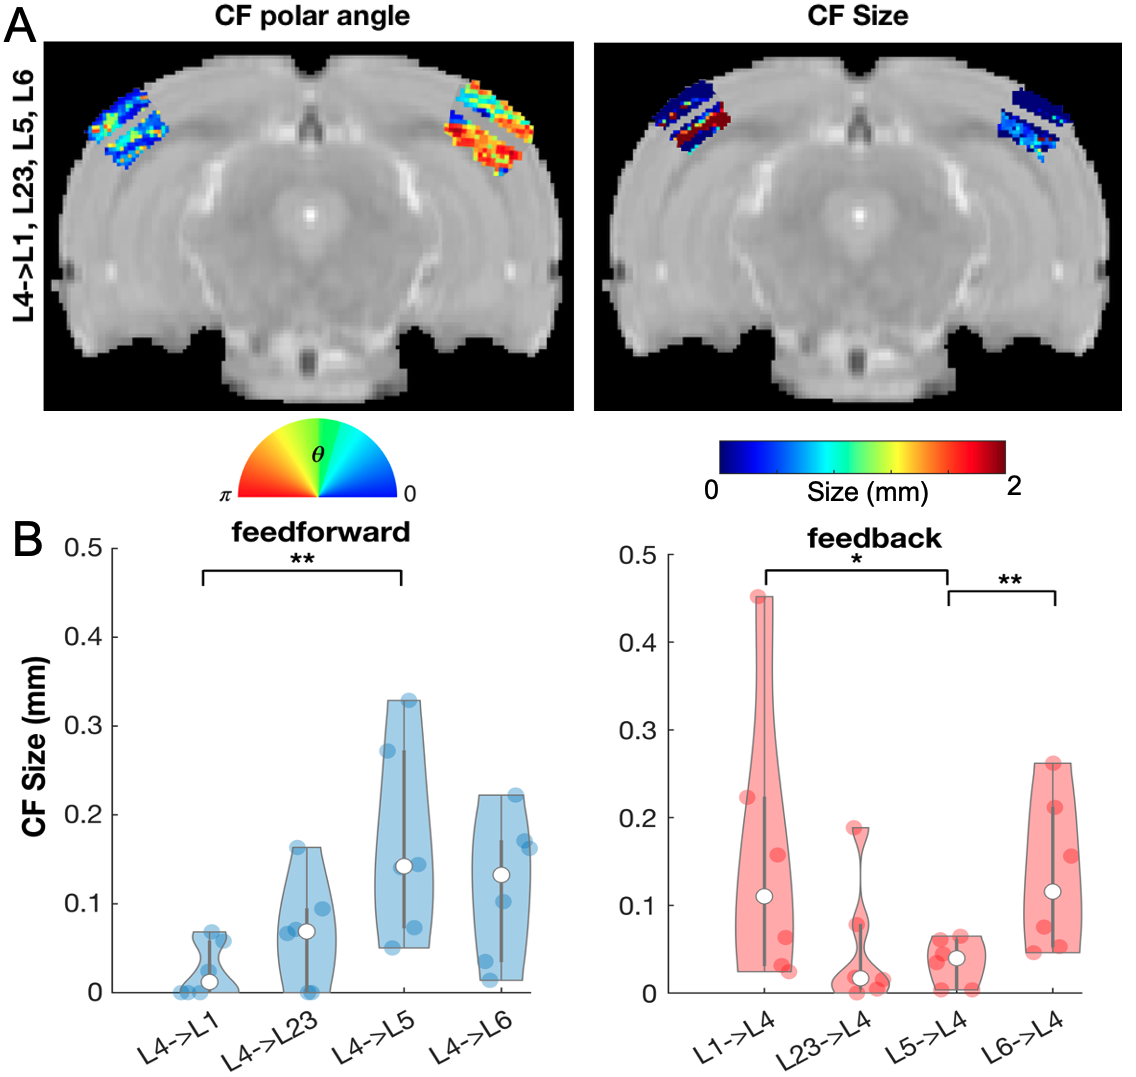
Results: 1.Intracortical lCF shows two lCF size profiles: feedforward with inverse U shape with the larger lCF sizes at layer 5 and feedback with U shape and larger CF sizes at superficial and deeper layers. 2.In the absence of visual input the functional connectivity reflects visuotopic organization. 3.lCF estimates obtained from dfMRI(ADC) are more layer specific than the ones estimated from BOLD.
Impact: This study showcases the ability of high spatio-temporal resolution MRI techniques (ultrafast BOLD and dfMRI) when coupled with biologically grounded connectivity models (lCF) to unveil the intricacies of information directionality within topographically organized cortices.
Introduction:
Decoding the intricate directionality of information flow within cortical circuits remains a paramount challenge in neuroimaging. Advanced fMRI techniques enable measuring cortical layers at high temporal resolution, but a model characterizing how neurons in a given cortical layer process the signals from other layers is still lacking. The Connective Field (CF) model translates the concept of receptive field (RF) into the domain of connectivity by predicting the activity in one brain area as a function of the aggregate activity in other brain regions1. Insofar the CF model has only been applied between distinct brain areas, leaving out the possibility to decipher the underlying neural connectivity across cortical layers. Here, we applied the CF model to characterize functional connectivity between cortical layers (lCF) in ultrafast resting state (RS) fMRI data and to RS diffusion fMRI data.Methods:
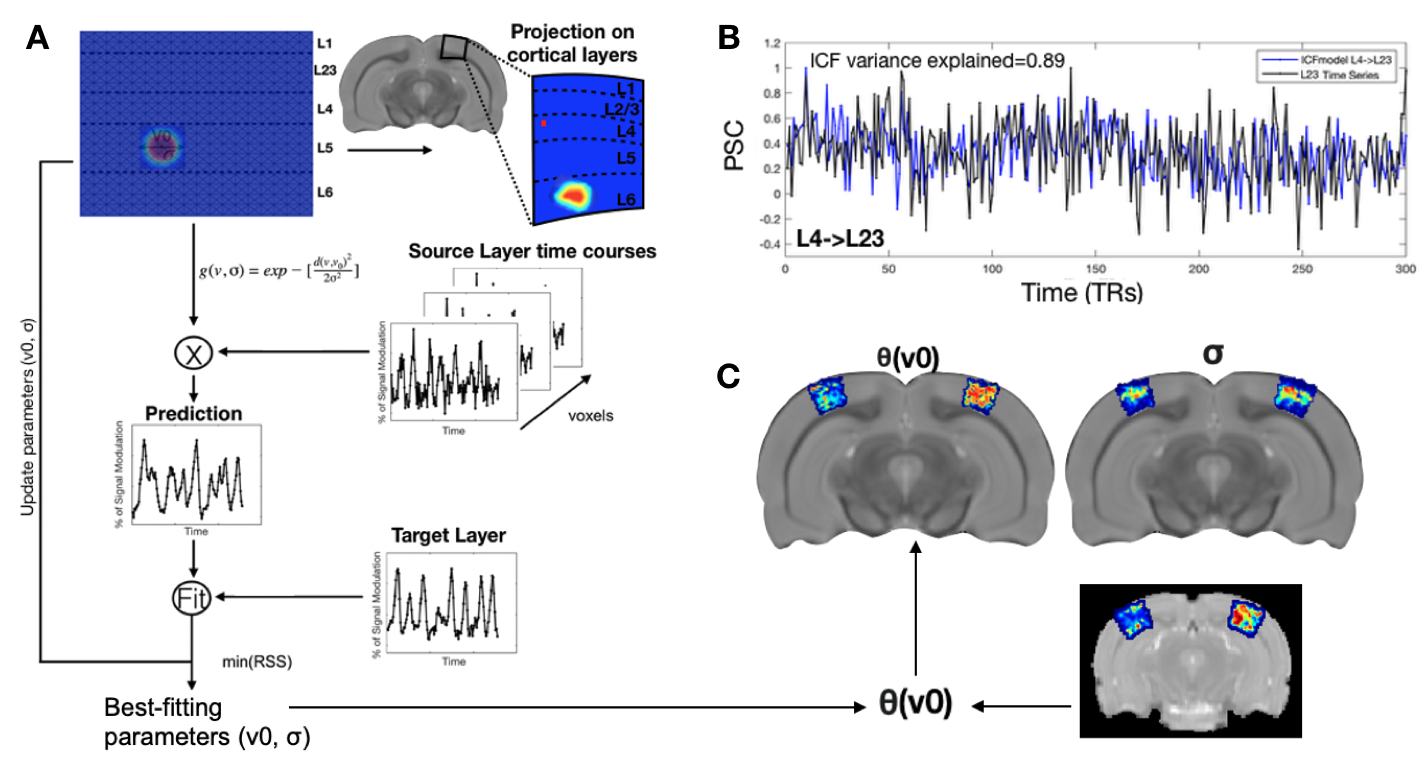
All animal experiments were pre-approved by the competent institutional and national authorities and were carried out according to European Directive 2010/63. N=12 adult Long Evan rats (7 Females) were scanned on a 9.4T Biospec scanner using an 86mm resonator for transmittance and a rat cryoprobe for reception, under medetomidine sedation. Two different acquisitions were performed: BOLD (N=6), dfMRI (N=6). BOLD: Two scanning sessions were acquired (retinotopic mapping and ultrafast RS). Retinotopy: Multislice GE-EPI acquisition parameters included: TE/TR=16.7/1500 ms, FOV=20.5x20.5 mm2, resolution=228x228 μm2, slice thickness=0.7mm. During the second session, three RS datasets were obtained using GE-EPI acquisitions from: a multislice (MS) set; a visual cortex (VC) and visual pathway (VP) slice sets: FOV=20.5x20.5mm2, resolution=228x228μm2, tacq=21.5min, TE/TR(MS)=12/350ms; TE/TR(VC/VP)=1212/50ms; slice thickness (MS)=0.7mm. Diffusion fMRI: One scanning session with visual stimulation and RS paradigms (b= 1.2 ms/μm2 and b=0.05 ms/μm2; TE/TR=45/750ms, FOV=20x20mm2, resolution=250x250μm2, slice thickness=1.2mm, tacq=21.5min.) Preprocessing: Images were NORDIC denoised, slice-timing and motion corrected, coregistered, normalized to the SIGMA2 atlas. Layer Connective field model (lCF) builds on the work of 1, pipeline shown in Fig.1AResults:
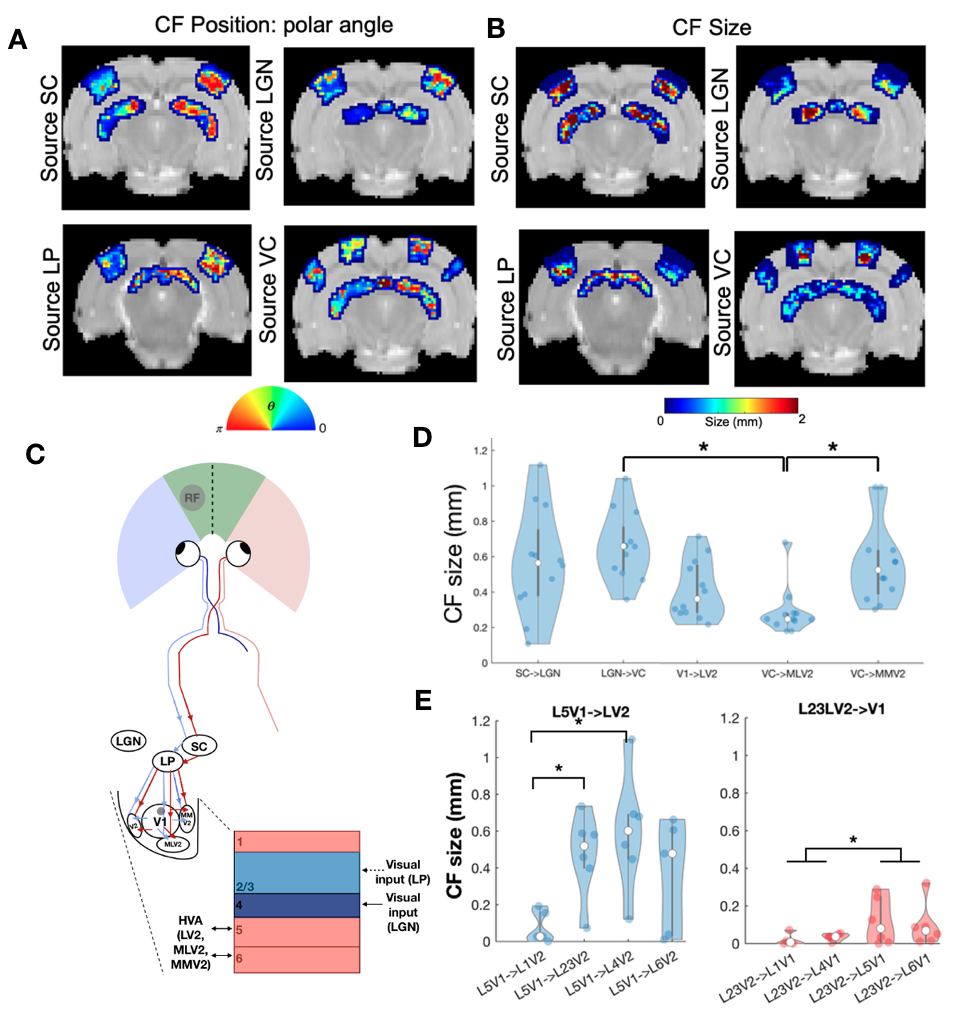
We successfully implemented the lCF and applied it to ultrafast RS data and dfMRI data. Fig.1B shows that lCF predictions capture very well the variance of the target layers ( variance explained(L4->L23)=0.89).The CF and lCF position maps estimated from ultrafast RS data (Fig.2A and Fig.3A) show retinotopic organization. CF size, which reflects the source layer sampling extent, revealed that deeper layers have larger lCF sizes than superficial layers, Fig.2B. This is in agreement with deeper layers receiving feedback information from higher visual areas. Furthermore intracortical lCF between layers of VC showed two different CF size profiles: feedforward (L4 projecting to all the other layers of the cortex) with inverse U shape with the larger lCF sizes at layer 5 and feedback with a U shape with the larger CF sizes at superficial (L1) and deeper layers (L6). Similar CF size profiles were also found between V1 and V2 Fig2.E, reflecting the underlying neural architecture. The CF size estimated from interarea connections also varies between visual areas Fig.2D.
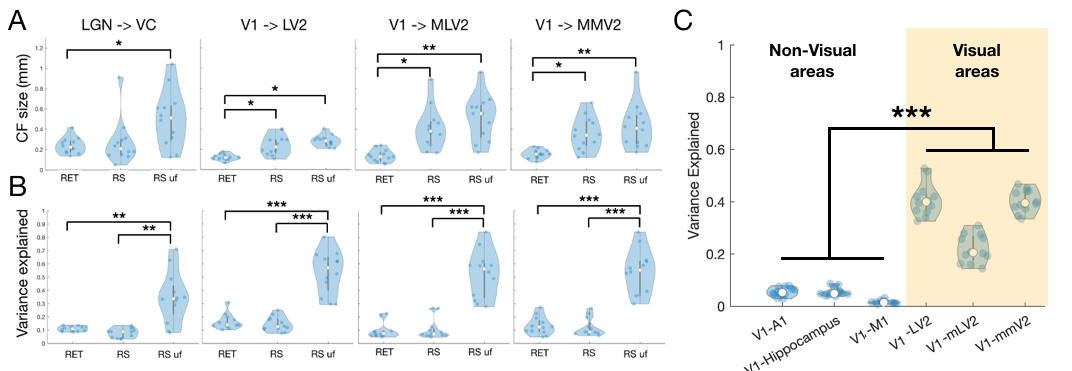
To confirm that larger CF sizes are associated with feedback signals, we computed CFs during visual stimulation and RS. CFs estimated during visual stimulation (reflecting predominantly feedforward connections) have significantly smaller size than CFs estimated during RS (spontaneous activity is thought to be feedback dominated) Fig 4A. Fig 4C shows the reliability of the CF model, CF estimated from functionally connected areas (i,.e V1 to other visual areas) have a higher variance explained than areas that are not linked.
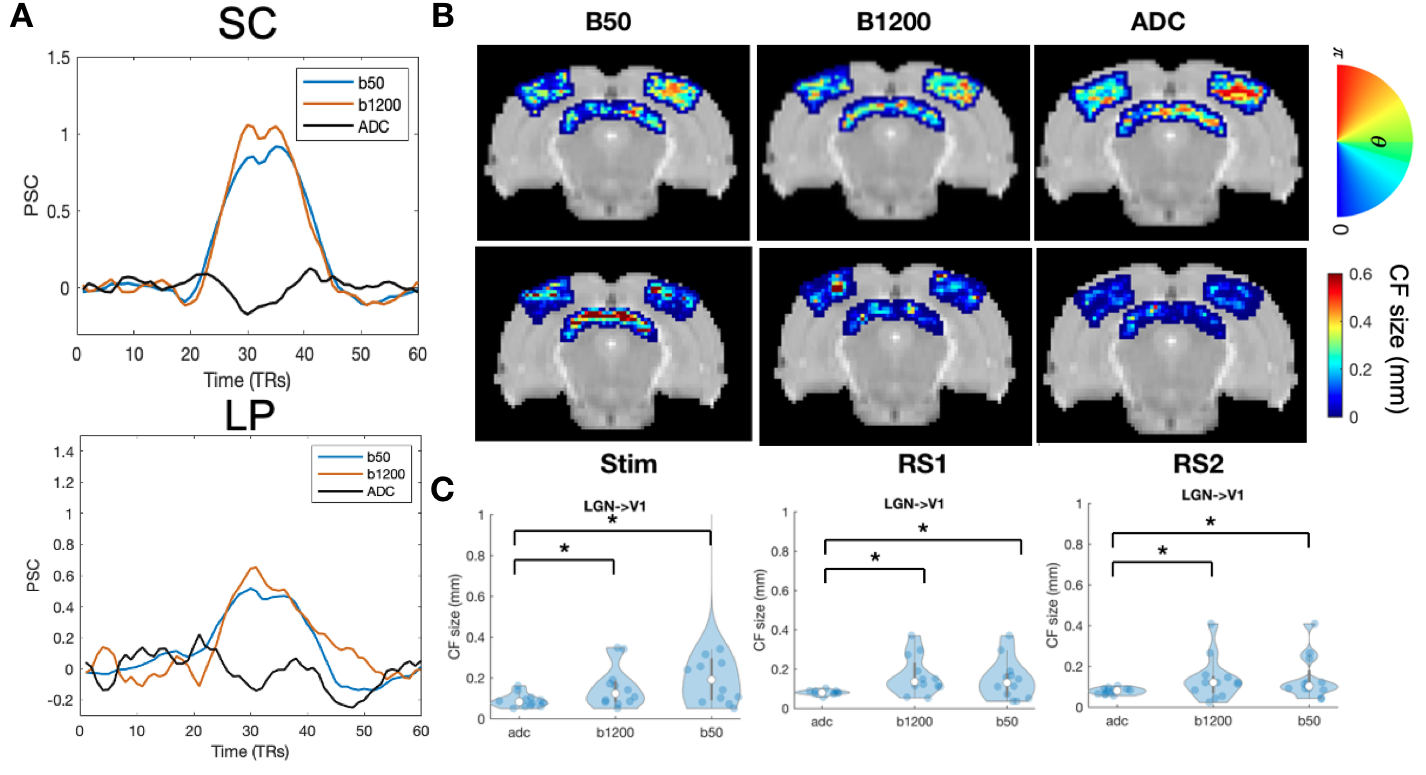
Finally we applied lCF to dfMRI RS data which provides more layer specificity than BOLD3 (Fig5). Indeed the CF estimates obtained from the RS ADC signal results in more clear retinotopic maps than the ones obtained from b=50 (~BOLD). In addition the CF size obtained from the ADC signals is significantly smaller than BOLD, and it seems to be more layer specific Fig5 B and 5C.
Conclusion:
The application of lCF model to ultrafast RS data shows that, even in the absence of visual input the functional connectivity reflects visuotopic organization. Notably (l)CF exhibits enhanced performance when applied to ultrafast fMRI data as depicted in Fig.4B. The size profiles of CFs enable the disentanglement of feedback and feedforward signals, with larger lCF sizes primarily observed in deeper cortical layers. This observation aligns with the idea that in the visual system L5 and L6 carry the feedback information to L4 . Our findings are in line with the underlying neural architecture, i.e V1 axon terminals have denser projections in L5 and L64,5 and are consistent with prior fMRI studies6,7.Acknowledgements
This study was supported by funding from the European Union’s Horizon 2020 research and innovation programme under the Marie Sklodowska-Curie grant agreement No.101032056 (PlastiMap) and Fundação para a Ciência e Tecnologia R&D programme project ID 2022.07889.PTDC (BOLDissect)References
1. Haak, K. V. et al. Connective field modeling. Neuroimage 66, 376–384 (2013).
2. Barrière, D. A. et al. The SIGMA rat brain templates and atlases for multimodal MRI data analysis and visualization. Nat. Commun. 10, 5699 (2019).
3. Nunes, D., Ianus, A. & Shemesh, N. Layer-specific connectivity revealed by diffusion-weighted functional MRI in the rat thalamocortical pathway. Neuroimage 184, 646–657 (2019).
4. Shen, S. et al. Distinct organization of two cortico-cortical feedback pathways. Nat. Commun. 13, 6389 (2022).
5. Semedo, J. D. et al. Feedforward and feedback interactions between visual cortical areas use different population activity patterns. Nat. Commun. 13, 1099 (2022).
6. Kok, P., Bains, L. J., van Mourik, T., Norris, D. G. & de Lange, F. P. Selective Activation of the Deep Layers of the Human Primary Visual Cortex by Top-Down Feedback. Curr. Biol. 26, 371–376 (2016).
7. Fracasso, A., Petridou, N. & Dumoulin, S. O. Systematic variation of population receptive field properties across cortical depth in human visual cortex. Neuroimage 139, 427–438 (2016).
Figures