0890
Laminar profile of hippocampal subregions during spatial navigation1Department of Neuropsychology, Ruhr University Bochum, Bochum, Germany, 2University of Duisburg-Essen, Essen, Germany, 3Radboud University, Nijmegen, Netherlands
Synopsis
Keywords: Task/Intervention Based fMRI, High-Field MRI, Hippocampus, navigation
Motivation: Despite substantial progress in understanding the role of the hippocampus in spatial navigation, the layer-specific microcircuits underlying distinct navigation processes are yet to be determined.
Goal(s): We aimed to investigate the laminar organization of hippocampal subregions during spatial navigation including its relationship to specific strategies.
Approach: Leveraging submillimeter-resolution fMRI at 7T, we quantified BOLD signal changes across hippocampal depths and applied mixed-effect models to probe the relationship between subregional laminar activity and specific strategies reflected by straight paths and deviation towards environmental boundaries.
Results: We show that laminar profiles in hippocampal subregions are differentially associated with navigation strategies.
Impact: Our results demonstrate the promise of laminar fMRI for mapping complex cognitive functions in the hippocampus at mesoscale. Given the vulnerability of this region to Alzheimer’s disease pathology, these findings may have clinical implications for early diagnosis.
Abstract
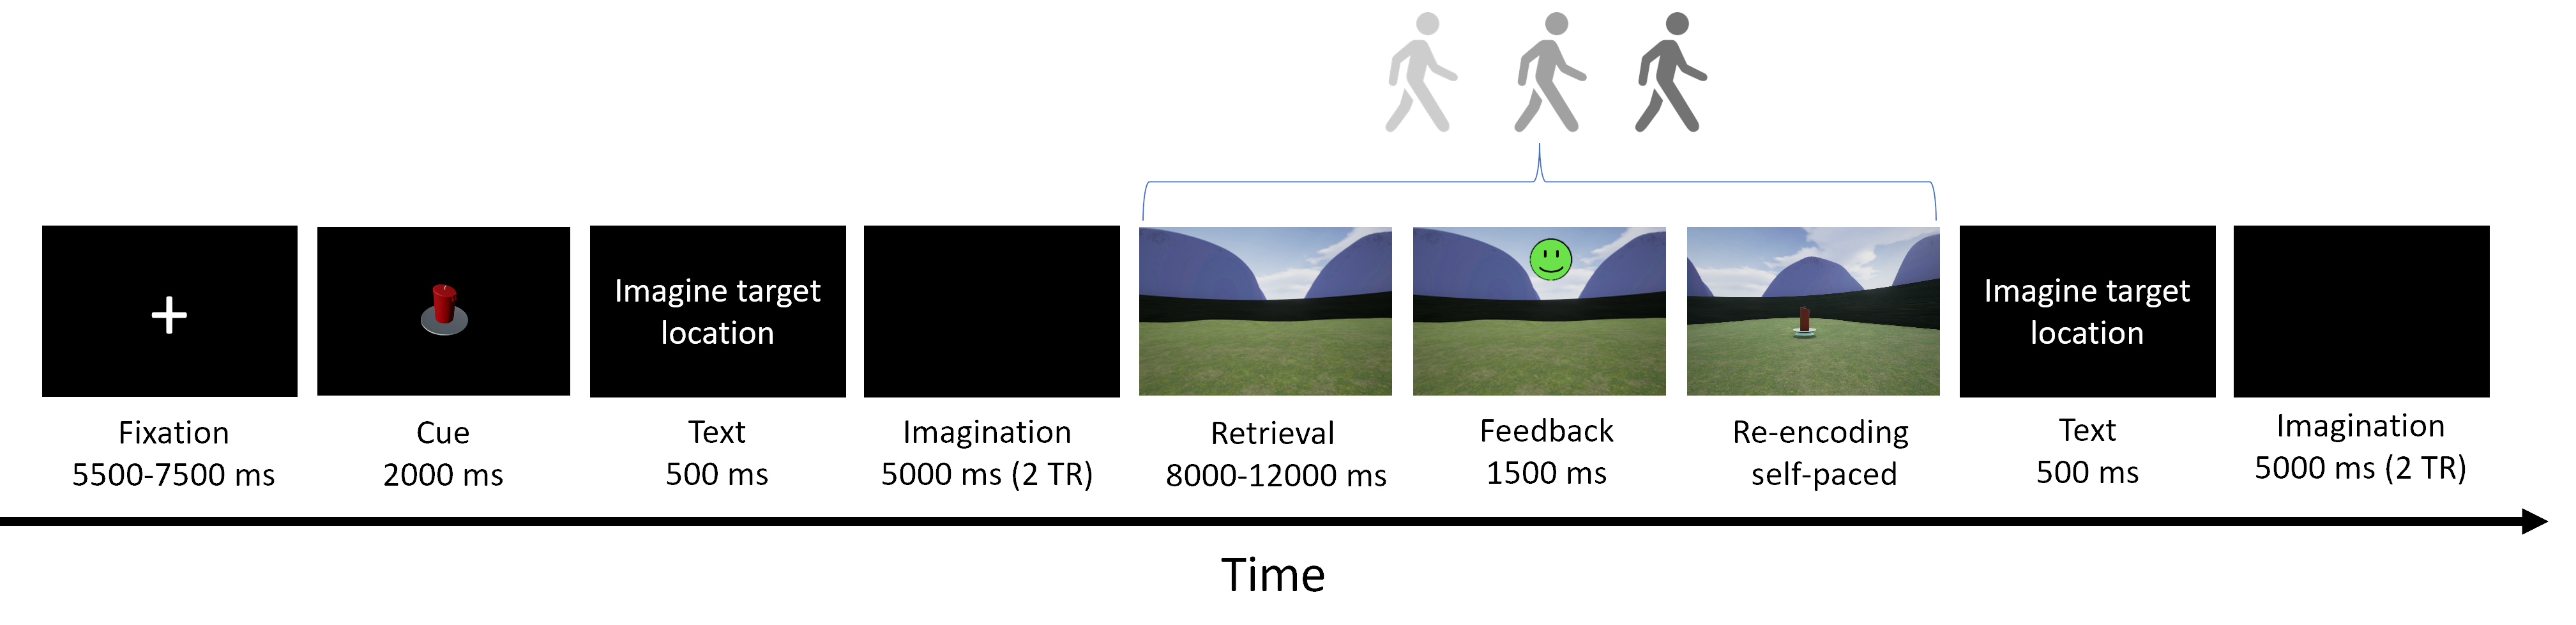
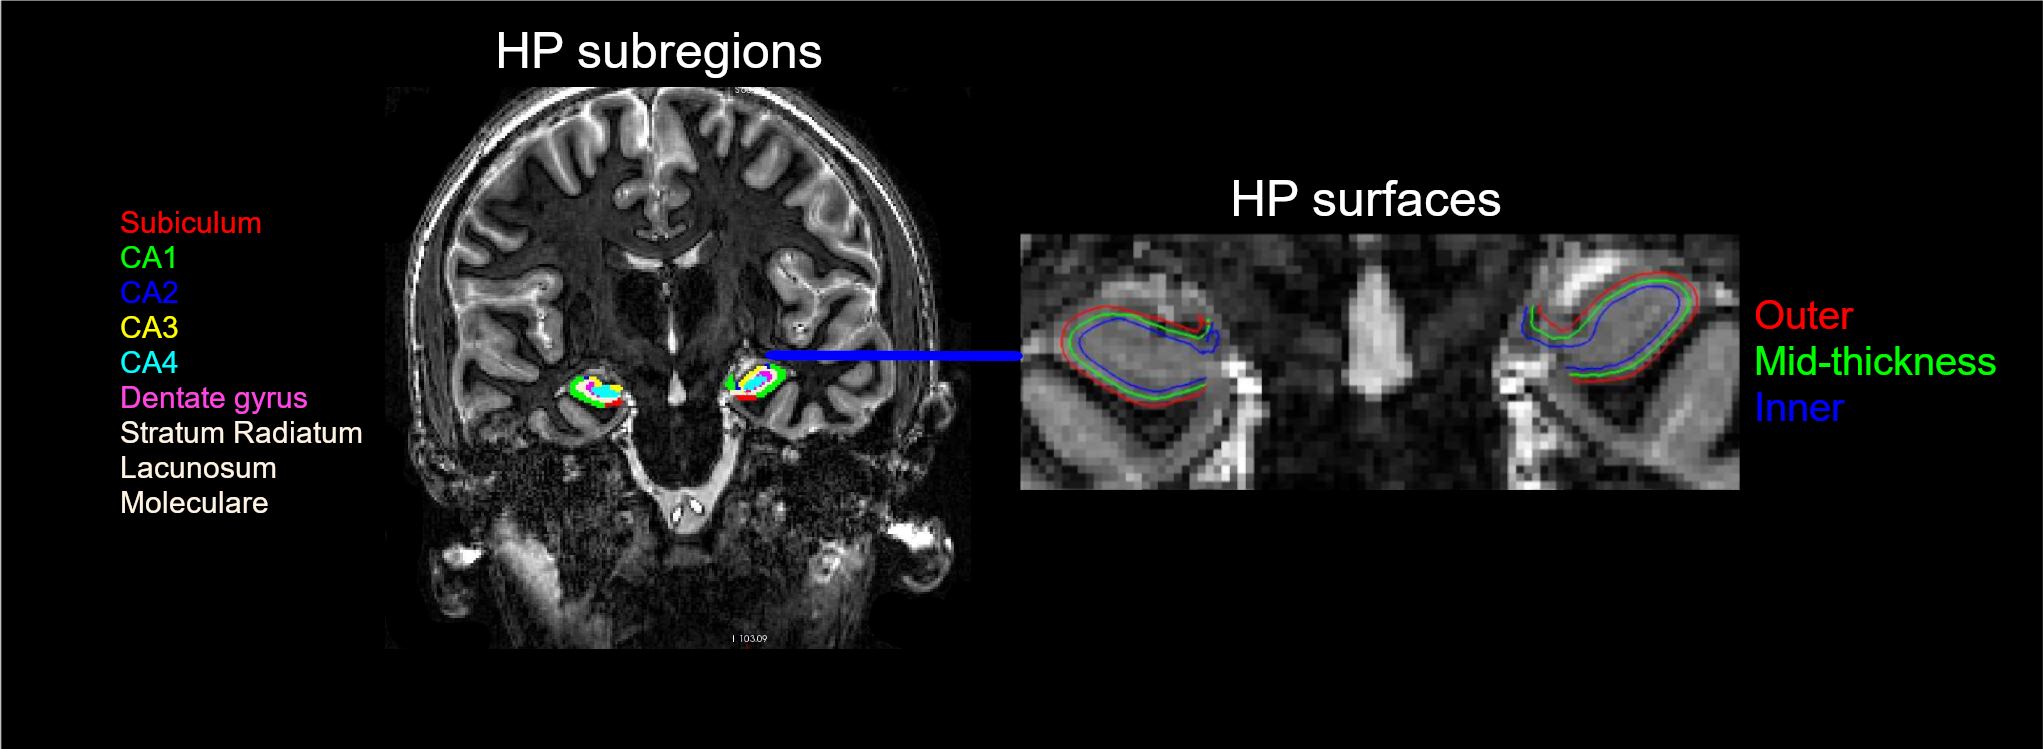
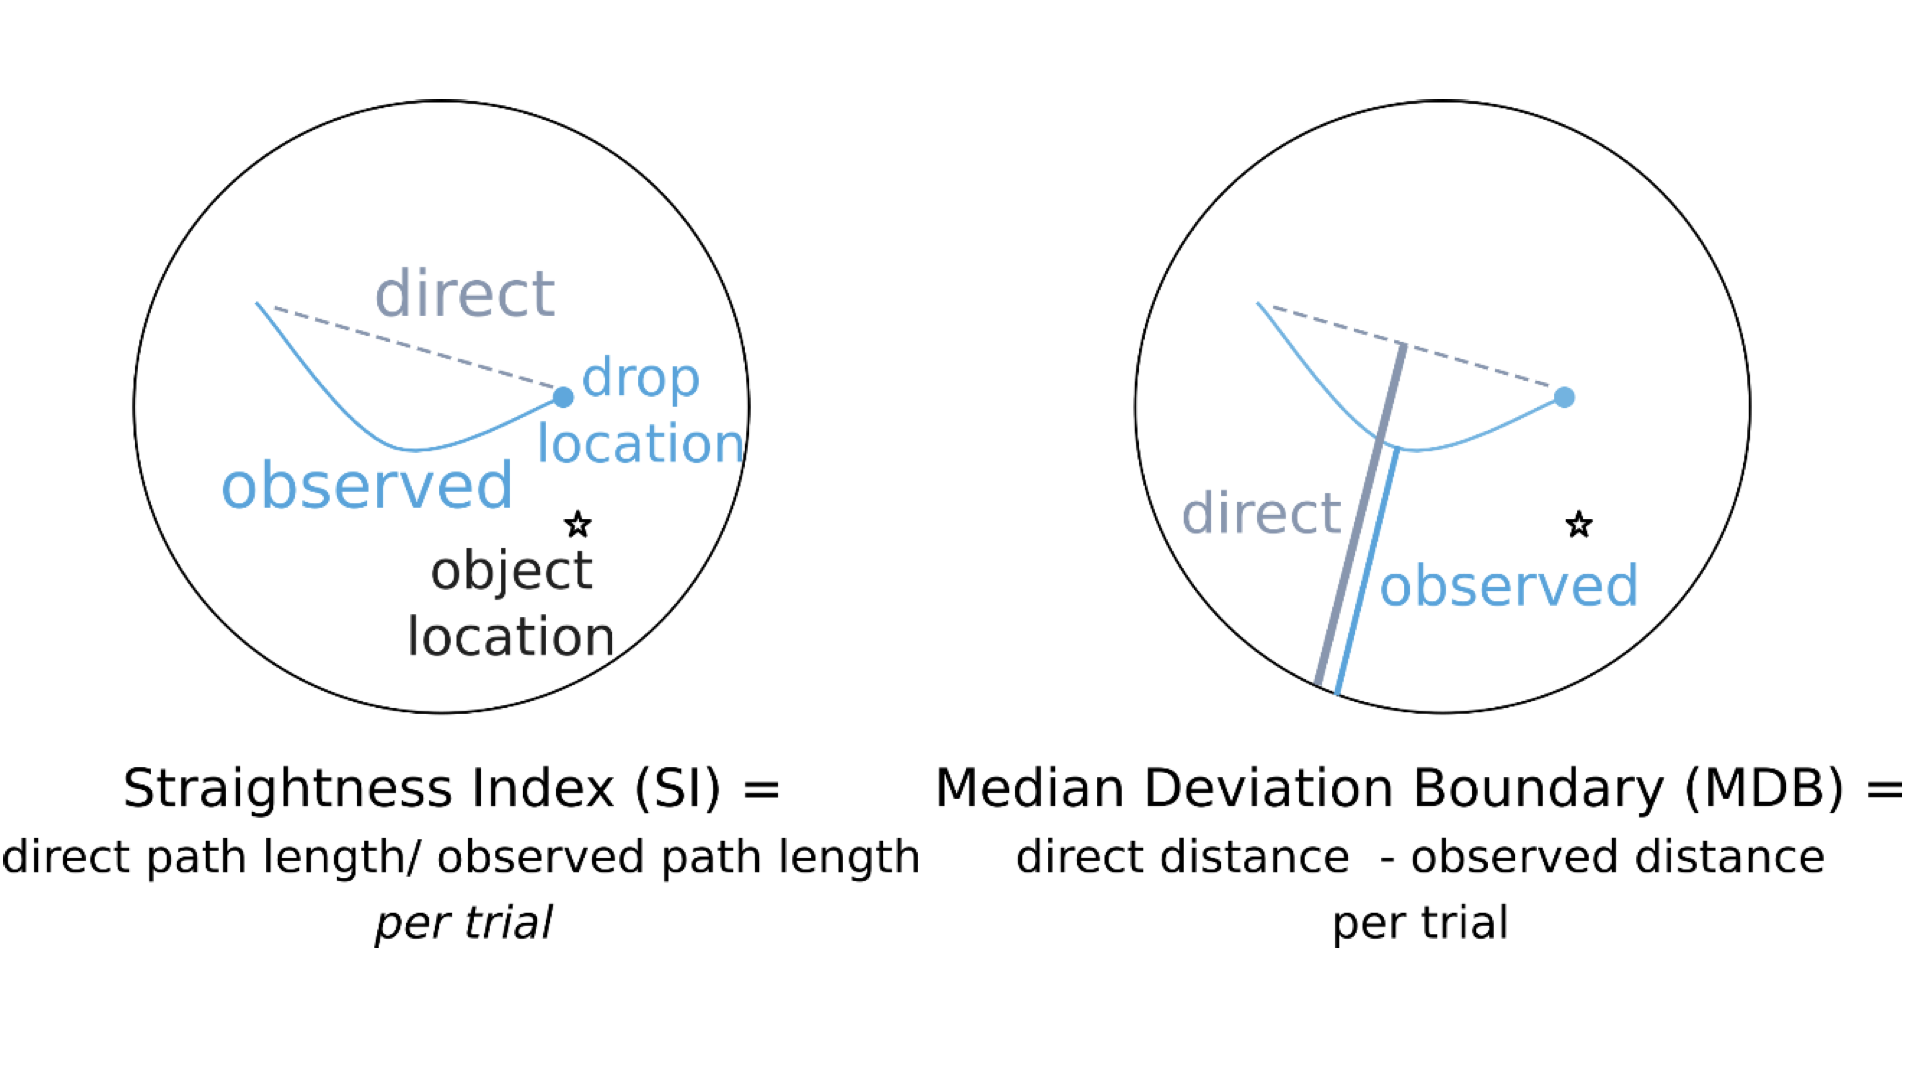
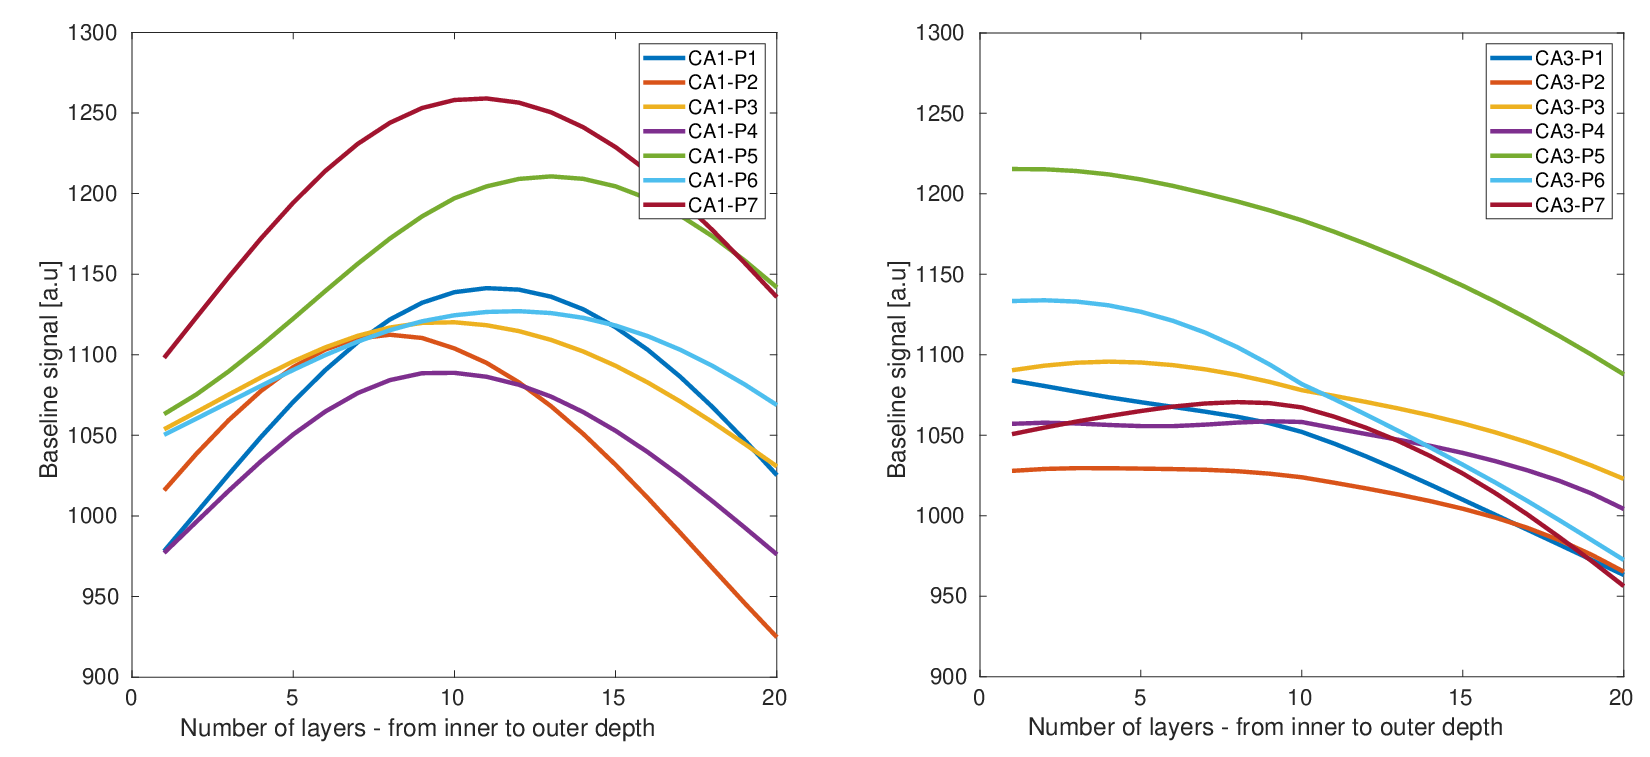
Introduction: The hippocampus (HP) is a key region for important cognitive functions including episodic memory and spatial navigation1. Hitherto, these functions have been extensively studied at macroscale2,3. However, the underlying circuit-level mechanisms are poorly understood. Recent advancements in functional magnetic resonance imaging (fMRI) at submillimeter scale in combination with the availability of new analysis approaches and software packages have enabled reliable measurement of depth-dependent activity in isocortex4,5. Nonetheless, the application of such recordings in allocortex has been limited6 primarily due to methodological challenges. Harnessing the current developments in the field, we aimed to dissociate the contribution of laminar activations in HP subregions to self-selected navigation strategies. Methods: Thirty-nine healthy volunteers (mean age = 25.22 years, 17 females) underwent structural and functional MRI in 2-day sessions using a 7T MAGNETOM-Terra scanner. During the first day, an anatomical image was acquired with 3D-MP2RAGE sequence (isotropic spatial resolution of 0.75 mm3, TR/TE/TI1/TI2 = 6000/1.85/800/2700 ms, flip angles = 4/5°, matrix size = 256 x 340 x 340, bandwidth = 290 Hz/px). This was followed by the acquisition of two functional runs using a 3D GE-EPI sequence with BOLD contrast (isotropic voxel size of 0.8 mm3, phase-encoding direction = A-P, TR/TE = 2500/28.40 ms, matrix size = 240 x 240 x 40, flip angle = 14°, phase partial Fourier = 7/8, bandwidth = 1096 Hz/px, acceleration factor = 4 with GRAPPA reconstruction). On the second day, six additional functional runs were obtained. During each run, the participants were asked to navigate to six hidden objects distributed across random locations in a circular virtual arena7. Movement in the arena was enabled using a button box. Each participant completed 18 trials per run (three repetitions per object) consisting of a retrieval and a subsequent re-encoding phase (see Figure 1). Given that the paradigm was self-paced, the functional data had variable duration, ranging between 240–330 volumes per run (~10-13 minutes). Moreover, an auxiliary functional scan with 13 volumes and opposite phase-encoding direction was acquired prior to acquisition of every fMRI scan to facilitate retrospective correction of susceptibility-induced distortion artefacts. The structural and functional data were preprocessed using an in-house developed pipeline based on ANTS, FSL, SPM and ‘PreSurfer’ packages8. Briefly, the preprocessing steps included bias field correction of the anatomical and functional data, motion and distortion correction of the fMRI data and their subsequent alignment with the anatomical images. Afterwards, HP was segmented into subregions including cornu ammonis (CA 1-4) and dentate gyrus using the Hippunfold package9. Furthermore, three folded surfaces were generated using an equivolume model, representing inner/outer sections and mid-thickness of the HP gray matter8 (Figure 2). These surfaces were then transformed into the space of the corresponding anatomical image and equidistantly sampled into 20 depth bins using an in-house MATLAB script. This allowed the extraction of the BOLD signal profile across the bins per subregion, time-point and hemisphere in the fMRI data, from which the motion estimates were regressed out. The bins were then grouped into the inner and outer depths, corresponding to superficial and deep layers of HP, respectively. While the preprocessing steps and HP segmentation have been completed in all participants, the extraction of laminar profiles in subregions is currently ongoing (N = 7 until now). Additionally, we quantified putative navigation strategies via the following metrics, illustrated in Figure 3: straightness index (SI; the ratio between the optimal path length towards the drop location and the length of the actual taken path), and median deviation to the boundary (MDB; the difference between the median distance of the optimal and the observed paths from the boundary). Subsequently, we performed linear mixed-effect models to assess the association of subregional laminar activity with navigation strategies. Note that for this analysis, the BOLD signal was extracted only from the timepoints when the subjects were navigating in the arena.Results: We observed an inverse U-shaped profile of the BOLD signal across the depths of CA1 whereas the BOLD profile in CA3 demonstrated an almost monotonous decrease from inner to outer depths. This pattern was consistent across participants (Figure 4). Our analyses on preliminary data further suggest a negative association between higher SI and lower activity in inner and outer depths of CA3 (β = -6.6 & -7.7, p < 0.001, respectively).
Conclusions: These preliminary results demonstrate the feasibility of laminar-resolution recordings in human HP and suggest that distinct navigation strategies are related to subregion-specific laminar activities.
Acknowledgements
This project was supported by the European Research Council and Mercator Research Center Ruhr. The MAGNETOM-Terra used in the study was funded by the Deutsche Forschungsgemeinschaft (DFG, German Research Foundation)-Projektnummer 432647511”.
References
- Yushkevich, P. A., Wang, H., Pluta, J., Das, S. R., Craige, C., Avants, B. B., ... & Mueller, S. (2010). Nearly automatic segmentation of hippocampal subfields in in vivo focal T2-weighted MRI. Neuroimage, 53(4), 1208-1224.
- Brown, T. I., Gagnon, S. A., & Wagner, A. D. (2020). Stress disrupts human hippocampal-prefrontal function during prospective spatial navigation and hinders flexible behavior. Current Biology, 30(10), 1821-1833.
- Julian, J. B., & Doeller, C. F. (2021). Remapping and realignment in the human hippocampal formation predict context-dependent spatial behavior. Nature neuroscience, 24(6), 863-872.
- Finn, E. S., Huber, L., Jangraw, D. C., Molfese, P. J., & Bandettini, P. A. (2019). Layer-dependent activity in human prefrontal cortex during working memory. Nature neuroscience, 22(10), 1687-1695.
- Sharoh, D., Van Mourik, T., Bains, L. J., Segaert, K., Weber, K., Hagoort, P., & Norris, D. G. (2019). Laminar specific fMRI reveals directed interactions in distributed networks during language processing. Proceedings of the National Academy of Sciences, 116(42), 21185-21190.
- Maass, A., Schütze, H., Speck, O., Yonelinas, A., Tempelmann, C., Heinze, H. J., ... & Düzel, E. (2014). Laminar activity in the hippocampus and entorhinal cortex related to novelty and episodic encoding. Nature communications, 5(1), 5547.
- Kunz, L., Schröder, T. N., Lee, H., Montag, C., Lachmann, B., Sariyska, R., ... & Axmacher, N. (2015). Reduced grid-cell–like representations in adults at genetic risk for Alzheimer’s disease. Science, 350(6259), 430-433.
- Kashyap, S., Ivanov, D., Havlicek, M., Huber, L., Poser, B. A., & Uludağ, K. (2021). Sub-millimetre resolution laminar fMRI using Arterial Spin Labelling in humans at 7 T. Plos one, 16(4), e0250504.
- DeKraker, J., Haast, R. A., Yousif, M. D., Karat, B., Lau, J. C., Köhler, S., & Khan, A. R. (2022). Automated hippocampal unfolding for morphometry and subfield segmentation with HippUnfold. Elife, 11, e77945.
Figures