0887
300 µm multi-echo bSSFP fMRI at 7 Tesla revealed the IPS-V1 feedback circuit of spatial attention in the human brain1State Key Laboratory of Brain and Cognitive Science, Institute of Biophysics, Chinese Academy of Sciences, Beijing, China, 2University of Chinese Academy of Sciences, Beijing, China, 3Siemens Shenzhen Magnetic Resonance Ltd., Shenzhen, China, Beijing, China
Synopsis
Keywords: Task/Intervention Based fMRI, fMRI (task based)
Motivation: Layer-specific response in frontoparietal areas and their connectivity with the visual cortex are important to understand the neural circuitry of attention.
Goal(s): Investigate the neural circuitry of attention in IPS and V1 with laminar fMRI.
Approach: Using ultra-high resolution multi-echo bSSFP fMRI at 7 Tesla, layer-specific functional activity in IPS and V1 were simultaneously recorded in a spatial attention task.
Results: Attention demanding task induced significant activations in both superficial and deep layers of IPS, enhanced activity in the deep layers of V1, and increased feedback connectivity from the deep layers of IPS to the deep layers of V1.
Impact: This study demonstrates the feasibility of using ultra-high resolution multi-echo bSSFP fMRI at 7 Tesla to simultaneously image multiple brain regions to investigate the neural circuitry of high-level cognition.
Purpose
Selective attention allows our brains to selectively process behaviorally relevant information with limited processing capacity. Previous laminar fMRI studies of attention have been limited to the early visual cortex. Layer-specific responses in the attentional control brain regions in the frontoparietal lobe and their connectivity with the early visual cortex are yet to be explored. In this study, we investigated the attentional modulation of layer-specific responses and connectivity in IPS and V1 with ultra-high resolution multi-echo bSSFP fMRI.Methods
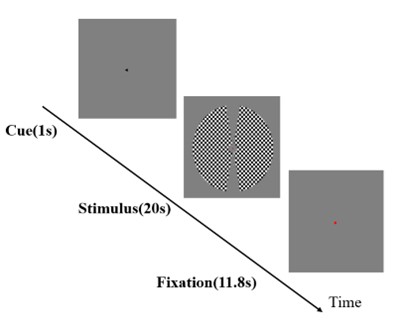
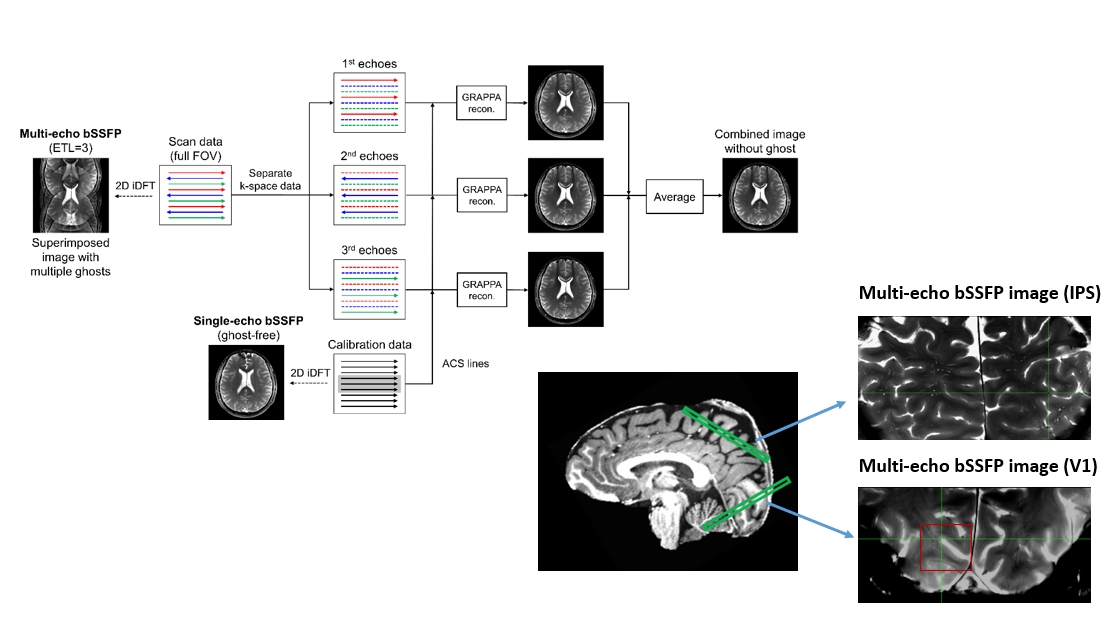
Twelve subjects (5 females) participated in the fMRI experiment. Figure 1 shows the stimulus procedure. An attentional cue was presented before each stimulus block to indicate the task location. Two wedges of checkerboard stimuli (0.5 to 5 degrees of eccentricity, 2 cycles per degree of spatial frequency, counter phase flickering at 6 Hz) were simultaneously presented to the left and to the right side of fixation. The checkerboard stimuli were presented at three contrast levels (6%, 24%, 96%). During the 20 seconds of stimulus presentation, the spatial frequency of the two checkerboard patterns changed 1-3 times randomly and independently. Subjects were asked to pay attention to the cued checkerboard to detect occasional spatial frequency changes. Nine runs of functional data were collected for each subject. The orders of stimulus contrast and attention conditions were counterbalanced within and across runs. MRI data were collected on a 7T scanner (SIEMENS Magnetom) with a 32-channel receive 1-channel transmit head coil (NOVA medical). Subjects used a bite bar to restrict head motion. Functional images were acquired using a multi-echo bSSFP fMRI sequence (Liang et al.) (FOV=116×116 mm, Matrix size = 387× 387, 0.3 mm in-plane resolution, slice thickness = 3 mm, 2 slices, single slice acquisition time = 2022.69 ms, TR = 7.3 ms, TE = 3.65 ms, echo train length = 3, nominal flip angle = 30°, Bandwidth = 310 Hz/Px, Phase encoding direction from right to left,). Ghost-free magnitude images were reconstructed using a GRAPPA-based method (Figure 2). Two bSSFP slices were placed perpendicular to IPS of the parietal lobe and the calcarine sulcus in V1 (Figure 2). T1 weighted anatomical volumes were acquired using a MP2RAGE sequence (FOV = 224×224 mm, 256 sagittal slices, 0.7 mm isotropic voxels, TE = 3.05 ms, TR = 4000 ms, TI1 = 750 ms, flip angle = 5 deg, TI2=2500 ms, flip angle = 4 deg, bandwidth=240 Hz/pix, phase partial Fourier = 7/8, slice partial Fourier = 7/8, GRAPPA factor = 3). MRI data were analyzed using AFNI/SUMA, FreeSurfer, LAYNII and custom code in Python and Matlab. Gray matter ROIs in V1 and IPS was subdivided into 20 equal-volume depth. The 96% contrast condition was used as an independent localizer to define ROIs in V1 and IPS.Results
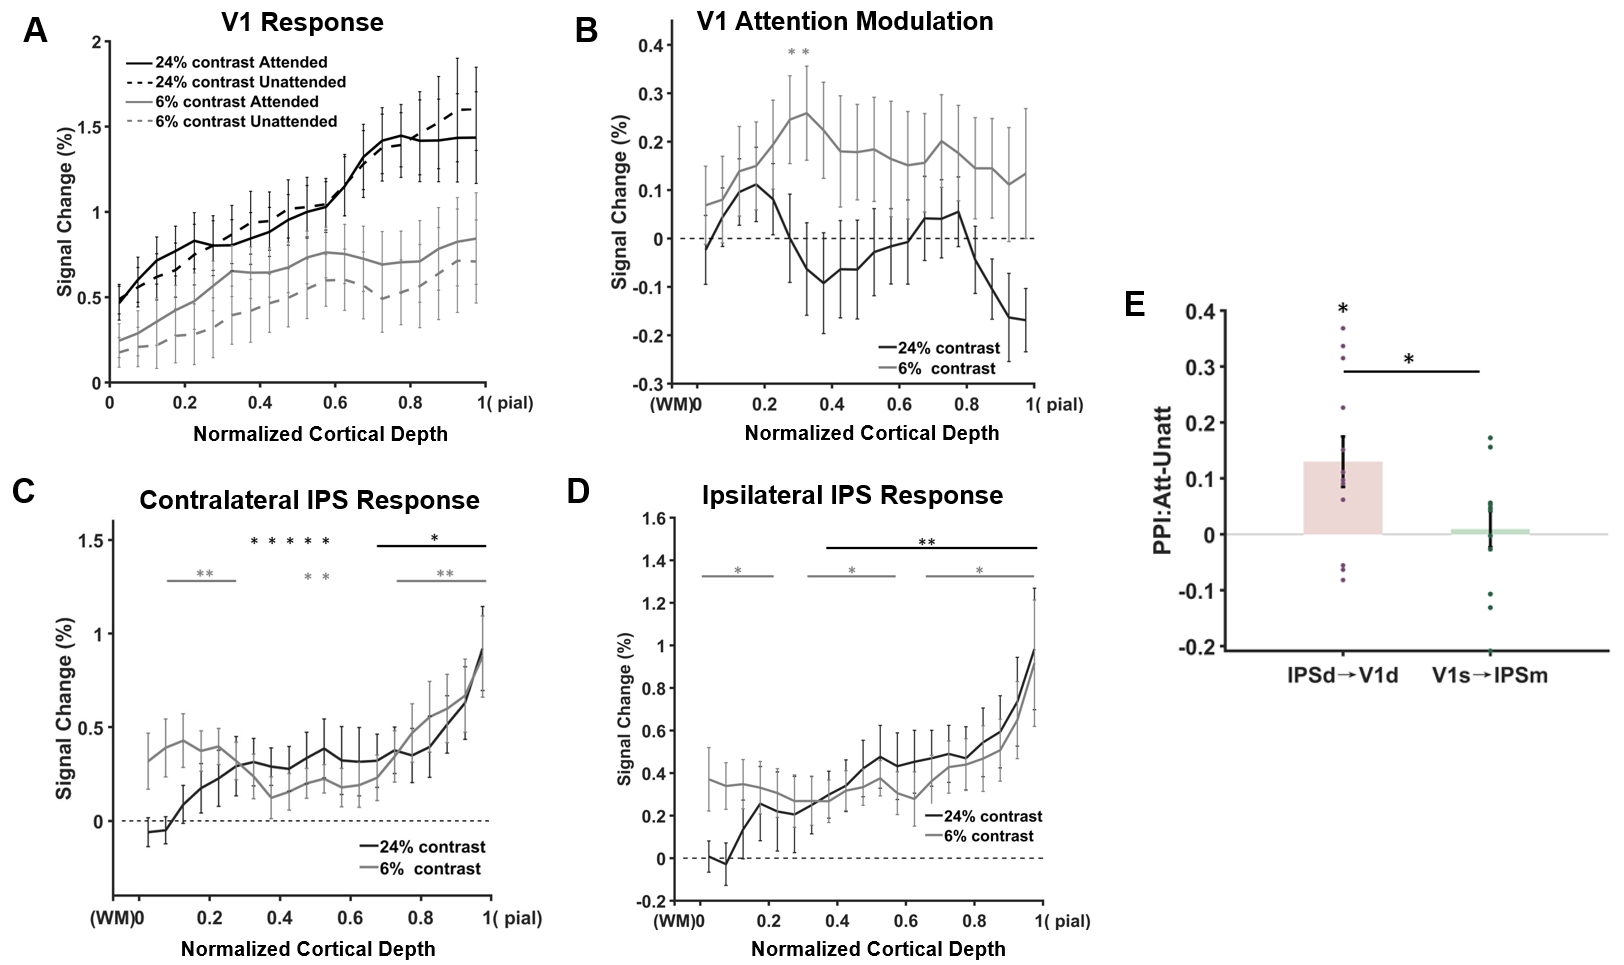
Figure 3A and B shows the layer-specific response profiles and attentional modulations in V1. In the 6% contrast condition, significant attentional modulation of stimulus response can be found in the deep layers. In the 24% contrast condition, although a double-peak attentional modulation can also be found, the effect was much weaker compared to the 6% contrast condition. This could be due to higher task difficulty in the 6% (50.17 (mean) ±28.39(std) % accuracy) compared to the 24% (76.28±13.29% accuracy) contrast condition. In both contralateral and ipsilateral IPS to the attended visual field (Figure 3(C,D), significant clusters of activations can be found in both superficial and deep layers in the 6% contrast condition. Psychophysiological Interaction (PPI) further revealed significantly stronger effective connectivity from the deep layers of IPS (IPSd) to the deep layers of V1 (V1d) in attended compared to the unattended condition (p = 0.015, Figure 3E).)The PPI effect of attention was not significant for the feedforward connection from the superficial layers of V1 (V1s) to the middle layers of IPS contralateral to the attended stimulus (IPSm) (p = 0.787). The PPI effect was also significantly stronger in feedback (IPSd-V1d) compared to feedforward (V1s-IPSm) connections (p = 0.041).Conclusions
Both attention control and visual brain areas were simultaneously imaged using ultra-high resolution multi-echo bSSFP fMRI at 7 Tesla. Under high task difficulty, top-down attention significantly enhanced stimulus responses in the deep layers of V1, and produced significant activations in both deep and superficial layers of IPS. Layer-specific effective connectivity analysis further revealed significantly stronger IPSD-V1D feedback connectivity in attended compared to unattended condition. These findings demonstrate the feasibility of imaging mesoscale neural circuitry in multiple brain regions using ultra-high resolution multi-echo bSSFP fMRI at 7 Tesla.Acknowledgements
No acknowledgement found.References
- Liu C, Guo F, Qian C, et al. Layer-dependent multiplicative effects of spatial attention on contrast responses in human early visual cortex[J]. Progress in Neurobiology, 2021, 207: 101897.
- Liang H, Pan Z, Qian C, et al. Multi‐echo balanced SSFP with a sequential phase‐encoding order for functional MR imaging at 7T[J]. Magnetic Resonance in Medicine, 2022, 88(3): 1303-1313.
- Huber, L. R., Poser, B. A., Bandettini, P. A., Arora, K., Wagstyl, K., Cho, S., ... & Gulban, O. F. (2021). LAYNII: a software suite for layer-fMRI. NeuroImage, 237, 118091.
- Wang L, Mruczek R E B, Arcaro M J, et al. Probabilistic maps of visual topography in human cortex[J]. Cerebral cortex, 2015, 25(10): 3911-3931.
Figures