0878
Single Generalized Convolutional Neural Network for Automatic Liver Extraction and R2* Estimation for Iron Overload Assessment1University of Memphis, Memphis, TN, United States, 2St. Jude Children’s Research Hospital, Memphis, TN, United States, 3Cincinnati Children’s Hospital Medical Center, Cincinnati, OH, United States
Synopsis
Keywords: Analysis/Processing, Quantitative Imaging, Deep Learning, Generalized CNN, R2*, HIC
Motivation: Although R2*-MRI is extensively validated to assess hepatic iron content(HIC), different MRI sequences are used, hence multiple sequence-specific convolutional neural networks(CNNs) have been proposed for automated liver segmentation and HIC estimation.
Goal(s): Assess feasibility of generalized CNN with limited training datasets to automate liver segmentation across various MRI sequences used to quantify HIC in clinical practice.
Approach: Data of twenty-nine patients scanned using multi-echo 2D/3D breath-hold and free-breathing Cartesian and radial GRE sequences were used to train U-Net CNN using incremental learning.
Results: Excellent agreement was obtained between manual and single generalized U-Net for liver segmentation and R2* estimation across multiple MRI sequences.
Impact: Generalized CNN using incremental learning minimizes the need for extensive training datasets to segment liver across multiple MRI sequences. With additional fine-tuning and validation, this approach can be widely applicable for sequence-independent liver segmentation and assessment of hepatic iron content.
Introduction
Non-invasive assessment of hepatic iron content (HIC) typically involves using biopsy-calibrated two-dimensional breath-hold Cartesian gradient echo (2D BH cGRE) R2*-MRI.1,2 Some MRI vendors offer corresponding three-dimensional (3D) GRE techniques (GE: IDEAL-IQ, Philips: mDixon, Siemens: LiverLab) with inline post-processing, enabling comprehensive liver coverage and generating R2* maps in a single breath-hold.3 However, breath-holding is impractical for pediatric or respiratory-compromised patients, and 3Dfree-breathing radial GRE (3D FB rGRE) has emerged as a viable alternative.4Convolutional neural network (CNN) has automated the traditional approach of manually drawing a partial or whole liver region-of-interest (ROI) to estimate mean liver R2*.5,6 However, a drawback of CNN is that it requires large number of manually labeled data or ground truths (GTs) which is a substantial barrier for developing CNN-based medical imaging applications.7 The study aims to automate the segmentation of whole liver parenchyma on different BH and FB MRI sequences using a single generalized convolutional neural network (CNN) employing few GTs for improving the workflow and accuracy of R2*-based HIC reporting for clinical diagnosis and treatment of iron overload.
Materials and Methods
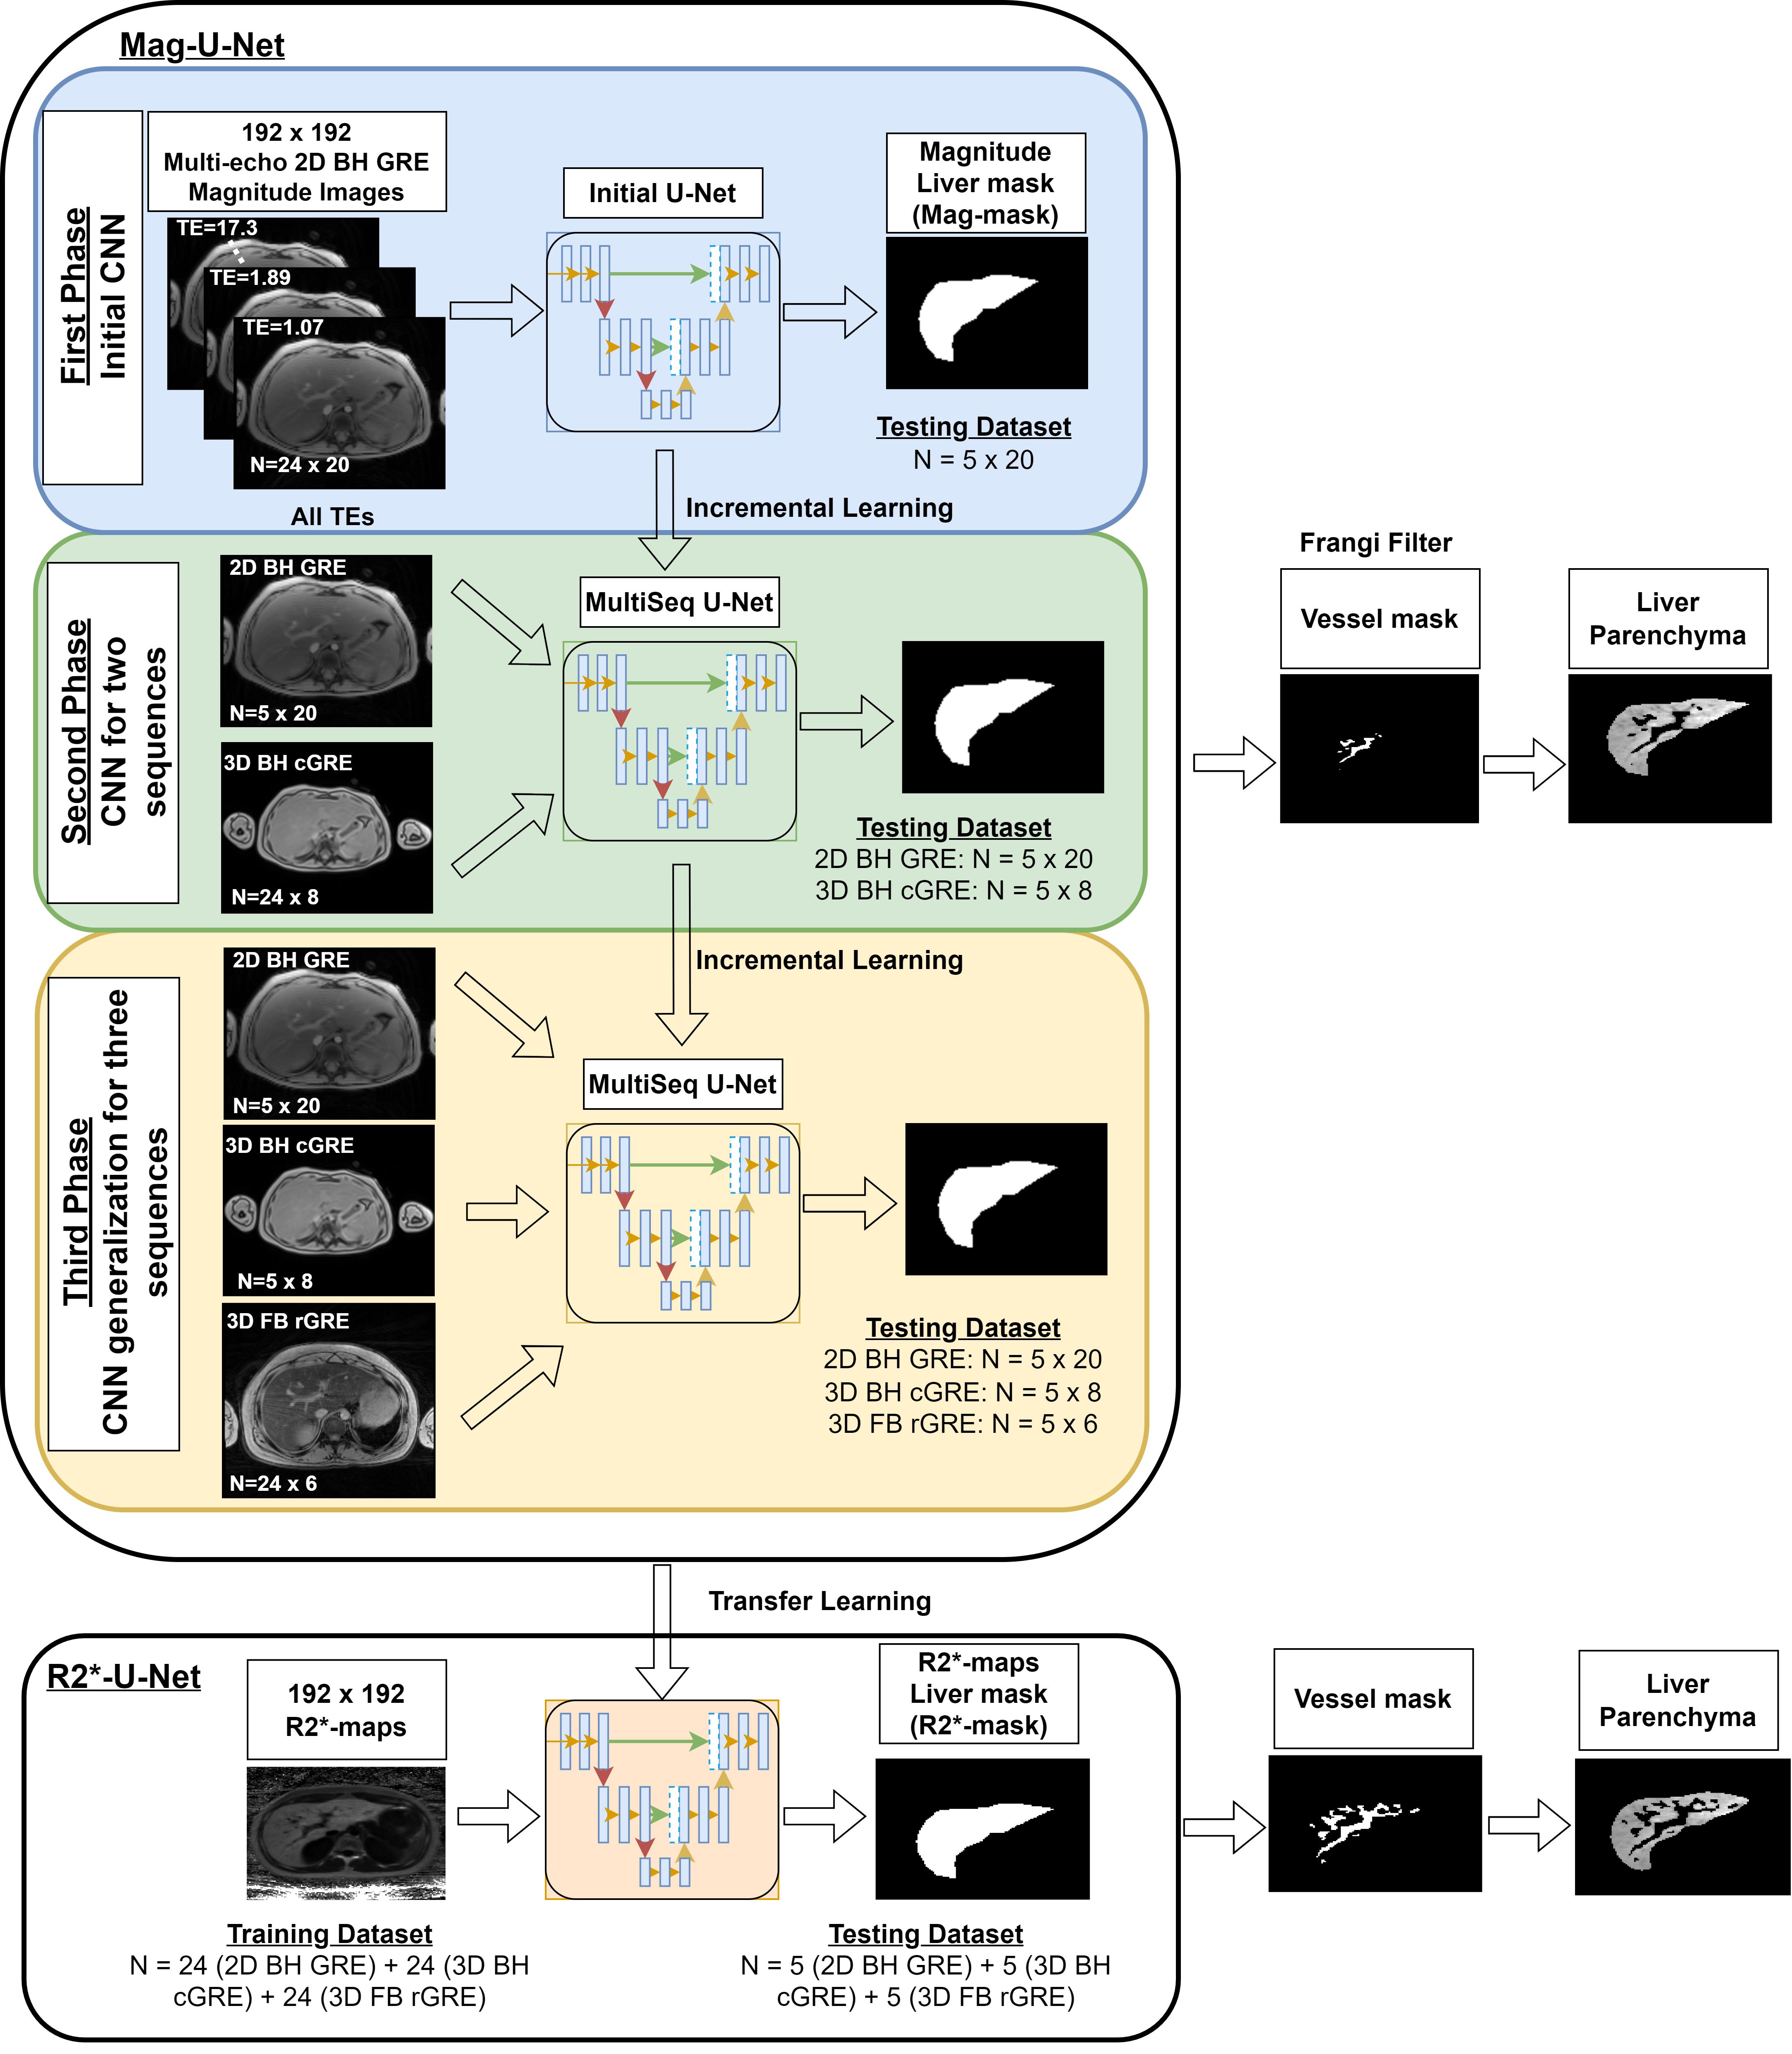
Twenty-nine multi-echo 2D BH cGRE, 3D BH cGRE and 3D FB rGRE datasets were collected retrospectively from patients with suspected iron overload.8 The liver was manually segmented by drawing a whole liver ROI which acts as GT. R2* maps were calculated using a monoexponential model with noise subtraction.9,10 Single generalized 2D U-Net11 CNN was trained for liver segmentation on magnitude images (mag-U-Net) across the three MRI sequences using incremental learning.12 For each sequence, 24 patients were used for training and five patients were used for testing. During incremental learning, from one phase to the next, five patients for each of the previously trained sequence(s) from training dataset were included in the next phase (Figure 1). The generalized Mag-U-Net was used for transfer learning to segment liver parenchyma from R2* maps (R2*-U-Net). All the three sequences were combined to form a single dataset (24 patients from each sequence in training dataset and 5 patients from each sequence in testing dataset) for R2*-U-Net as it would have initial knowledge of liver segmentation from Mag-U-Net. Frangi filter was used to remove vessels13, and mean R2* was calculated and was converted to HIC using published R2*-HIC calibration.1 One-way ANOVA was used to compare the accuracy of the extracted liver areas and the mean R2* values between the two U-Nets and the GT, with p<0.05 as statistically significant.Results & Discussion
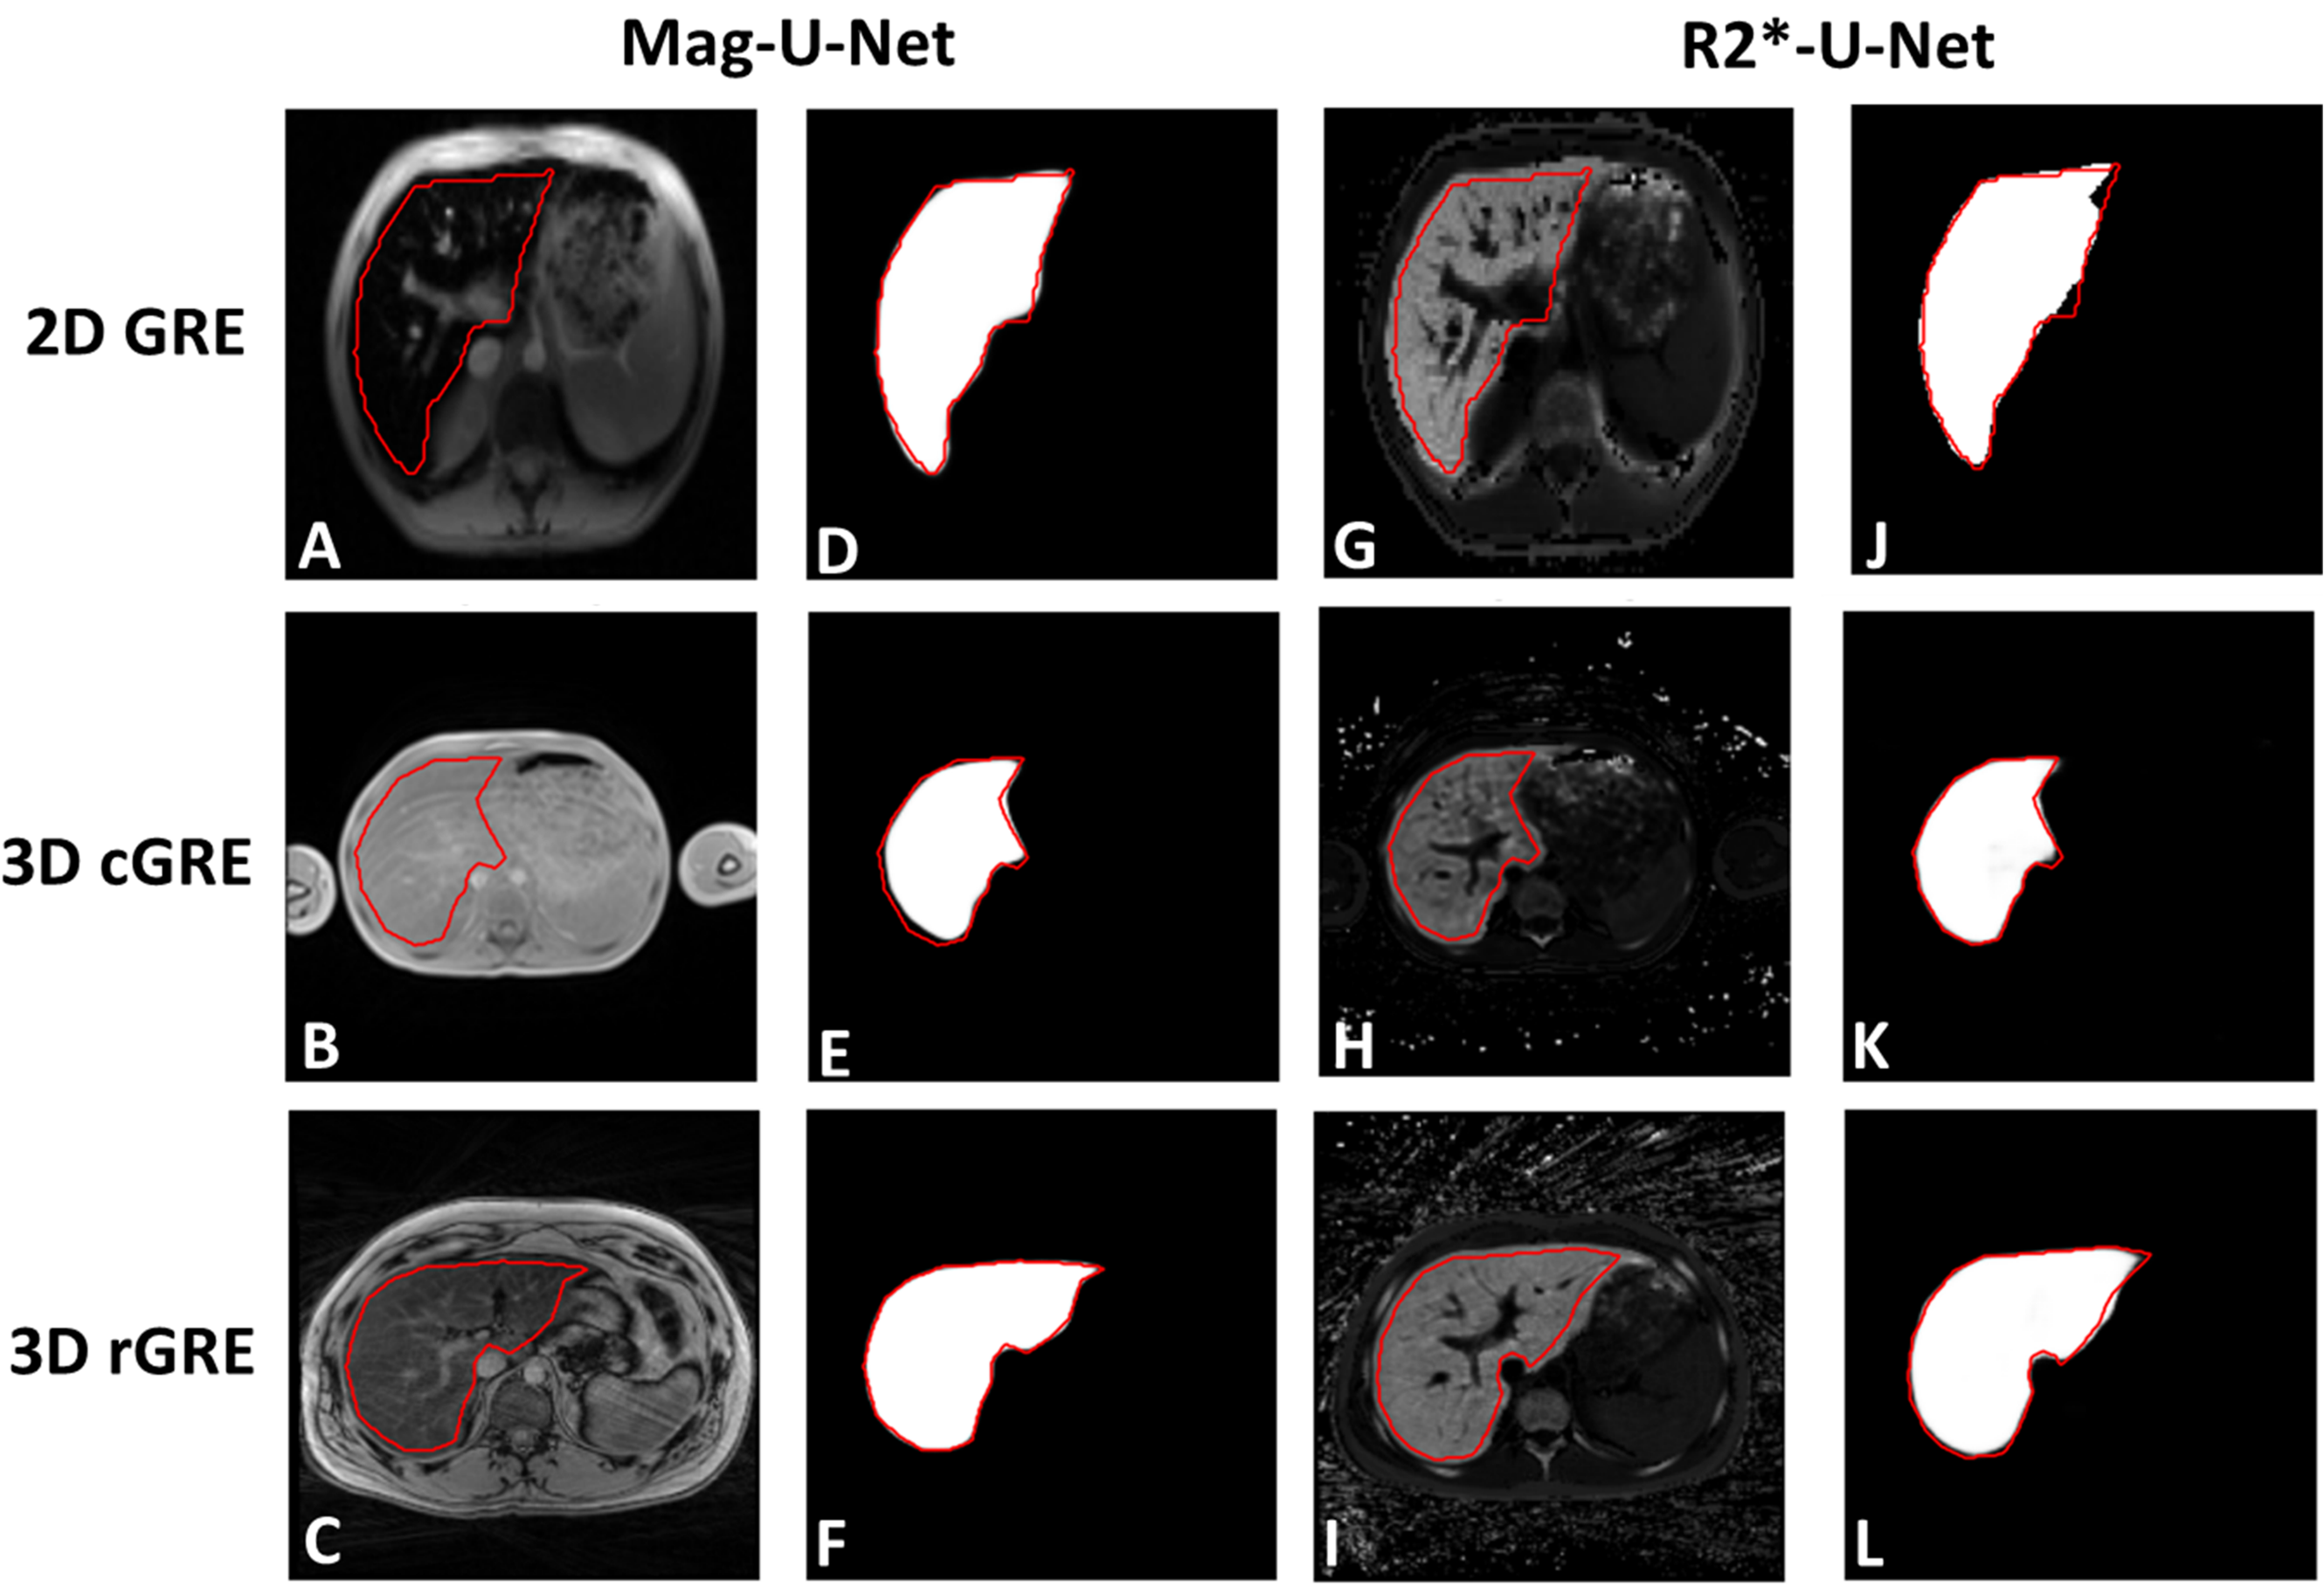
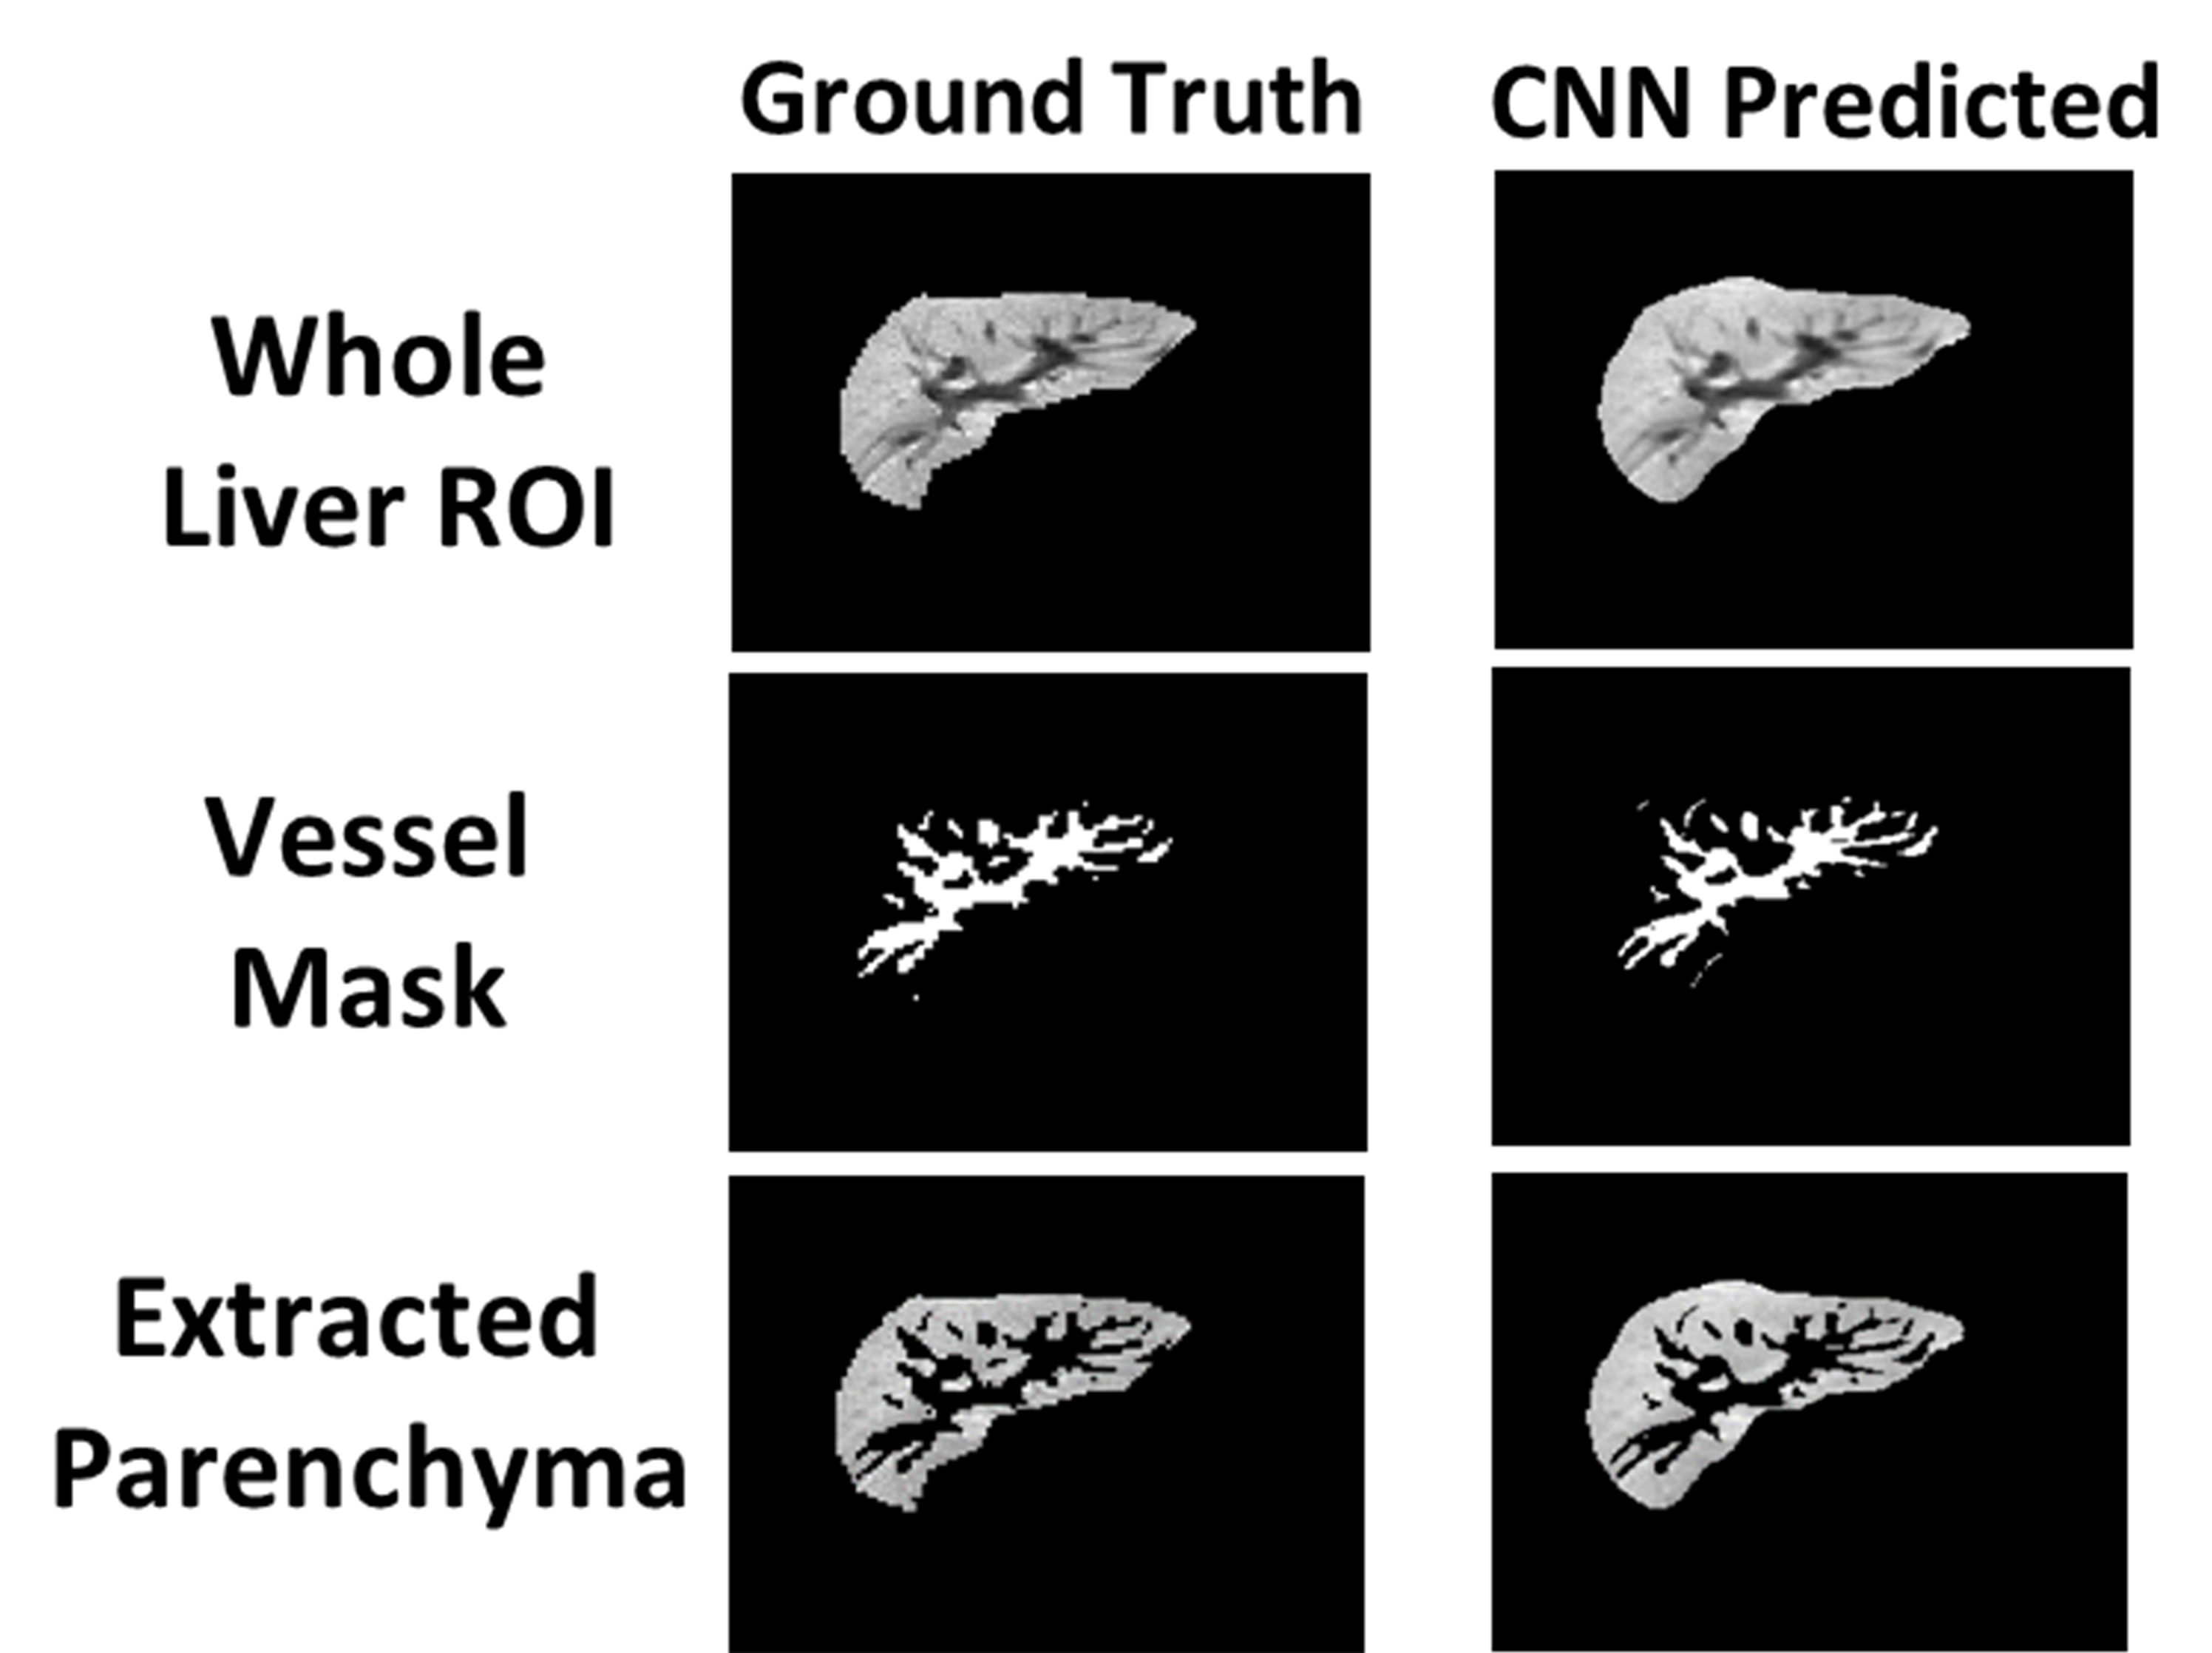
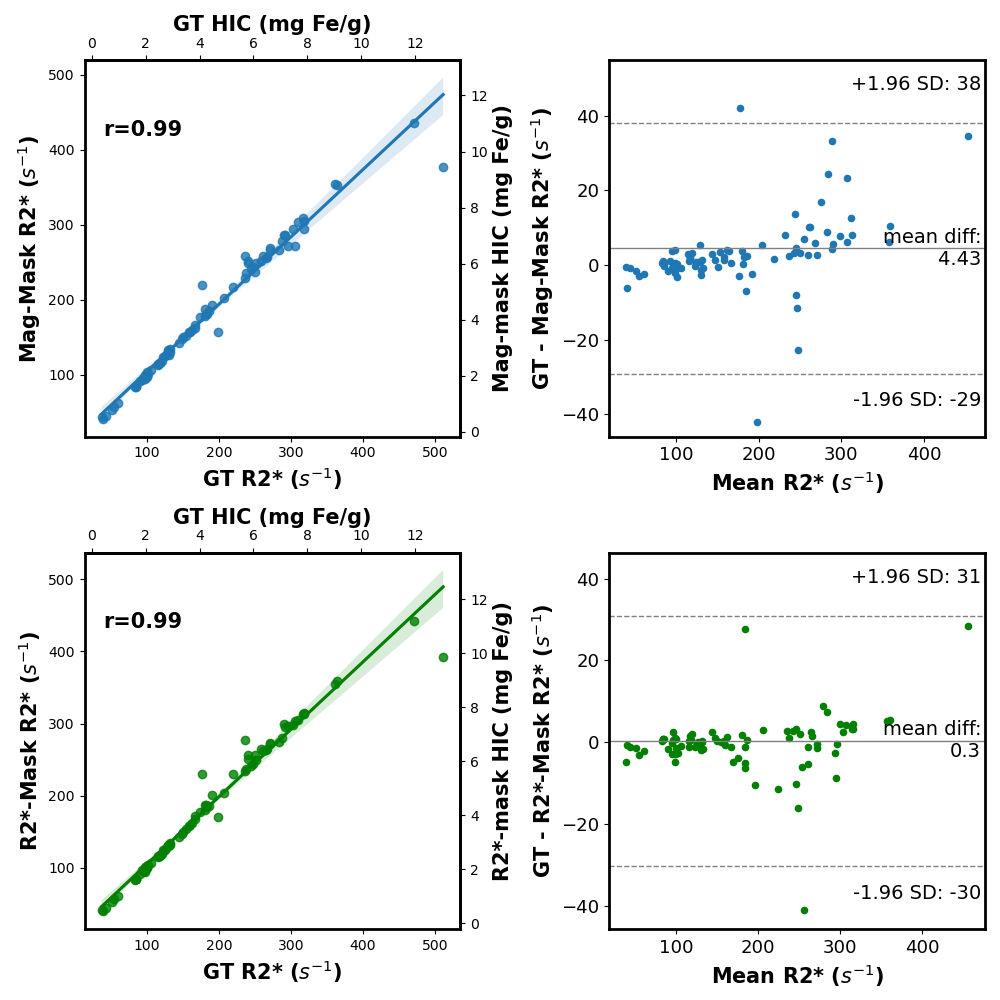
Representative images showing the differences in 2D BH GRE, 3D BH cGRE and 3D FB rGRE acquisition along with their corresponding GT and extracted parenchyma from Mag-U-Net and R2*-U-Net are shown in Figure 2. Visual inspection of the extracted parenchyma and R2* maps with their corresponding GT showed excellent agreement. The mean validation dice-score for Mag-U-Net and R2*-U-Net were 0.95±0.05 and 0.88±0.05, respectively. For the entire cohort, the extracted liver area and the mean estimated R2* values using both U-Nets were not significantly different from the GT results for both before (p-value: liver area=0.724 and R2*=0.937) and after (p-value: liver area=0.891 and R2*=0.932) vessel segmentation (Table 1). Figure 3 shows a representative case demonstrating the extraction of liver parenchyma with removal of blood vessels using Frangi filter. The extracted liver areas and mean R2*/HIC values for both the U-Nets demonstrated excellent correlation (r=0.99) to GT values with a mean bias close to zero (Figure 4).Different CNN techniques have been reported for segmenting liver parenchyma using 2D/3D cGRE acquisitions for automated R2* estimation, however, none of them were evaluated yet for FB rGRE.5,6,14 Moreover, our study shows the feasibility of a single generalized U-Net with limited training dataset for quantifying HIC across three commonly used BH and FB GRE sequences using both magnitude images and R2* maps. Compared to a previous generalized CNN-based study, our study demonstrates the potential to achieve accurate results with even fewer GTs and incorporates R2* maps for segmentation.11 Some limitations are this study was performed on single slice collected from a single center and a single scanner. Future work includes training and testing the approach on segmenting the entire 3D liver volume and datasets collected from multi-center and multi-vendor.
Conclusion
Our results show an excellent agreement between manual and a single generalized U-Net employing three sequences with limited GTs for liver segmentation using both magnitude images at different TEs and only R2* maps, hence demonstrating not only the accuracy and robustness of generalized CNN for automated parenchyma extraction and estimation of whole liver R2* but also the feasibility of CNN-based medical applications.Acknowledgements
Research reported in this publication was supported by the National Institute of Biomedical Imaging and Bioengineering of the National Institutes of Health under Award Number R21EB031298.References
1. Hankins JS, McCarville MB, Loeffler RB, et al. R2* magnetic resonance imaging of the liver in patients with iron overload. Blood, The Journal of the American Society of Hematology. 2009;113(20):4853-4855.
2. Wood JC, Enriquez C, Ghugre N, et al. MRI R2 and R2* mapping accurately estimates hepatic iron concentration in transfusion-dependent thalassemia and sickle cell disease patients. Blood. 2005;106(4):1460-1465.
3. Yokoo T, Serai SD, Pirasteh A, et al. Linearity, bias, and precision of hepatic proton density fat fraction measurements by using MR imaging: a meta-analysis. Radiology. 2018;286(2):486-498.
4. Tipirneni-Sajja A, Krafft AJ, McCarville MB, et al. Radial ultrashort TE imaging removes the need for breath-holding in hepatic iron overload quantification by R2* MRI. AJR American journal of roentgenology. 2017;209(1):187.
5. Chlebus G, Meine H, Thoduka S, et al. Reducing inter-observer variability and interaction time of MR liver volumetry by combining automatic CNN-based liver segmentation and manual corrections. PloS one. 2019;14(5):e0217228.
6. Hille G, Agrawal S, Tummala P, et al. Joint liver and hepatic lesion segmentation in MRI using a hybrid CNN with transformer layers. Computer Methods and Programs in Biomedicine. 2023:107647.
7. LeCun Y, Bengio Y, Hinton G. Deep learning. nature. 2015;521(7553):436-444.
8. Rohani SC, Morin CE, Zhong X, et al. Hepatic Iron Quantification Using a Free‐Breathing 3D Radial Gradient Echo Technique and Validation With a 2D Biopsy‐Calibrated R2* Relaxometry Method. Journal of Magnetic Resonance Imaging. 2022;55(5):1407-1416.
9. Krafft AJ, Loeffler RB, Song R, et al. Quantitative ultrashort echo time imaging for assessment of massive iron overload at 1.5 and 3 Tesla. Magnetic resonance in medicine. 2017;78(5):1839-1851.
10. Tipirneni‐Sajja A, Loeffler RB, Krafft AJ, et al. Ultrashort echo time imaging for quantification of hepatic iron overload: Comparison of acquisition and fitting methods via simulations, phantoms, and in vivo data. Journal of Magnetic Resonance Imaging. 2019;49(5):1475-1488.
11. Wang K, Mamidipalli A, Retson T, et al. Automated CT and MRI liver segmentation and biometry using a generalized convolutional neural network. Radiology: Artificial Intelligence. 2019;1(2):180022.
12. Gepperth A, Hammer B. Incremental learning algorithms and applications. Paper presented at: European symposium on artificial neural networks (ESANN)2016.
13. Tipirneni‐Sajja A, Song R, McCarville MB, Loeffler RB, Hankins JS, Hillenbrand CM. Automated vessel exclusion technique for quantitative assessment of hepatic iron overload by‐MRI. Journal of Magnetic Resonance Imaging. 2018;47(6):1542-1551.
14. Liu M, Vanguri R, Mutasa S, et al. Channel width optimized neural networks for liver and vessel segmentation in liver iron quantification. Computers in Biology and Medicine. 2020;122:103798.
Figures