0874
Deep learning enabled MRI general denoising at 0.55T1Radiology and Biomedical Imaging, University of California, San Francisco, CA, United States, 2National Institutes of Health, Bethesda, MD, United States, 3National Heart Lung and Blood Institute, Bethesda, MD, United States
Synopsis
Keywords: AI/ML Image Reconstruction, Visualization, Mid-Field MRI, Denoising
Motivation: Recent advancements in 0.55T MRI systems present promising opportunities for affordable and accessible MRI. Enhancing SNR to mitigate the inherent limitations of mid field strength is a crucial step in advancing this technology.
Goal(s): In this study, we aim to advance 0.55T MRI for speed and quality through a deep-learning-driven general denoise method processing low-SNR scans of various body parts and sequences.
Approach: We constructed a model with a spatial-temporal attention mechanism and employed massive complex image data for training.
Results: The proposed method significantly improves low SNR single-repetition images at 0.55T, making the results comparable or superior to the averages of multi-repetitions.
Impact: With robust denoising on mid-field systems, enhanced image quality and quicker scans can be expected for more accurate diagnoses and improved patient experience. New sequences can be developed and paired to further advance the system.
Introduction
Over the past decades, MRI has generally been performed at high magnetic field strength, namely 1.5T and 3T. Increased field strength leads to higher SNR, enabling higher achievable spatial resolution. However, high-field MRI scanners are costly and unevenly distributed. More economical and accessible mid-field MR scanners, such as 0.55T, have recently become available but suffer from SNR limitations, often requiring longer scan times (e.g., multi-duplications) to recover the SNR that has been lost by going to lower field 1,2.In this study, we aim to advance 0.55T mid-field MRI for speed and quality with deep learning. We propose an MRI general denoising model based on diverse data to denoise low SNR scans for various organs and sequences. We compare denoised results on single-repetition images with multi-repetition averaged images acquired at 0.55T to assess our model’s capability of accelerating scans and improving image quality.
Methods
Data acquisitionHigh-SNR MRI images for training were acquired using a 3T scanner (Siemens Vida). 4888 individual scans from diverse body parts and pulse sequences were collected after data cleaning and reconstruction 3,4 to generate 8150 training data entries, each comprising 30 slices, alongside their synthetic noisy variant as clean-noisy pairs and geometry maps. All images were in complex data format, preserving phase information for more features over magnitude-only images. Another 147 scans with multiple signal averages (to achieve clinical diagnostic quality) at a 0.55T scanner (Siemens Free.Max) were selected to test the model performance.
Network architecture
We developed a spatial-temporal(slice) attention mechanism for the denoising network incorporating three types of attention units: local spatial attention for neighboring pixel correlations, global spatial attention for broader field-of-view, and temporal(slice) attention for slice-to-slice relationships. Our model adapted an HRNet (High-resolution Network) 5,6 as a backbone to maintain high-resolution representations. Charbonnier loss 7-9 and perceptual loss 10,11 were used in training to mitigate over-smoothness and promote visually desirable images. Additionally, a pre-normalization method based on signal power was designed to handle the massive diversity in scale and distribution within training and testing data (Fig.1).
Data Analysis
Denoising performance at 0.55T was evaluated with 147 scans containing multiple repetitions from multiple different body parts and pulse sequences (Fig.2). We applied structural similarity index (SSIM) and peak signal-to-noise ratio (PSNR) to quantitatively compare our DL-denoised results from single repetition, block-matching and 3D filtering (BM3D) 12 denoised ones, and the averaged images from 2-7 times of repetition. Image quality was qualitatively assessed by two radiologists who independently reviewed randomly ordered images acquired through different approaches from a subset comprising 50 scans. The inter-user variability is evaluated by the intraclass correlation coefficient (ICC).
Results
Our DL method achieved 0.874(±0.017) in mean SSIM and 35.73(±0.84) in mean PSNR (Fig.3) over all test cases, significantly outperforming the BM3D with a mean SSIM of 0.854(±0.020) and PSNR of 35.05(±0.91) using the paired t-test (p<0.05). The results of qualitative analysis (Fig.4) demonstrated the DL-denoising significantly improved image quality over single repetitions and yielded visually comparable or superior images with less smoothness, detail preservation, and noise reduction compared to the averaged multi-repetitions. Our DL denoising model also showed good consistency in quality improvement when single repetition quality varied.To evaluate the acceleration capabilities of DL-denoising, we collected all 10 samples containing 6 or 7 duplications from the test set. In all cases, we used the averages of 6 single-repetitions as non-accelerated multi-repetition references. The averages of 1 to 5 single-repetitions were used for denoising, representing acceleration rates of 6, 3, 1.5, and 1.25 in real-world scans. As depicted in Fig.5, our DL model exhibited consistent denoising performance across low to high acceleration rates and excelled in detail restoration, particularly at high acceleration rate scenarios.
Discussion
Comparing the two denoising methods with averaging of multi-repetitions, we observed that our denoising method consistently delivers high-quality results with the least variation regarding changes in image quality. It's worth noting that when the acceleration rate is low, the performance of the three methods could be close. In this case, the SSIM value of the noisy (single or lower repetition) images could get close to 1 and surpass the value of the better denoising results because they tend to be more visually similar to multi-repetition references, which are not true noise-free ground truth.Conclusion
We introduced a general MRI denoising model trained on diverse data, showing the potential to enhance quality and speed on mid-field systems. Though being a deep learning model, the inference may not achieve 100% accuracy, future advancements in larger, more specialized MRI models could maximize the benefits for mid-field MRI systems.Acknowledgements
No acknowledgement found.References
1. Webb, Andrew and Johnes Obungoloch. “Five steps to make MRI scanners more affordable to the world.” Nature 615 (2023): 391-393.
2. Shetty, Anup S et al. “Low-Field-Strength Body MRI: Challenges and Opportunities at 0.55 T.” Radiographics: a review publication of the Radiological Society of North America, Inc vol. 43,12 (2023): e230073. doi:10.1148/rg.230073
3. Hansen, Michael Schacht, and Thomas Sangild Sørensen. “Gadgetron: an open source framework for medical image reconstruction.” Magnetic resonance in medicine vol. 69,6 (2013): 1768-76. doi:10.1002/mrm.24389
4. Xue, Hui et al. “Distributed MRI reconstruction using Gadgetron-based cloud computing.” Magnetic resonance in medicine vol. 73,3 (2015): 1015-25. doi:10.1002/mrm.25213
5. Wang, Jingdong et al. “Deep High-Resolution Representation Learning for Visual Recognition.” IEEE Transactions on Pattern Analysis and Machine Intelligence 43 (2019): 3349-3364.
6. Sun, Ke et al. “Deep High-Resolution Representation Learning for Human Pose Estimation.” 2019 IEEE/CVF Conference on Computer Vision and Pattern Recognition (CVPR) (2019): 5686-5696.
7. Charbonnier, Pierre et al. “Two deterministic half-quadratic regularization algorithms for computed imaging.” Proceedings of 1st International Conference on Image Processing 2 (1994): 168-172 vol.2.
8. Zamir, Syed Waqas et al. “Learning Enriched Features for Fast Image Restoration and Enhancement.” IEEE Transactions on Pattern Analysis and Machine Intelligence 45 (2022): 1934-1948.
9. Wang, Zhendong et al. “Uformer: A General U-Shaped Transformer for Image Restoration.” 2022 IEEE/CVF Conference on Computer Vision and Pattern Recognition (CVPR) (2021): 17662-17672.
10. Johnson, Justin, et al. “Perceptual Losses for Real-Time Style Transfer and Super-Resolution”. Computer Vision -- ECCV 2016, edited by Bastian Leibe et al., Springer International Publishing, 2016, pp. 694–711.
11. Yang, Qingsong et al. “Low-Dose CT Image Denoising Using a Generative Adversarial Network With Wasserstein Distance and Perceptual Loss.” IEEE Transactions on Medical Imaging 37 (2017): 1348-1357.
12. Dabov, Kostadin et al. “Image Denoising by Sparse 3-D Transform-Domain Collaborative Filtering.” IEEE Transactions on Image Processing 16 (2007): 2080-2095.Figures
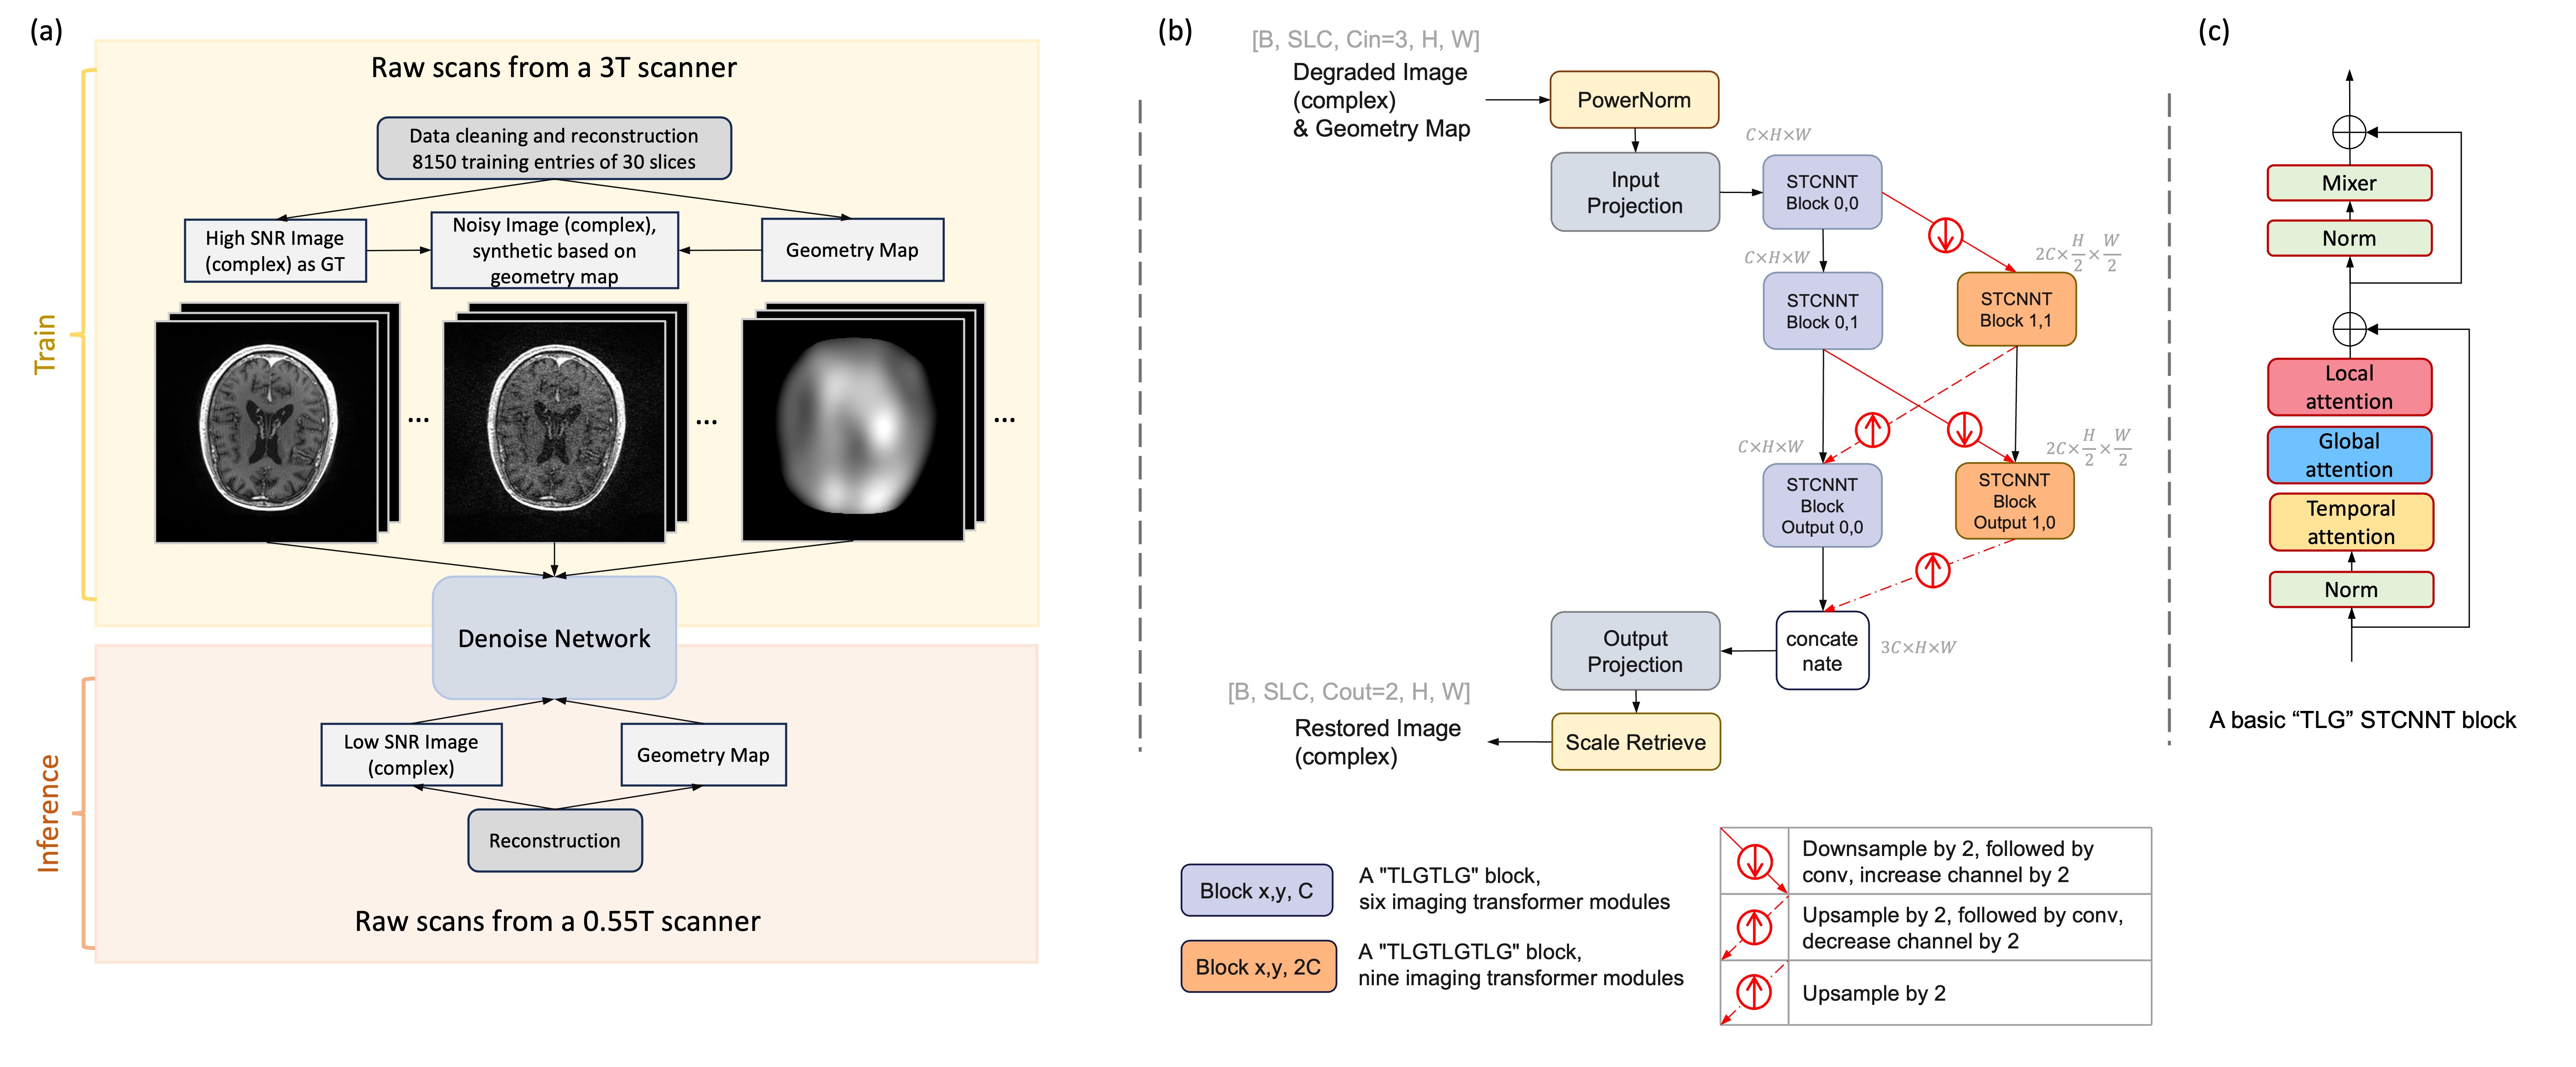
Fig.1 (a) Training and inference pipeline. (b) Denoise network overview: the network takes multi-slices complex images (real and imaginary parts) and their corresponding geometry maps as three-channel inputs. It outputs multi-slices complex images in two channels. (c) Illustration of a basic spatial-temporal CNN transformer (STCNNT) block which includes one temporal, one global, and one local attention unit.
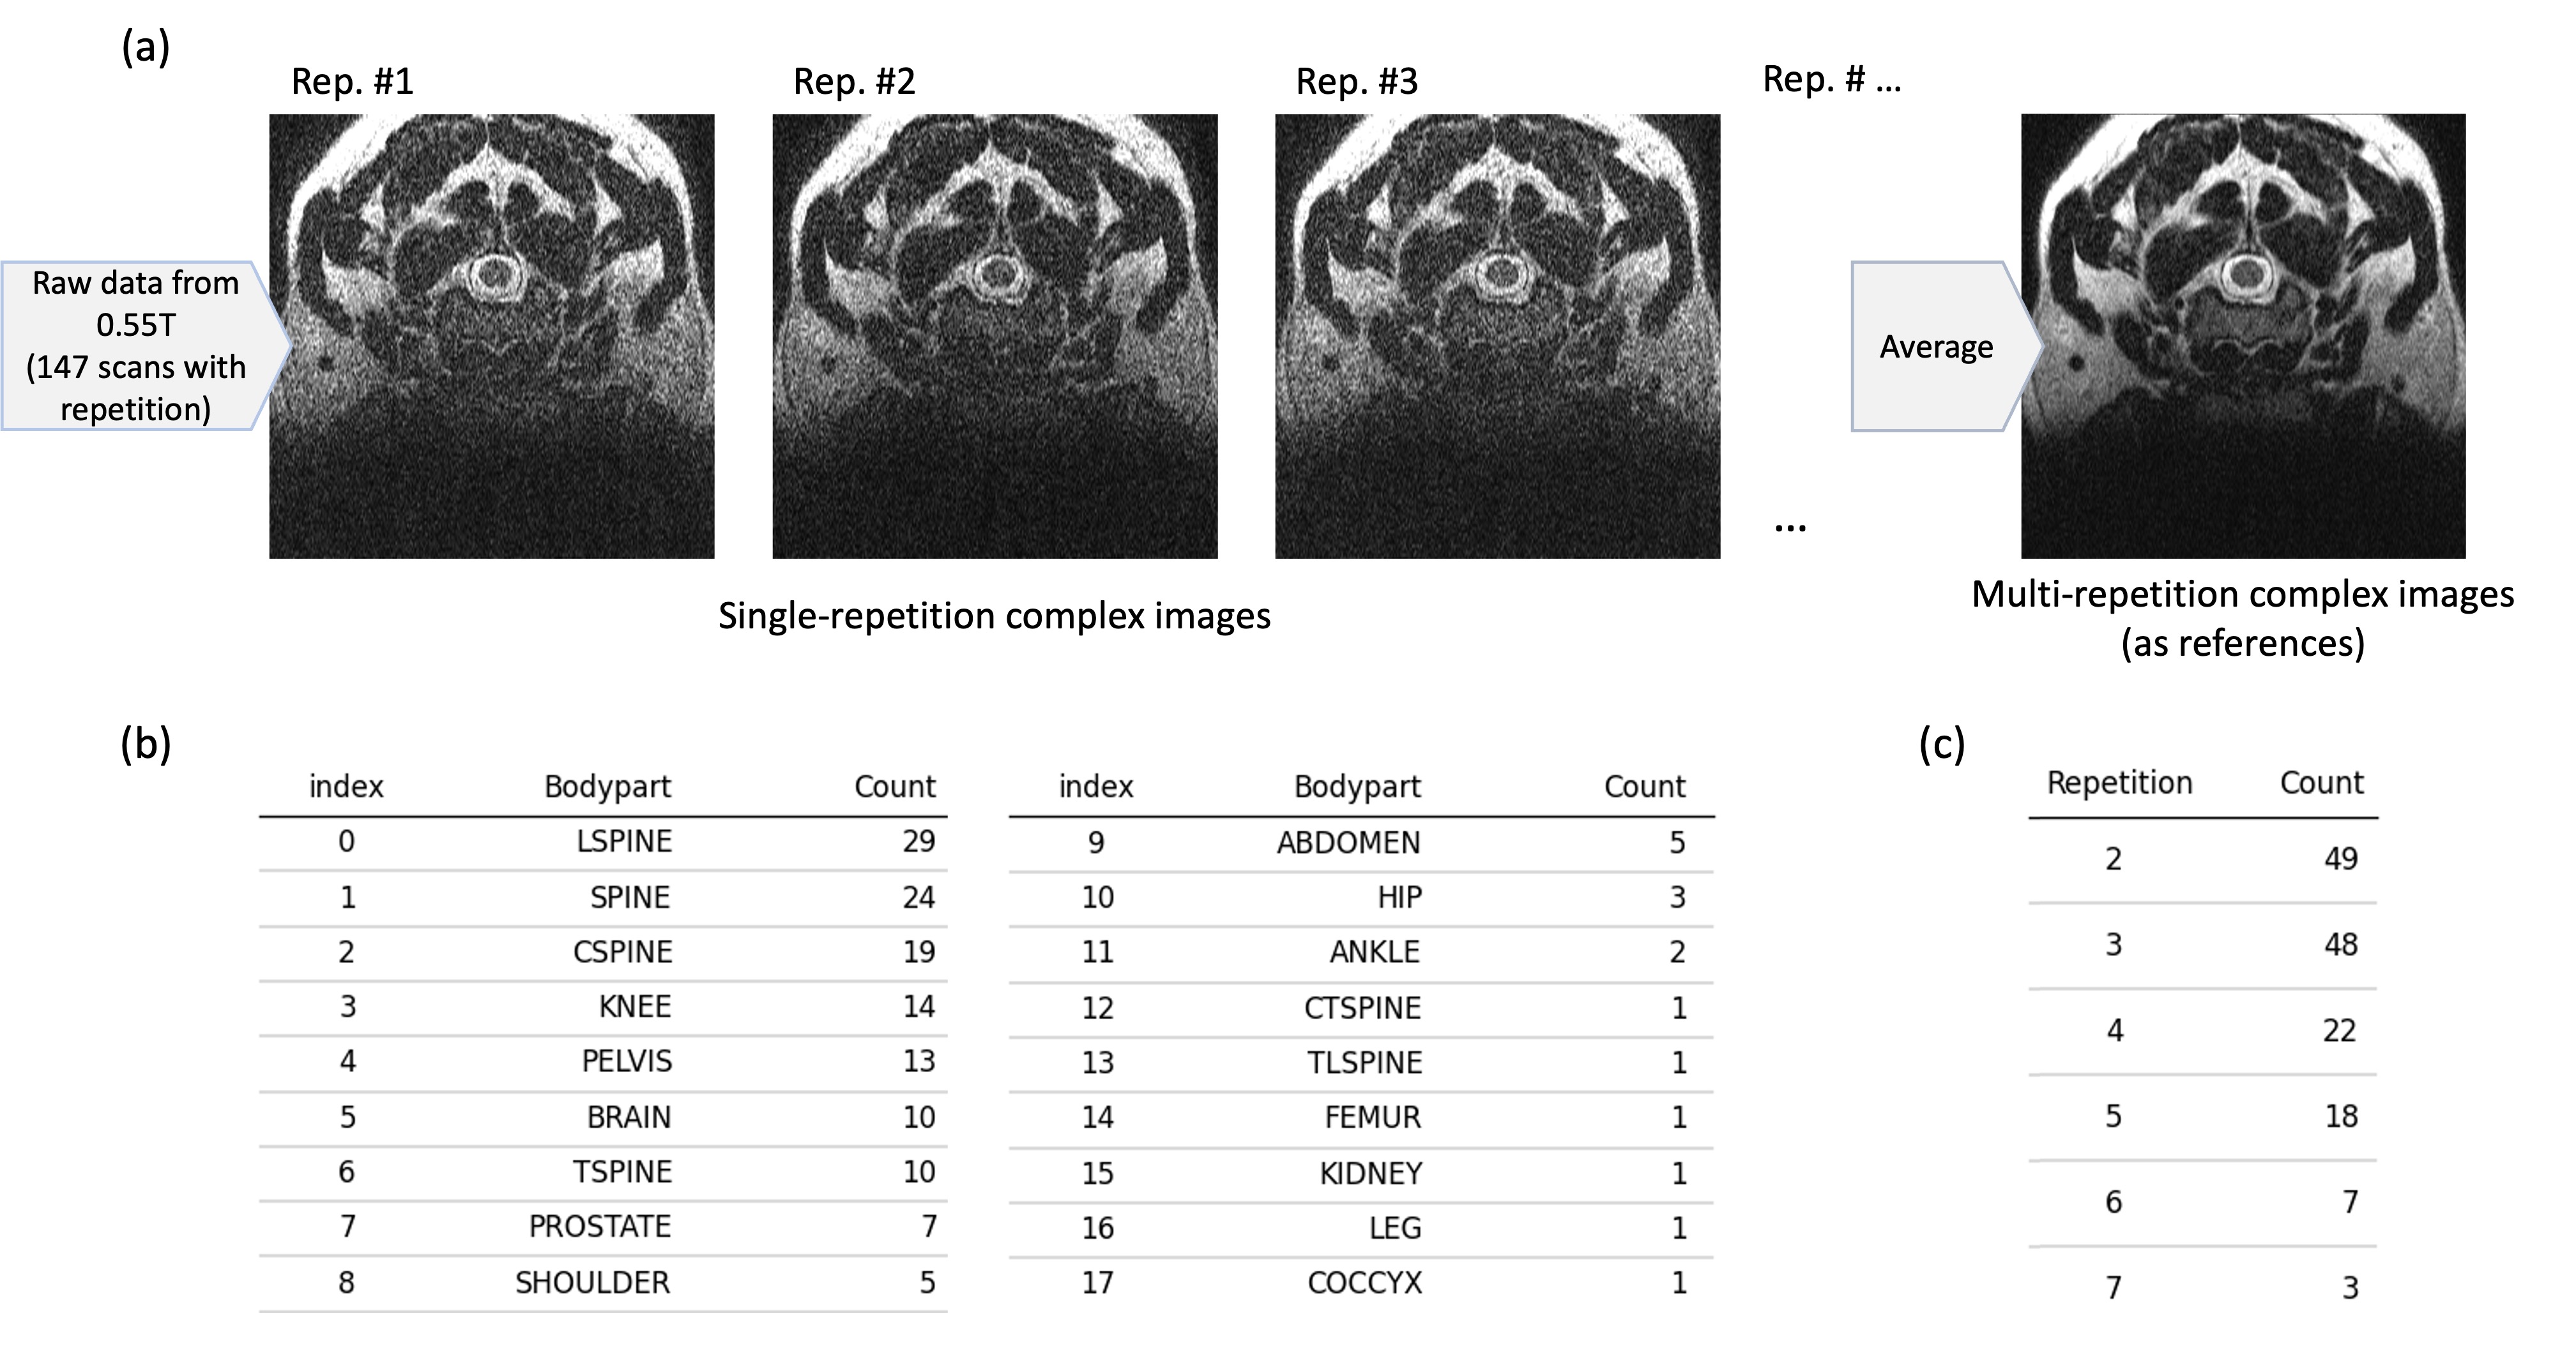
Fig.2 (a) 147 scans containing repetitions were collected from the 0.55T scanner. Complex single repetitions were reconstructed and separated from raw data for testing. The complex multi-repetition images were generated by averaging the single repetitions and served as high SNR references. This test set covered various body parts and repetition times. (b) lists the distribution of body parts, and (c) provides a breakdown of the repetitions.
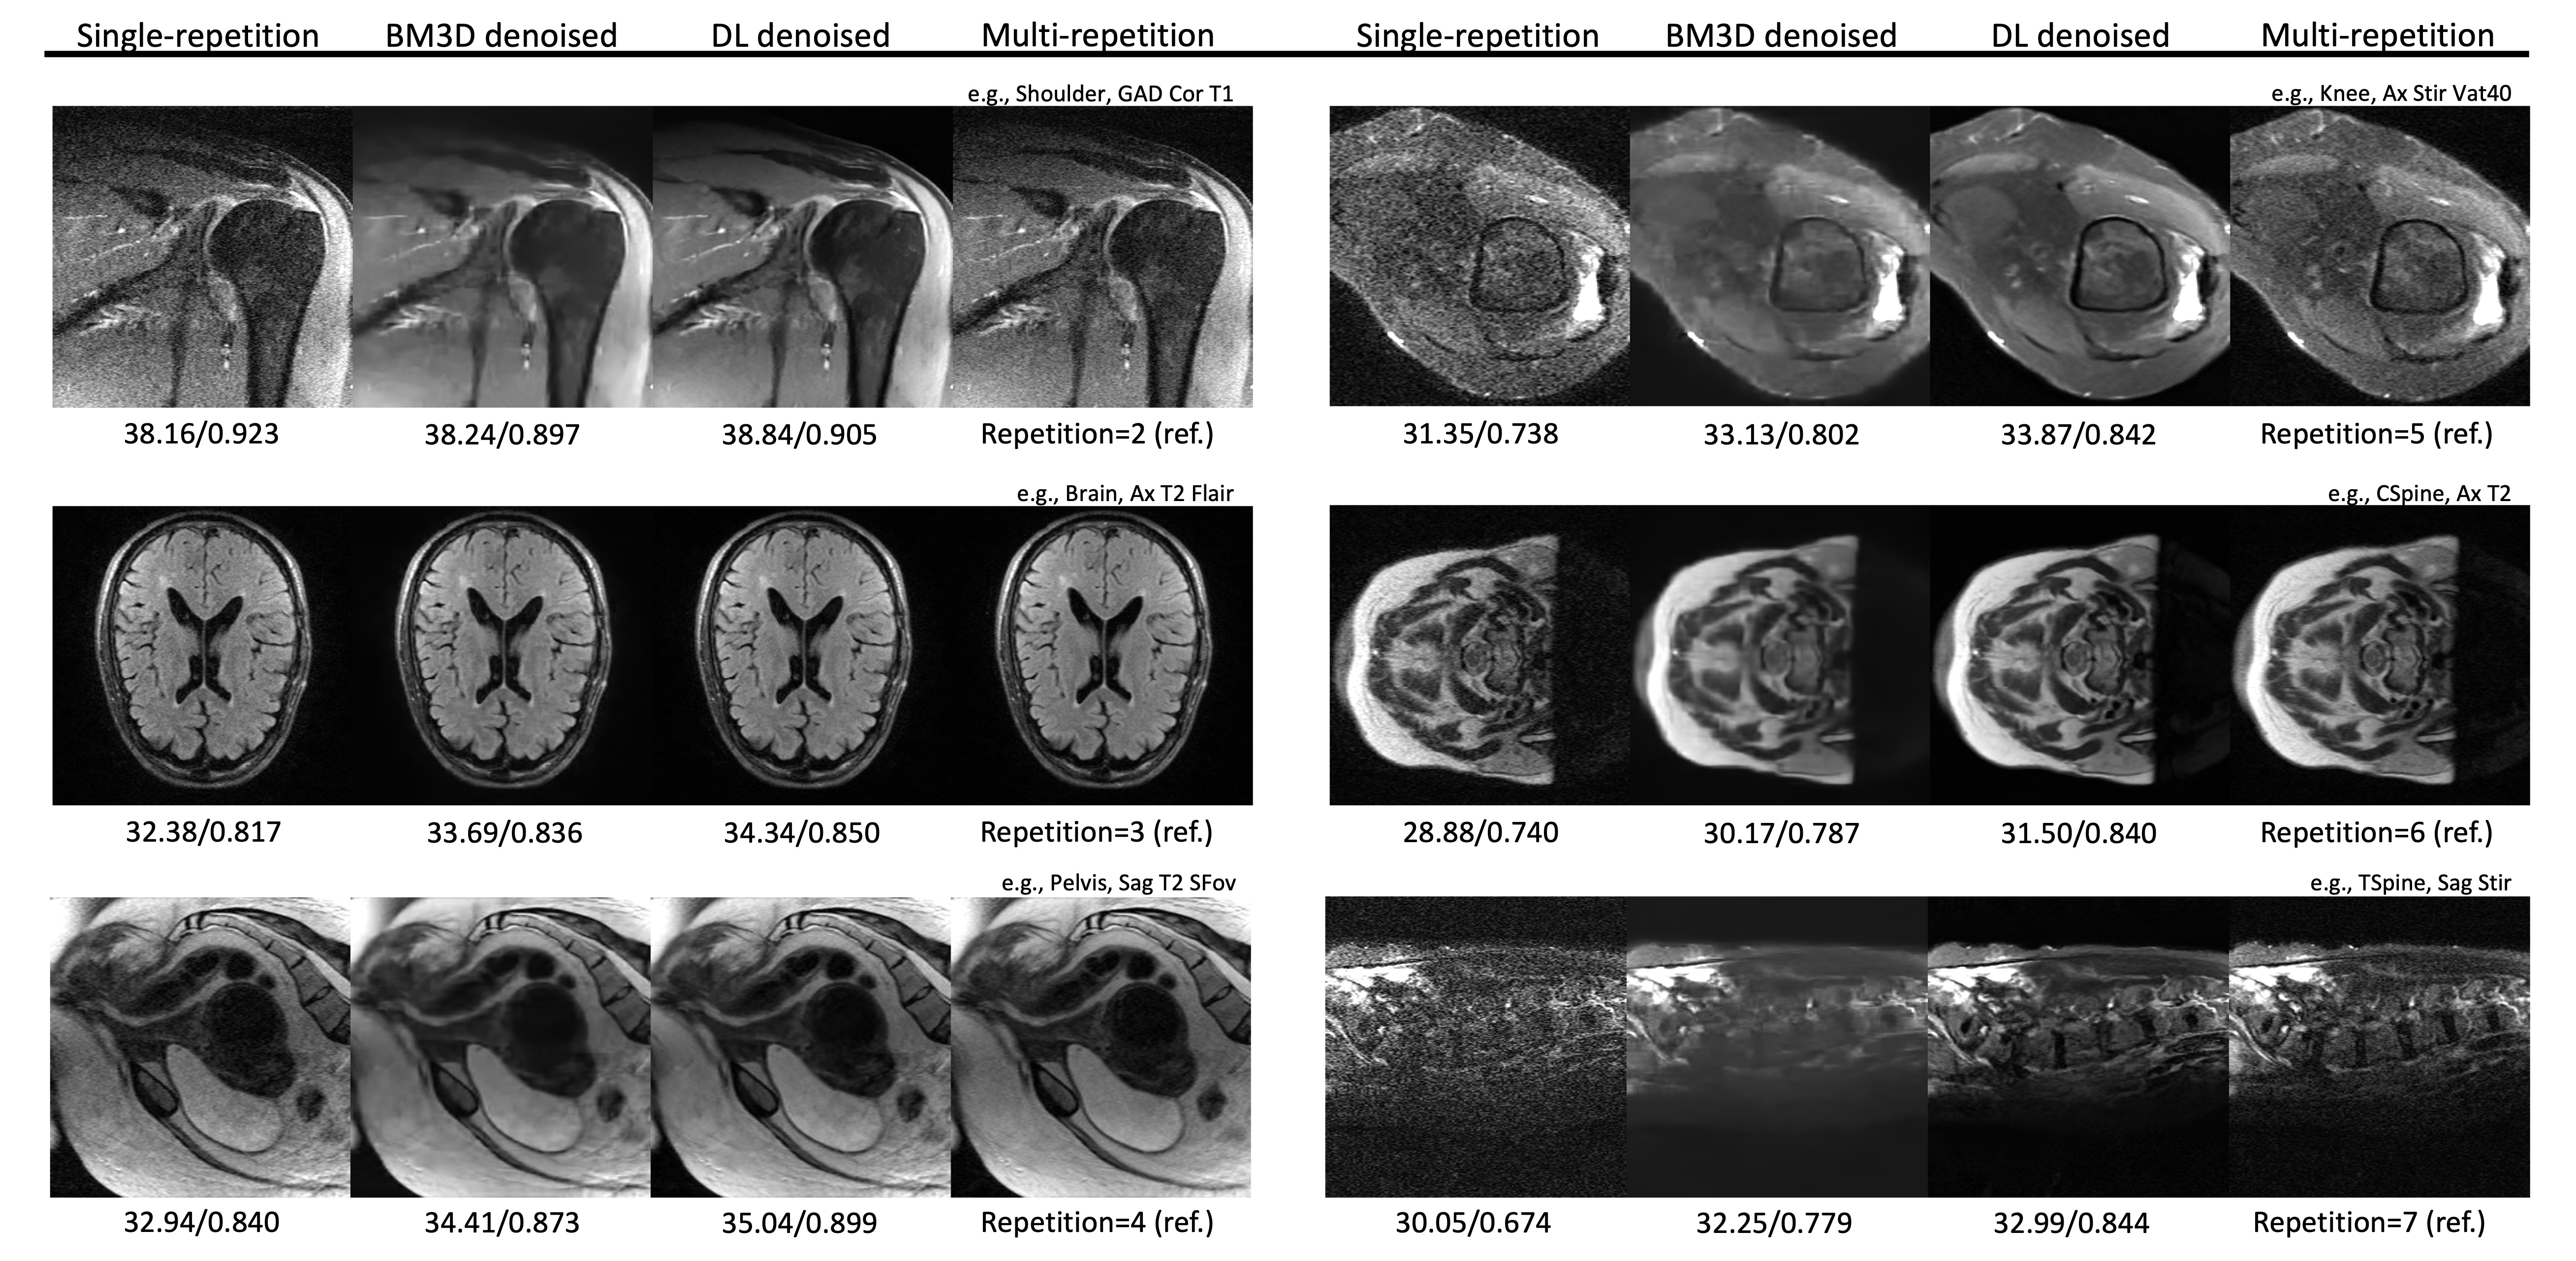
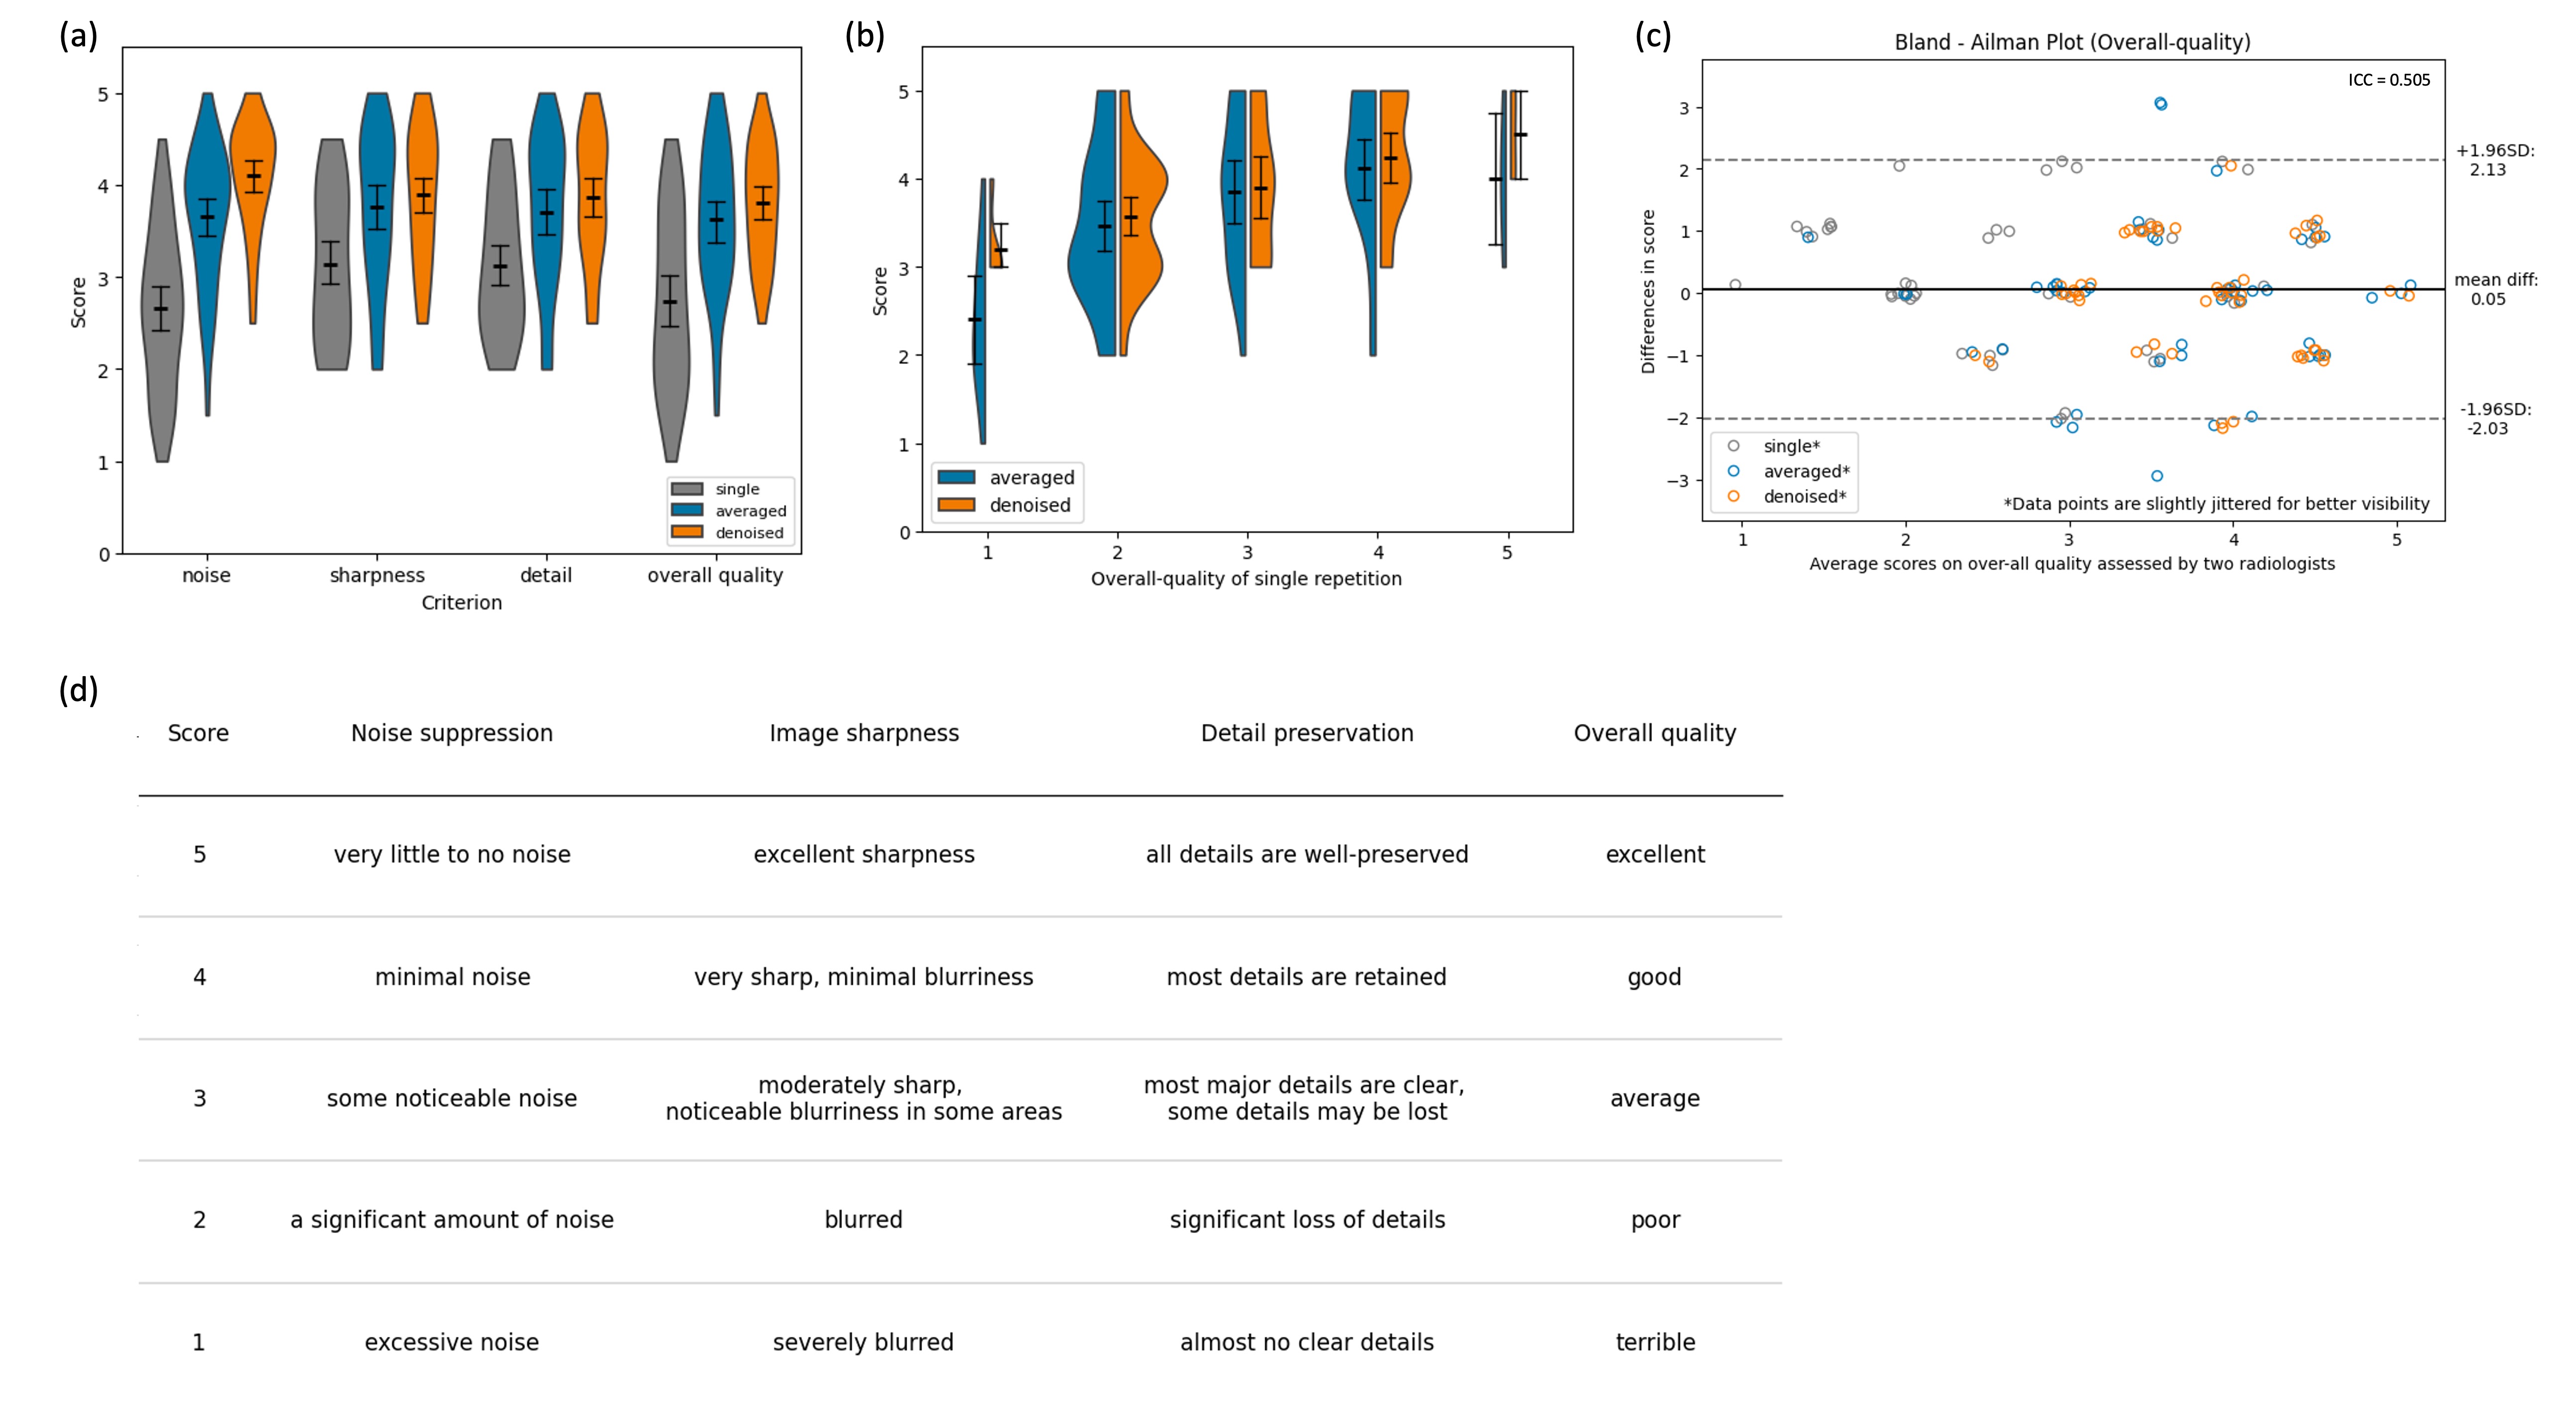
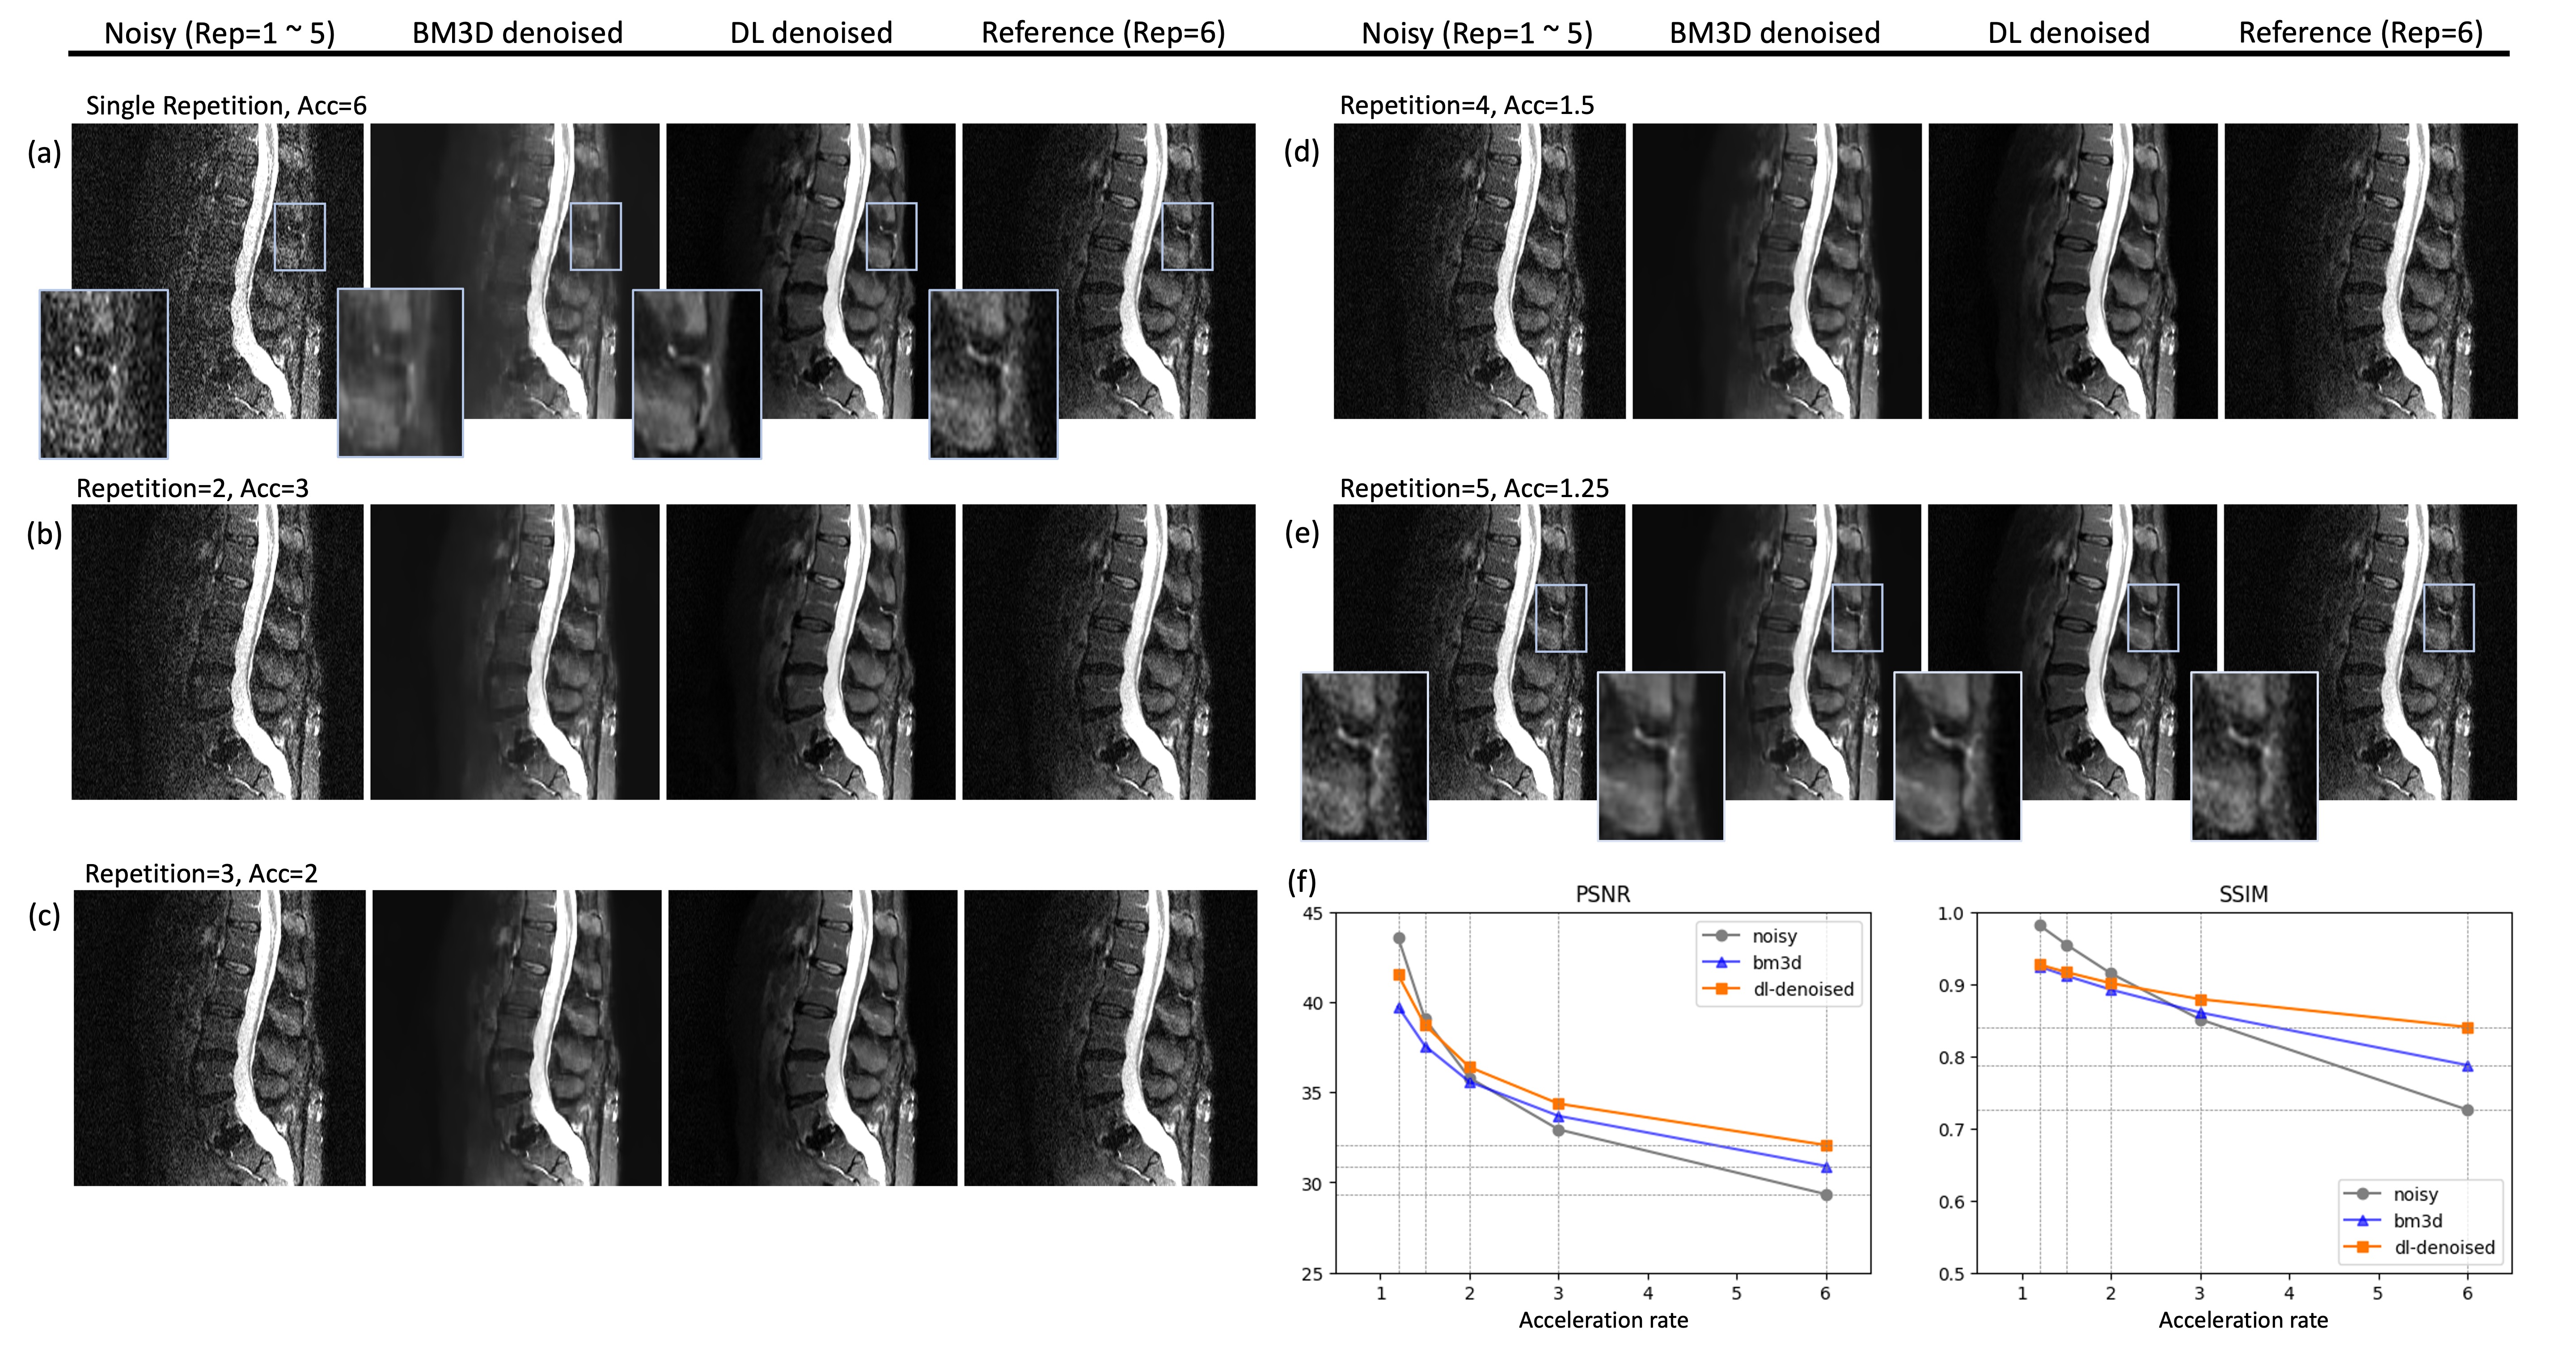
Fig.5 Evaluation of denoising performance under 1.25-6x acceleration. In (a)-(e), we employed the averages of six single-repetitions as multi-repetition references to represent non-accelerated scenarios. We used the averages of 1 to 5 single-repetition(s) as inputs for denoising, corresponding to acceleration factors of 6, 3, 1.5, and 1.25 times in real-world scans. (f) Presents the mean PSNR and SSIM values relative to the non-accelerated references over all 10 cases.