0873
Self-supervised representational learning for automated risk assessment in longitudinal imaging1Bernard and Irene Schwartz Center for Biomedical Imaging, Department of Radiology, New York University Grossman School of Medicine, New York, NY, United States, 2Center for Advanced Imaging Innovation and Research (CAI2R), Department of Radiology, New York University Grossman School of Medicine, New York, NY, United States
Synopsis
Keywords: Diagnosis/Prediction, Machine Learning/Artificial Intelligence, Longitudinal health monitoring
Motivation: Techniques that allow automated evaluation of the evolution of disease risk over time can be of great value for active surveillance and other imaging-based monitoring.
Goal(s): We introduce a novel self-supervised framework to learn representations that can identify increases in risk over time.
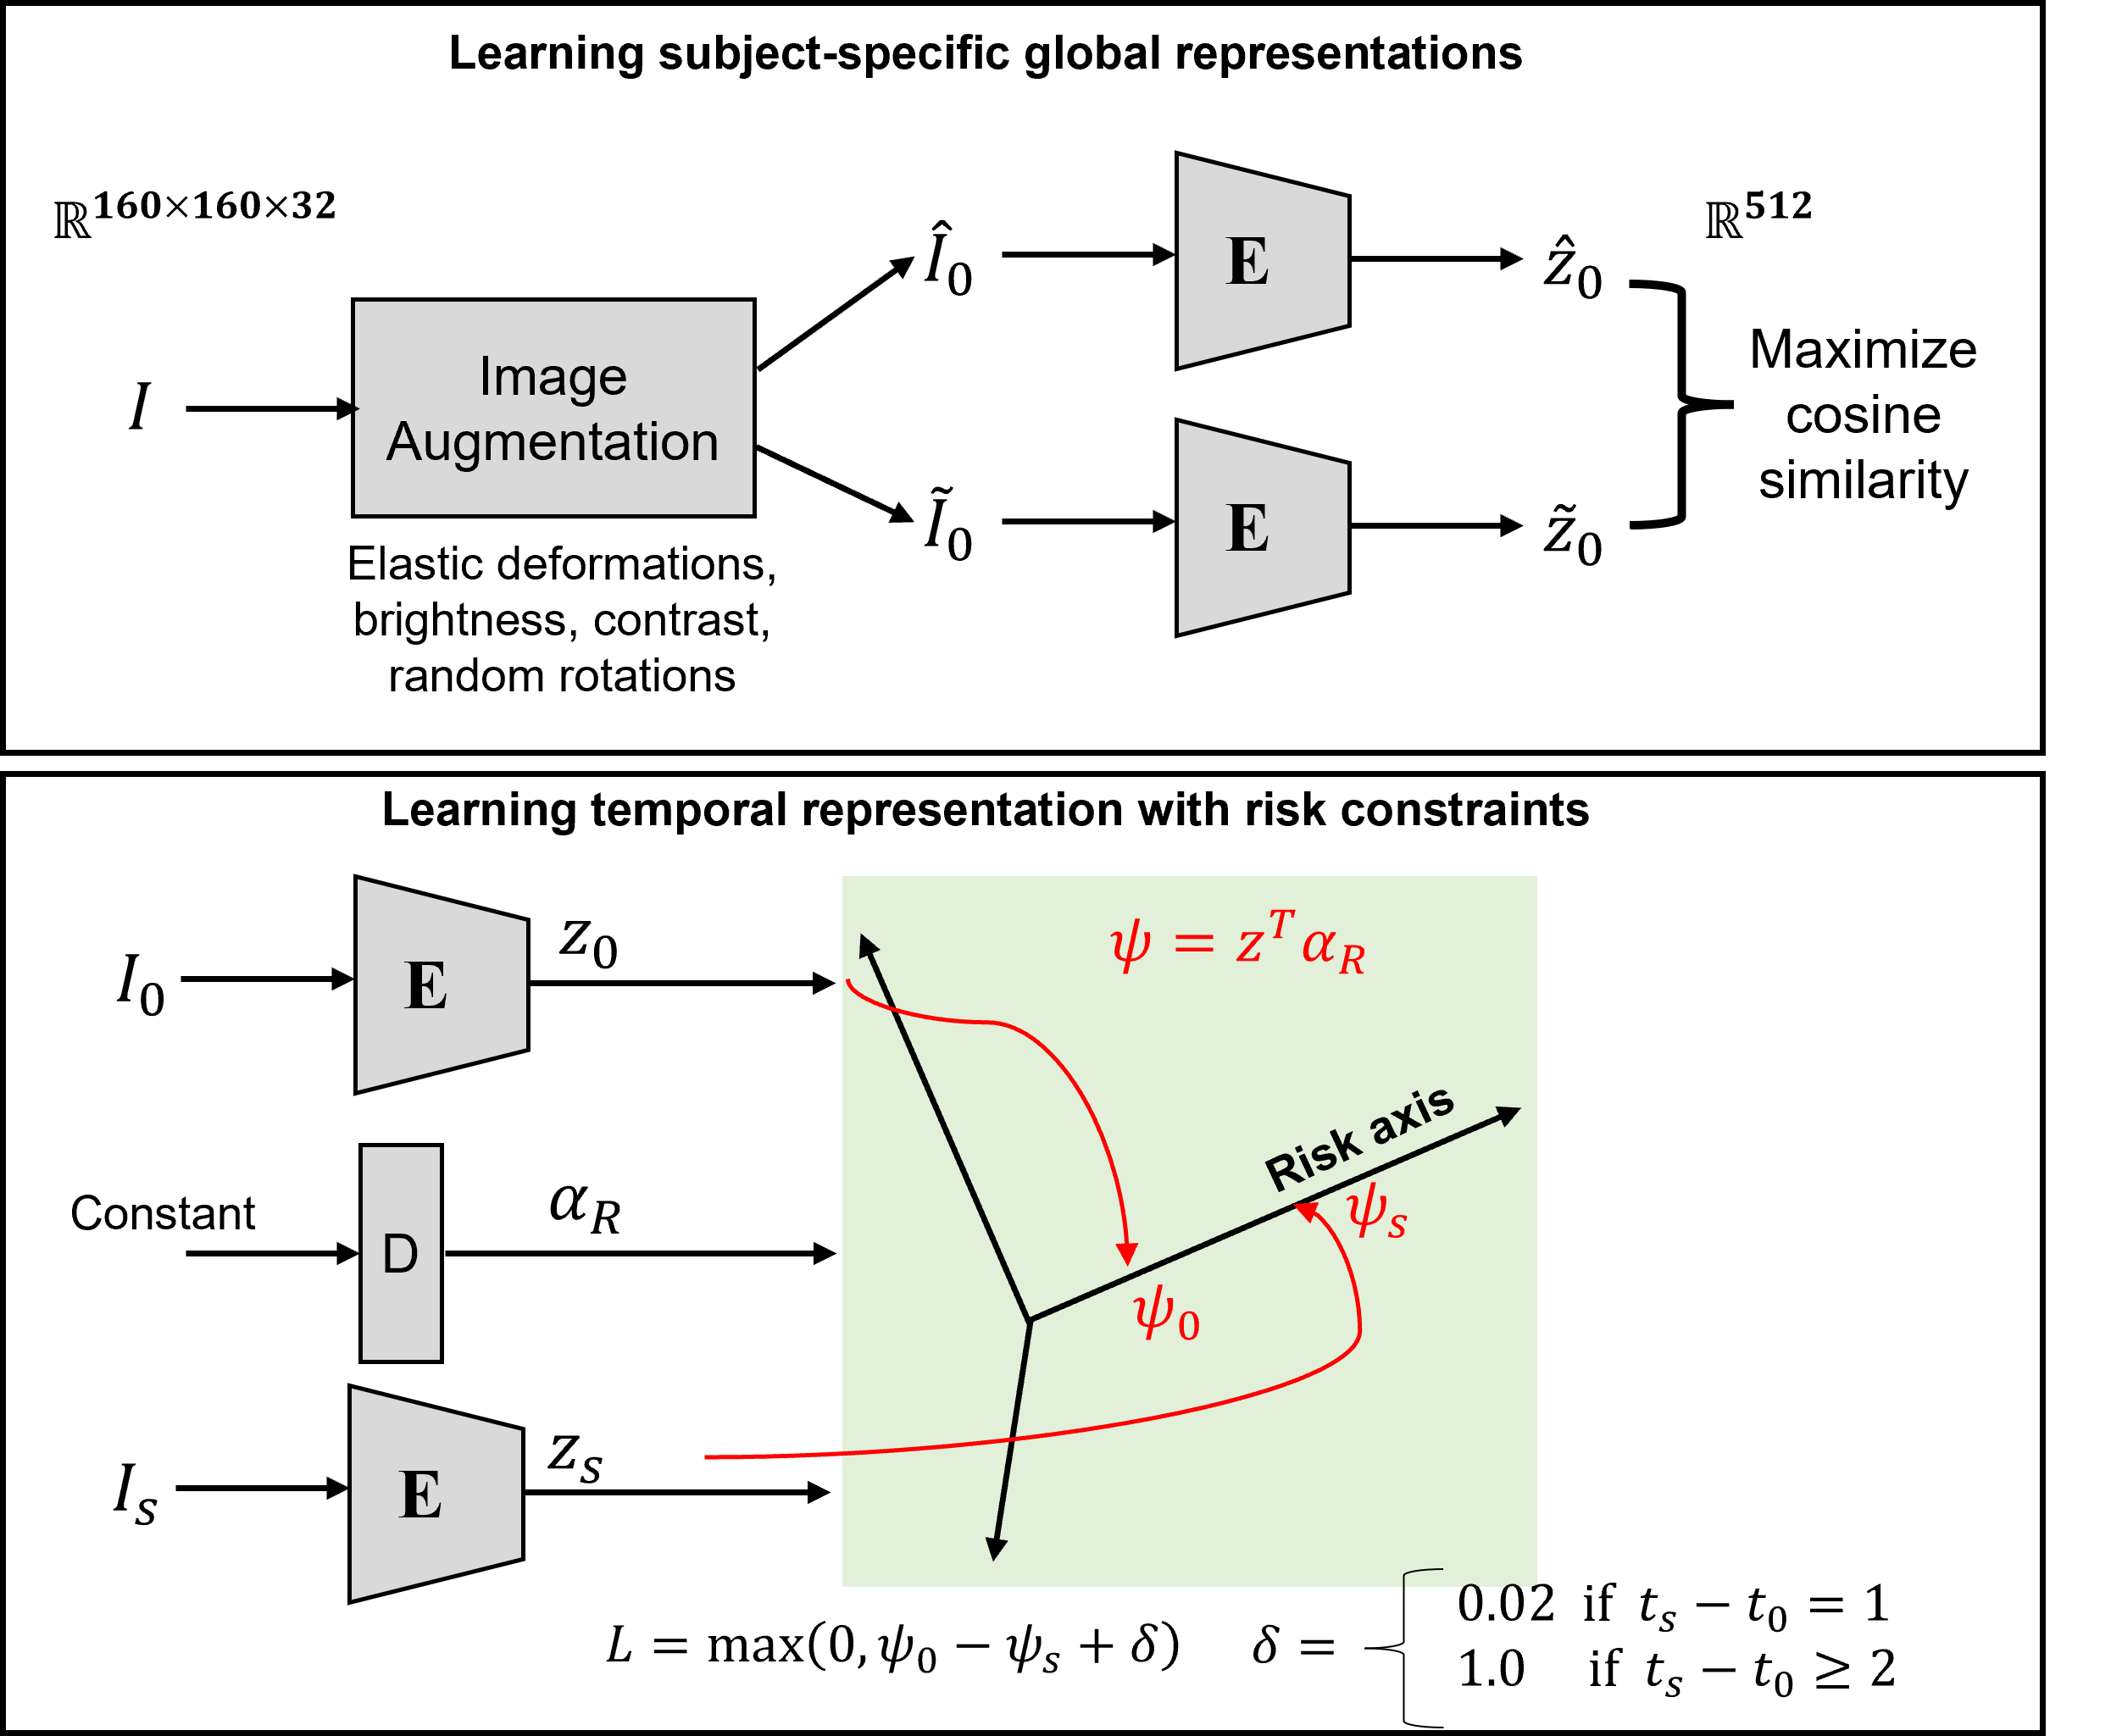
Approach: We propose a contrastive learning model to first learn subject-specific representations from low-slice-resolution images followed by learning a risk axis in the representational space to provide information on global changes in risk over time.
Results: The developed framework was used to assess risk of new metastases in a cohort of subjects from the NYU-Mets longitudinal imaging dataset.
Impact: A key question when moving to lower field strengths in MRI is if we can get comparable information from lower-quality images as we can from the current standard of high-quality, high-resolution images. Self-supervised contrastive learning approaches can hold the key.
Introduction
Active surveillance using MRI has seen increasing use in recent years for the monitoring of at-risk populations. Meanwhile, recent advances in accessible MRI raise the prospect of using MR for more broad-based longitudinal monitoring. Such monitoring approaches will benefit from techniques that can automatically evaluate the evolution of risk over time. The availability of large numbers of unlabeled datasets in medical imaging offers enormous potential for representational learning approaches that can learn generalized representations to identify and disentangle explanatory factors hidden in the observed data [1]. By harnessing information from longitudinal imaging data, we can build both population-level and patient-specific models that capture temporal changes in the anatomy. In this work, we present a self-supervised deep learning framework to assess subject-specific changes in risks over time from low resolution data and demonstrate its application to identifying increased risk of metastasis in a cohort of subjects from the public NYU-Mets longitudinal imaging dataset [2].Methods
When trained with an appropriate loss function, contrastive learning can learn latent representations of high-dimensional imaging data. Conventional contrastive learning [1] can help a deep learning model learn subject-specific representations by identifying positive samples from augmented versions of the data and negative examples randomly sampled from a population. To enable subject-specific learning, we consider a learnable risk-axis in this latent space to summarize key global changes over time and provide quantitative subject-specific monitoring.Learning a risk axis
We hypothesize that, in the absence of therapeutic intervention, disease risk increases over time, and we aim to quantify it in the representational space by learning this risk-dimension. If we consider $$$I_0$$$ and $$$I_s$$$ to be MR volumes corresponding to an initial and a subsequent time point ($$$t_0$$$ and $$$t_s$$$), and that a deep learning model $$$\Phi(.)$$$ generates representations $$$z_0=\Phi(I_0)$$$ and $$$z_s=\Phi(I_s)$$$, the risk at time $$$t_s$$$ would be would be greater than or equal to the risk at $$$t_0$$$. We measure this relative risk by projecting the learned representations on a learnable risk axis $$$\alpha_R$$$.
$$\phi_0 = \phi(z_0) = z_0^T \alpha_R$$
The risk axis $$$\alpha_R$$$ is learned by enforcing a minimum distance $$$\delta$$$ between projections of subsequent time points (Hinge loss) as follows:
$$L(\psi_0,\psi_s) = max(0,\psi_0 - \psi_s + \delta)$$
The value of margin $$$\delta$$$ is controlled by the time difference between $$$t_0$$$ and $$$t_s$$$.
Model training
Rather than assuming full-quality training data, we simulate low-resolution data as might be acquired from low-field MR scanners. To simulate thick slab excitation, we synthetically generate lower slice resolution data from source high-resolution data by using non-overlapping windows for signal averaging along the slice dimension. The 3D deep learning model is trained with self-supervision in two stages. In the first stage, the contrastive strategy uses a variety of augmentations (deformations to simulate aging-related changes, rotations for random head tilts, brightness/contrasts for scanner variations) to learn global subject-specific representations (Figure-1A). In the second stage (Figure-1B), the risk axis, represented by the weights of a Dense layer with a constant input, is learned using longitudinal data consisting of an initial and randomly sampled subsequent time point.
We demonstrate an application of this approach to examine relative change in risk in T2-FLAIR volumes the public NYU-Mets dataset [2]. The dataset provides brain-extracted and intensity normalized NIFTI volumes. To examine risk, a subset of the T2-FLAIR volumes are identified after an initial quality control (n=50, two time points per subject). We use the labels for appearance of new metastases (new METS, 0/1) between initial and subsequent time points to examine group differences in generalized changes in risk i.e., $$$(\psi_s - \psi_0)$$$
Results
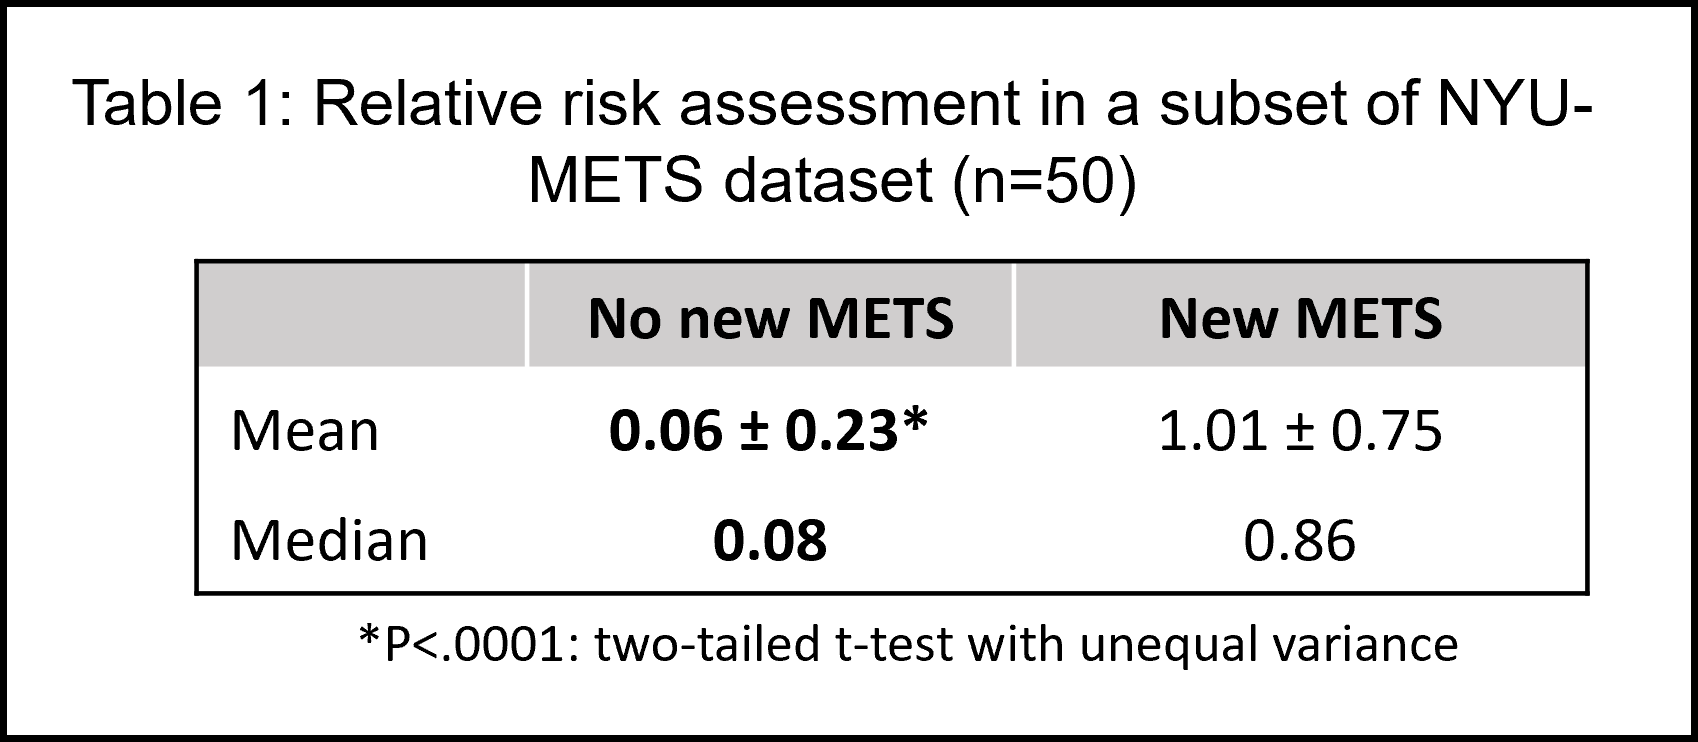
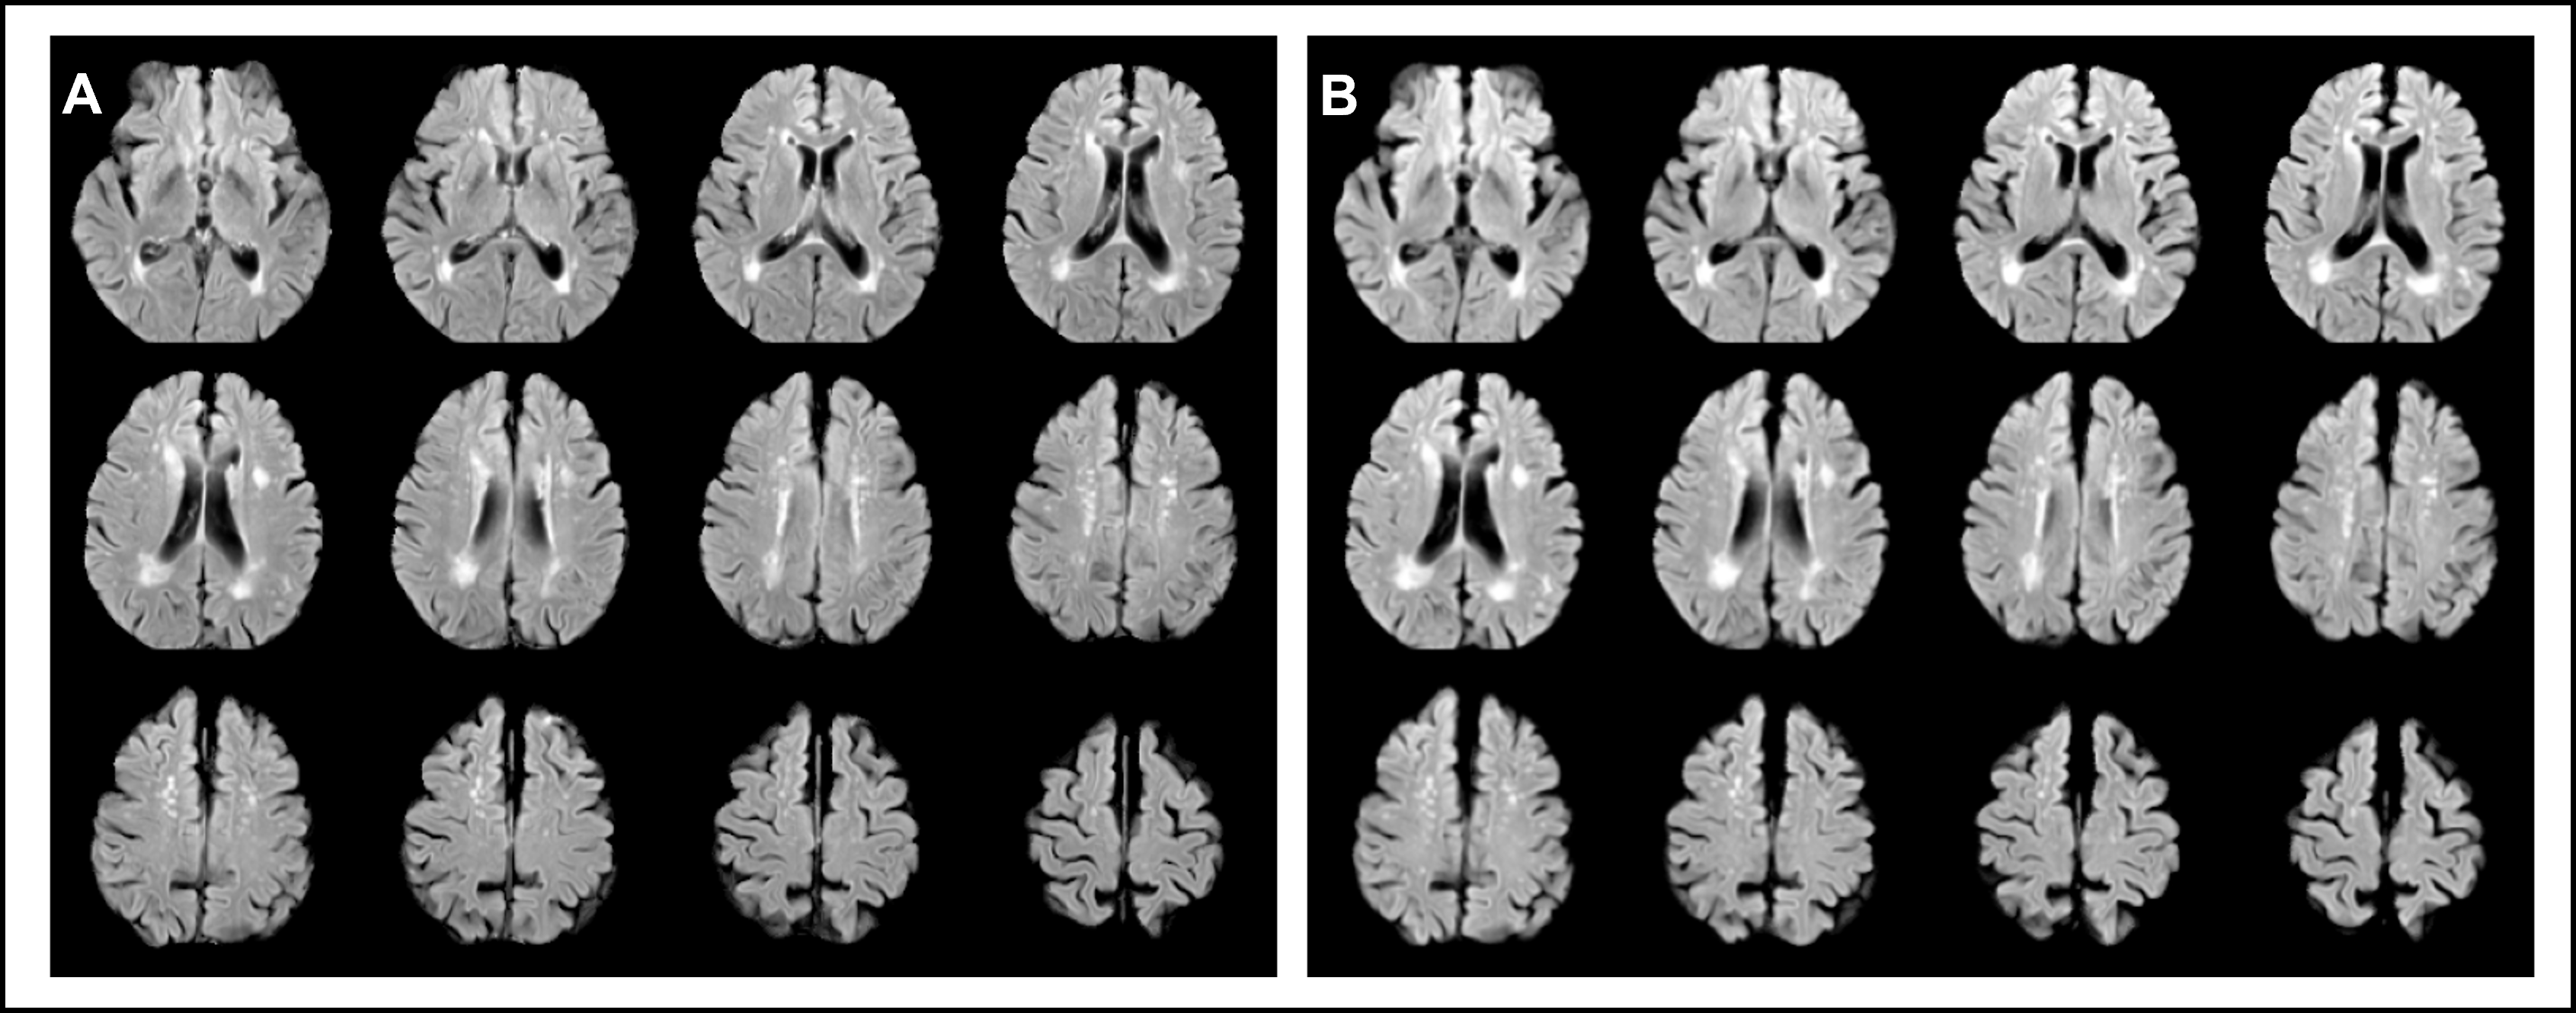
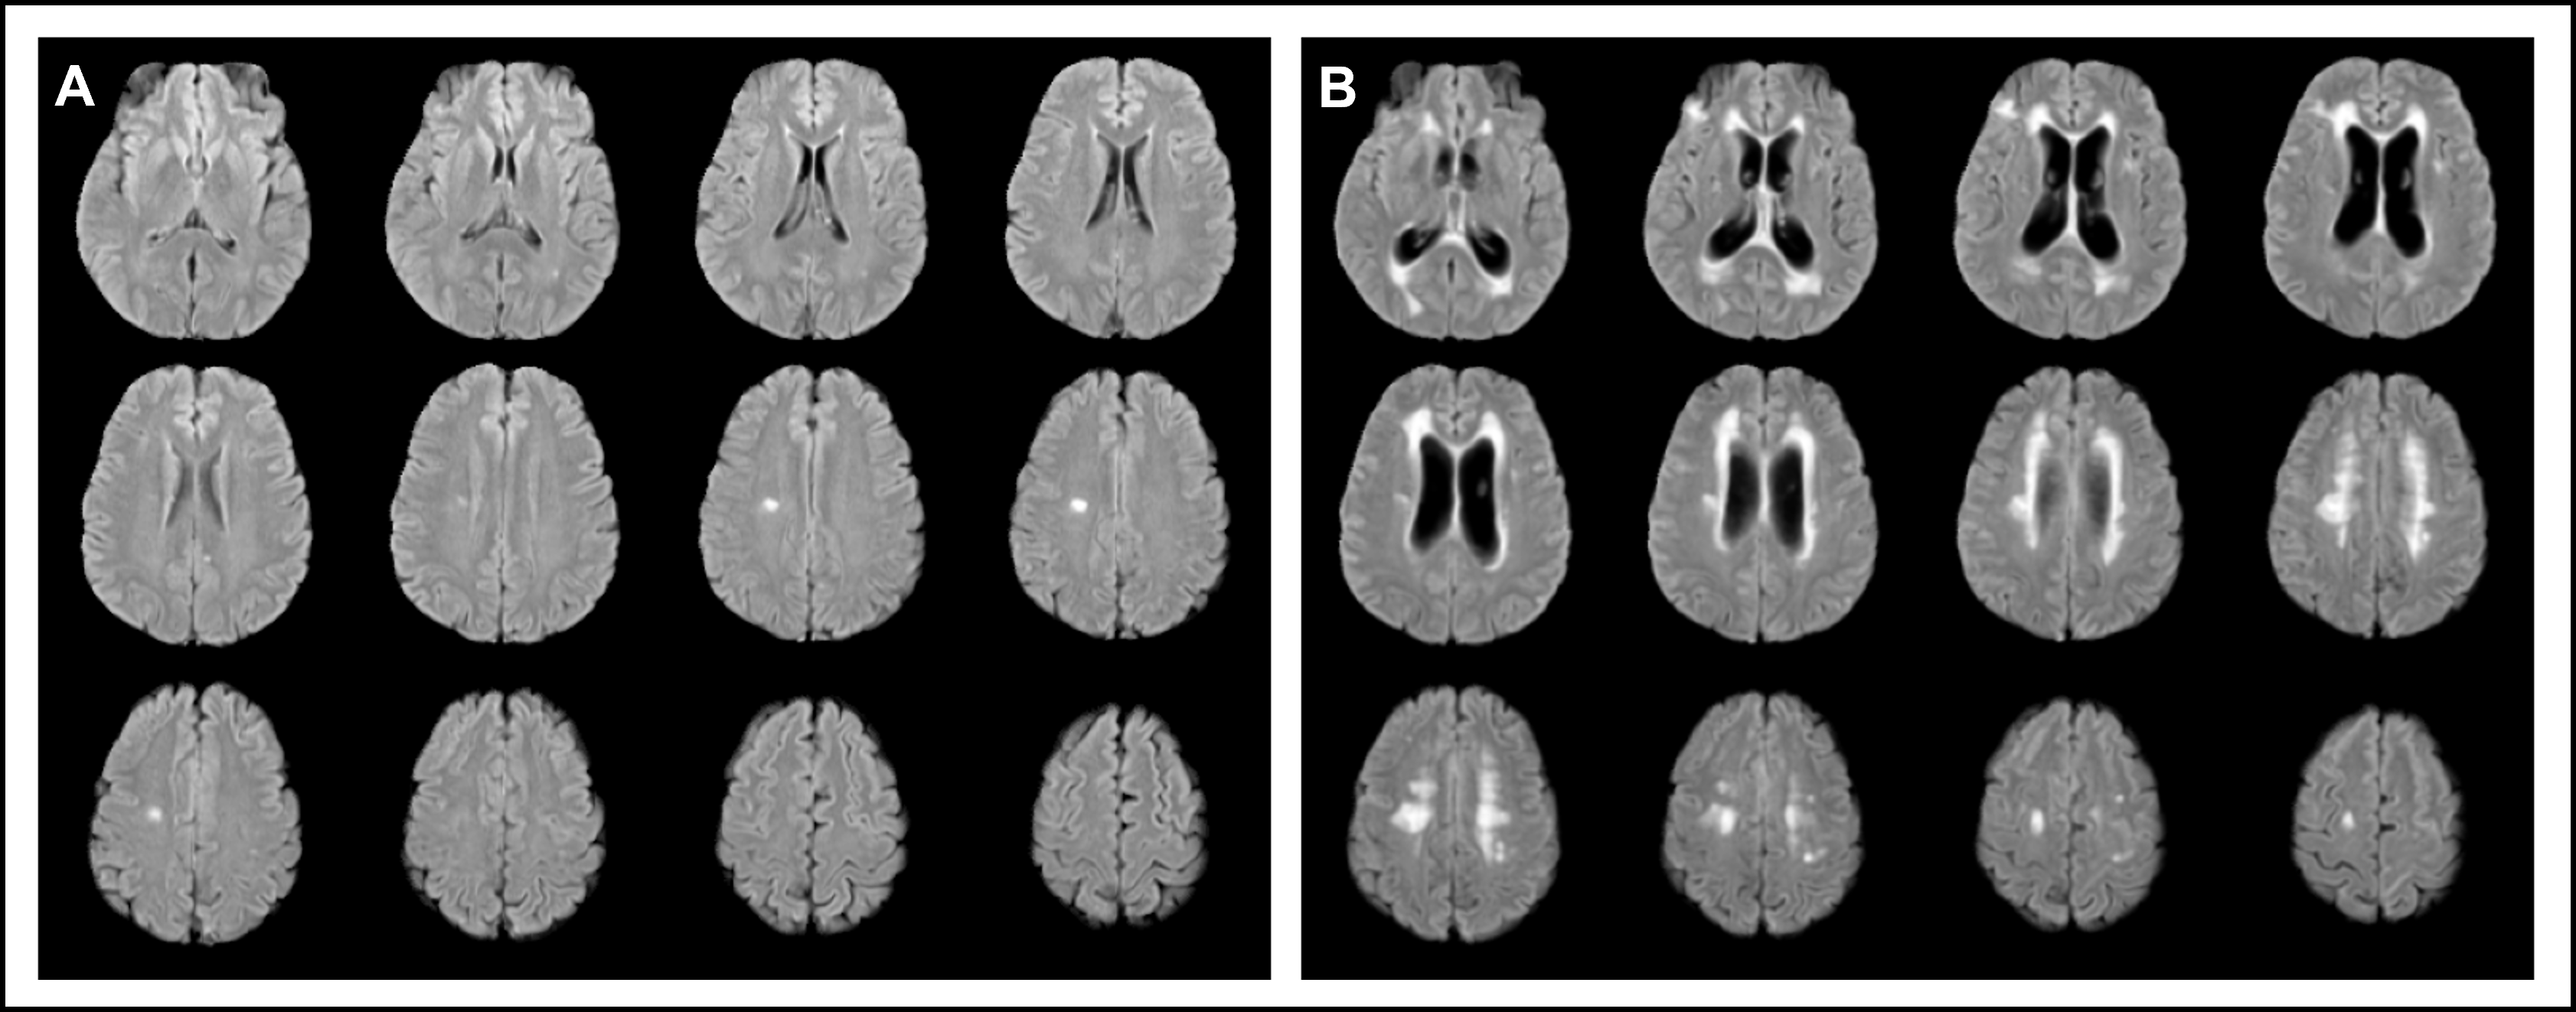
The DL model learns a 512-dimensional latent representation from T2-FLAIRs (160x160x32, originally 150 slices) in the initial stage of training. We observe that subjects with new brain metastasis were associated with significantly higher risk (1.01 vs 0.06, P<.0001) on average compared to the ones without (Table 1). Figures 3 and 4 present a visual comparison of two cases, one with no new METS in the subsequent time point (relative risk = 0.08) and one with new METS (relative risk = 1.75), respectively. An 8-fold cross-validation with a simple logistic regression classifier yielded an accuracy of 0.865 in predicting the presence of new metastasis using the relative risk assessment values.Conclusion
In this work, we present a self-supervised approach to learn changes in subject-specific risk over time. Harnessing the power of representational learning, changes associated with pathology can be assessed with the relative risk analysis, even using training data of comparatively low resolution.Acknowledgements
This work was performed under the rubric of the Center for Advanced Imaging Innovation and Research (CAI2R, www.cai2r.net), an NIBIB National Center for Biomedical Imaging and Bioengineering (NIH P41 EB017183).References
[1] Bengio Y et al. Representation learning: a review and new perspectives. IEEE Trans Pattern Anal Mach Intell. (2013)
[2] Oermann E, Link K, Schnurman Z, et al. Longitudinal deep neural networks for assessing metastatic brain cancer on a massive open benchmark.. Research Square; 2023. DOI: 10.21203/rs.3.rs-2444113/v1.
Figures