0871
Using Multi-sequence MRI-based Convolutional Neural Network to Predict the Methylation Status of MGMT Promoter in Glioma1Clinical medicine school of Ningxia Medical University, Yinchuan, China, 2Medical Imaging Center of Ningxia Hui Autonomous Region People's Hospital, Yinchuan, China, 3Department of Radiology ,the First Hospital Affiliated to Hainan Medical College, Haikou, China, 4GE Healthcare MR Research, Beijing, China
Synopsis
Keywords: Diagnosis/Prediction, Radiomics, Gliomas
Motivation: The MGMT promoter is closely associated with the survival period of glioma patients and their response to chemotherapy drug temozolomide. Predicting the promoter status of MGMT accurately pre-operator is crucial for making personalized treatment decisions for glioma patients.
Goal(s): To propose models based on CNNs to predict the MGMT methylation status of gliomas using conventional pre-operative MR images.
Approach: Building three CNNs models based on T2WI, T2-FLAIR, CE-T1WI images, respectively. Fusing features to build the fourth model to predict the MGMT methylation status.
Results: All models can predict the MGMT status effectively and accurately, the fused-feature model has the best diagnostic performance.
Impact: Models based on conventional MRI sequences and VASARI features provide the clinical value for evaluation of molecular typing in gliomas. It is expected to become a practical tool for the non-invasive characterization of gliomas to help the individualized treatment planning.
Introduction
Glioma is the most common malignant primary brain tumor in adults. It is a highly heterogeneous disease with multiple molecular subtypes and different treatment strategies or clinical prognosis[1,2]. O6-Methylguanine-DNA-methyltransferase (MGMT) promoter methylation confers an improved prognosis and treatment response in gliomas. Thus, determining MGMT promoter methylation status is important in predicting survival rate or designing treatment plan[3], but there is no reliable and non-invasive way to achieve this. Therefore, considerable attention has been dedicated to developing image-based diagnostic methods to determine MGMT promoter methylation status. The Convolutional neural network (CNN) is a representative method to exploit high-dimensional numeric information from images by learning relevant features directly from image signal intensities, and it is being studied in great demand in glioma molecular classification[4]. The purpose of the study was to predict the MGMT promoter methylation status of patients with gliomas (grades 2-4) from pre-operative MR images using deep learning approach.Methods
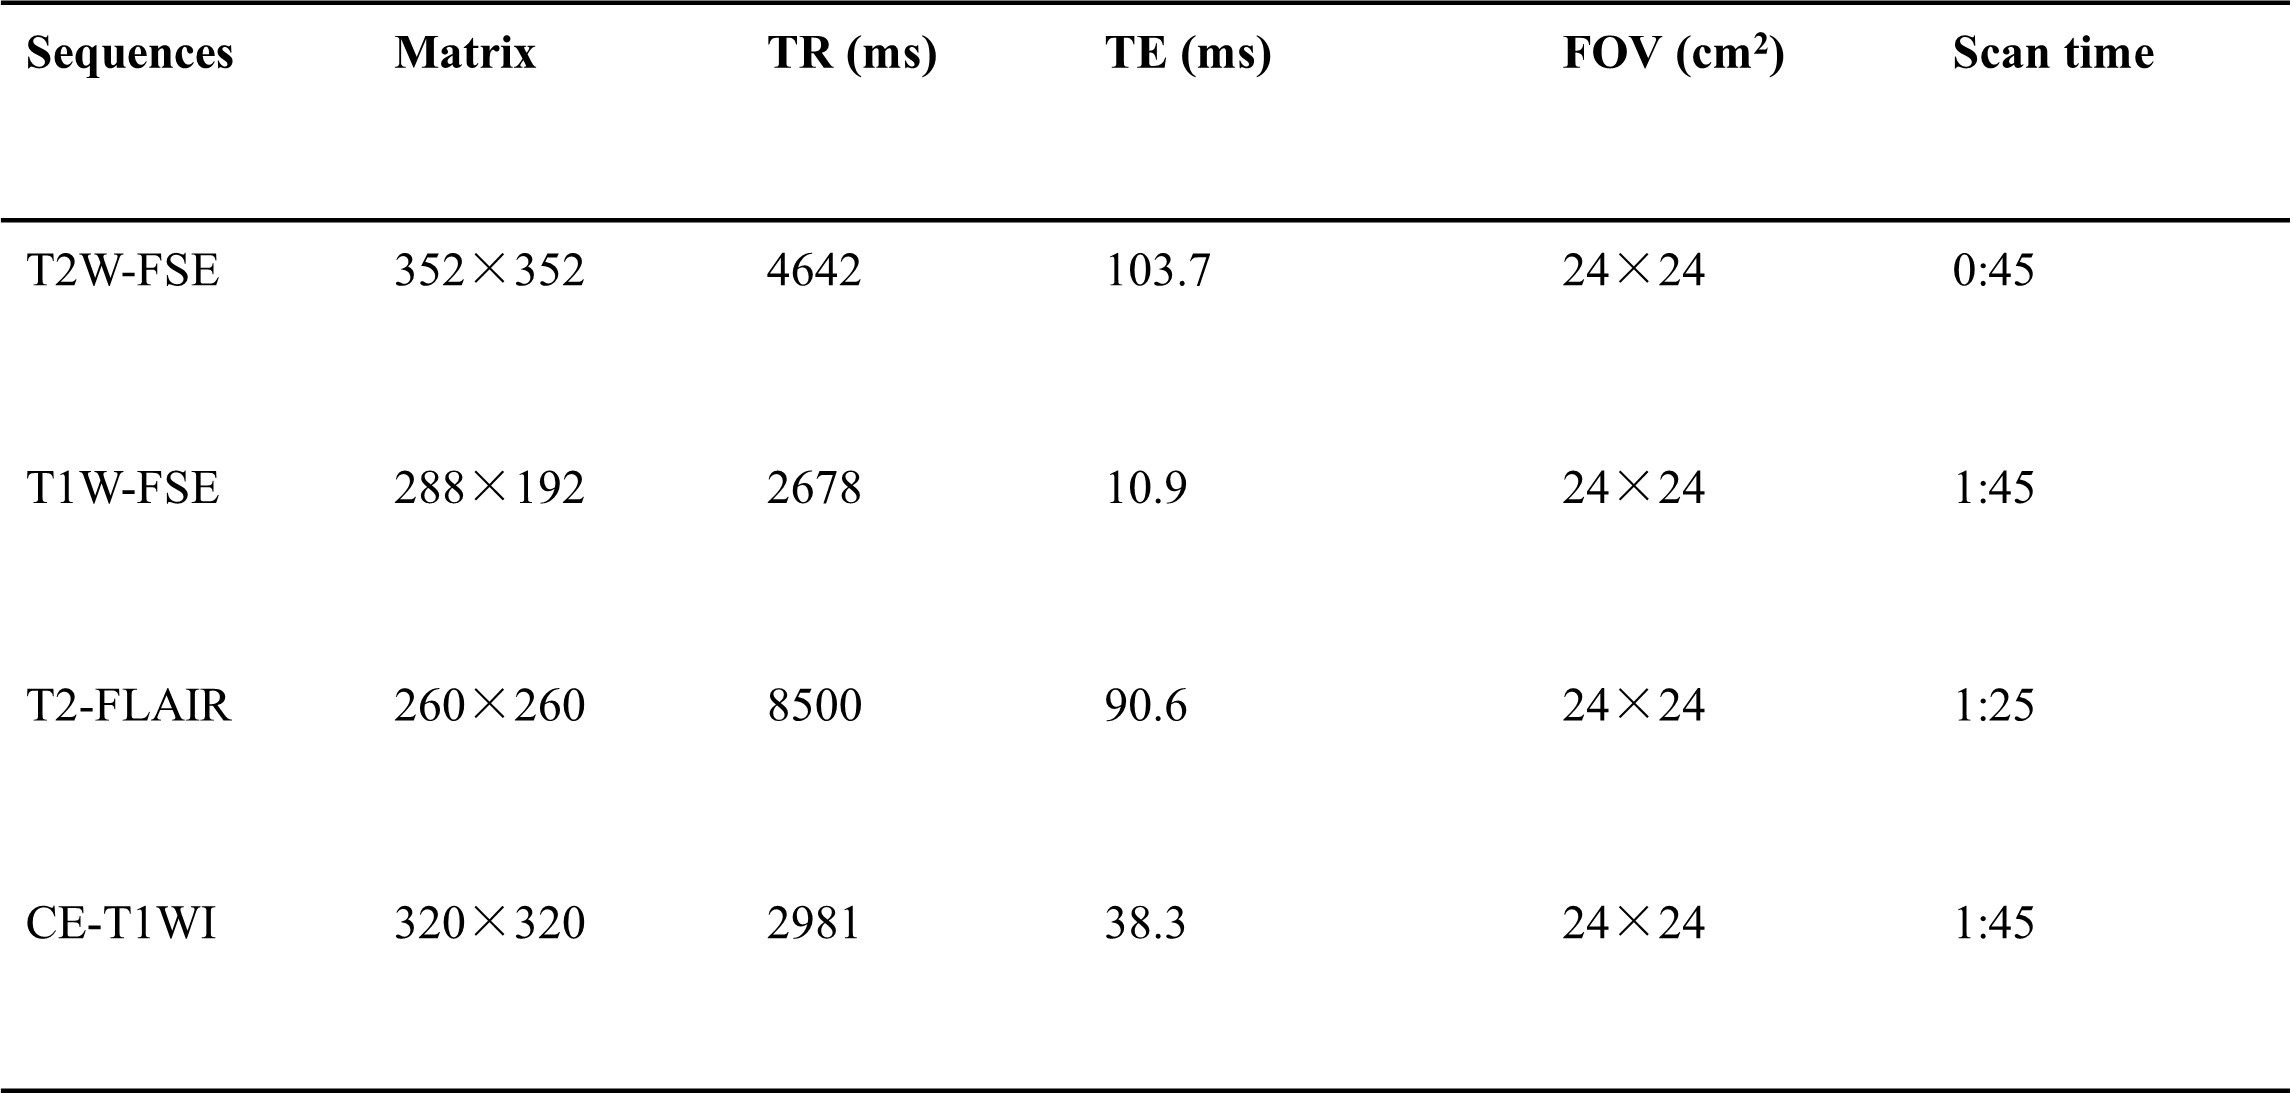
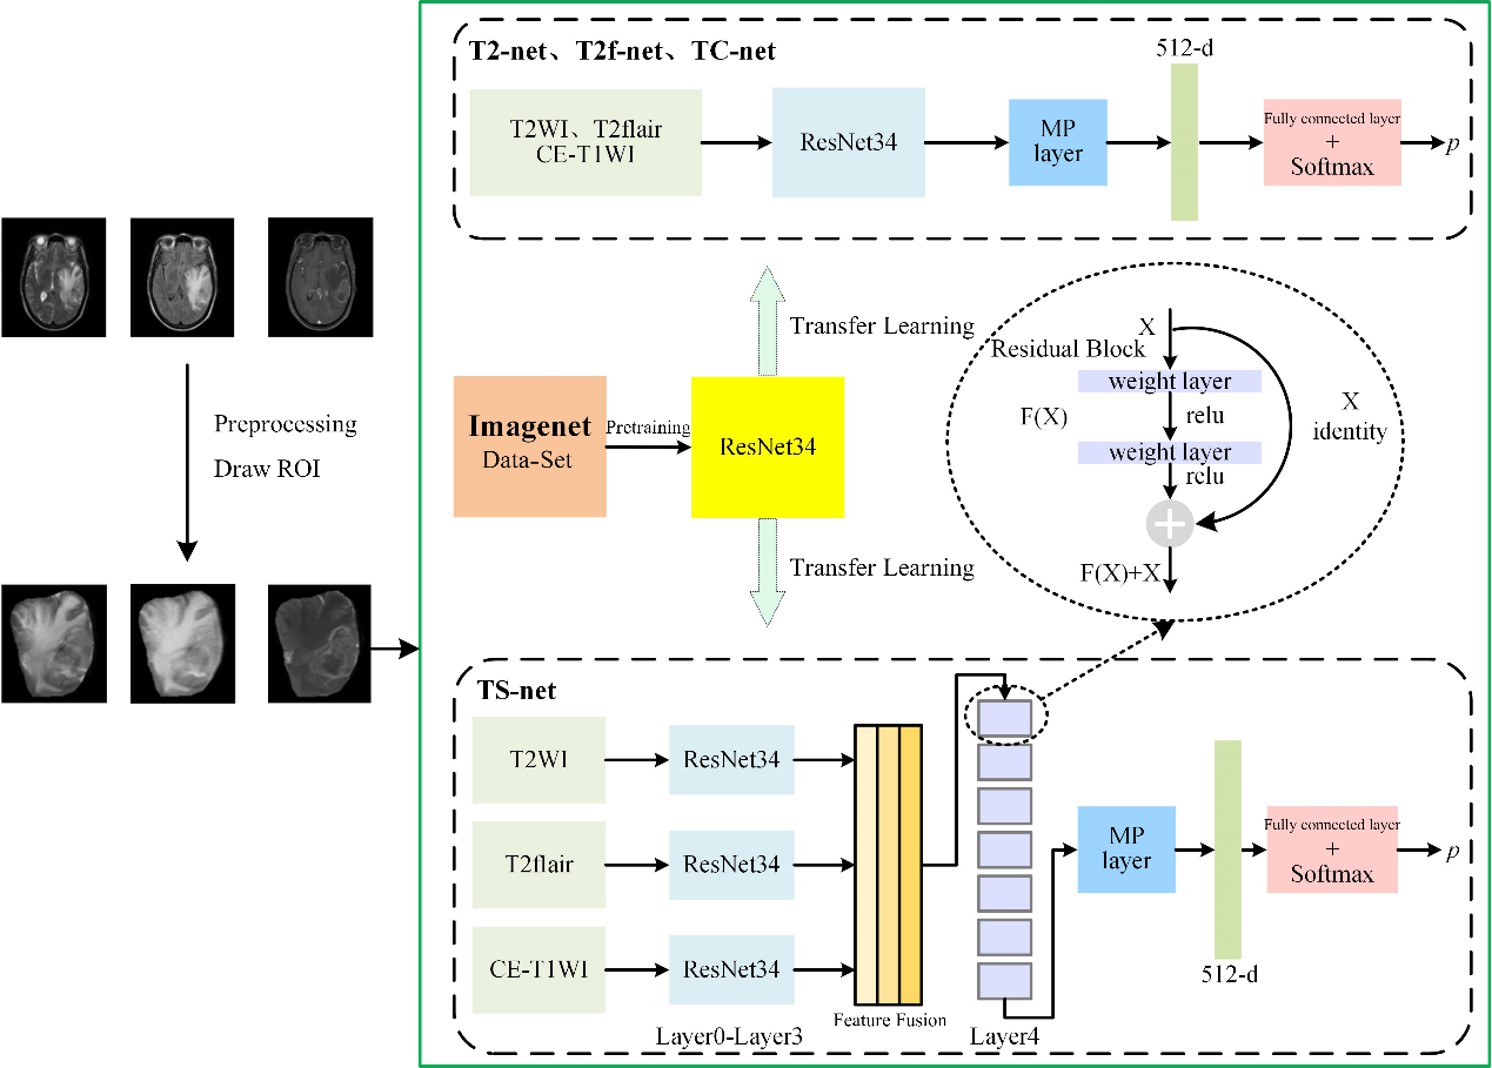
161 patients (59 female, 48.7±1.6years; 102 male, 49.4 ±1.2years) were retrospectively included in this study. The inclusion criteria were as follows: (i) pathologically confirmed glioma, (ii) known MGMT status, (iii) preoperative MRI inclusive of CE-T1WI, T2WI, T2-FLAIR, and (iv) age ≥18 years. All MR examinations were performed on a 3.0T MR scanner (SIGNATM Architect; GE Healthcare, Milwaukee, WI, USA) with a 48-channel head coil. The scan protocol and detailed parameters were listed in Table 1. Regions of interest (ROI) were outlined after preprocessing of all images. ROI includes tumor area and surrounding edema area. The images were randomly divided into training and validation sets according to 7:3 after labeling. A 34-layer-residual neural network (ResNet34) was used to build models based on T2WI, T2flair, CE-T1WI and multiple sequence fusion to predict the methylation status of MGMT promoters, named as T2-net, T2f-net, TC-net and TS-net, respectively. We pre-trained the ResNet34 using the ImageNet public dataset, reloaded the trained weight parameters, and transferred to the ResNet34 in our study The experimental design flowchart is shown in Figure 1. The area under the receiver operating characteristic (AUROC), area under the precision-recall curve (AUPRC), accuracy, specificity and sensitivity were used to assess model efficacy, and the predictive power was compared between models by DeLong test.Results
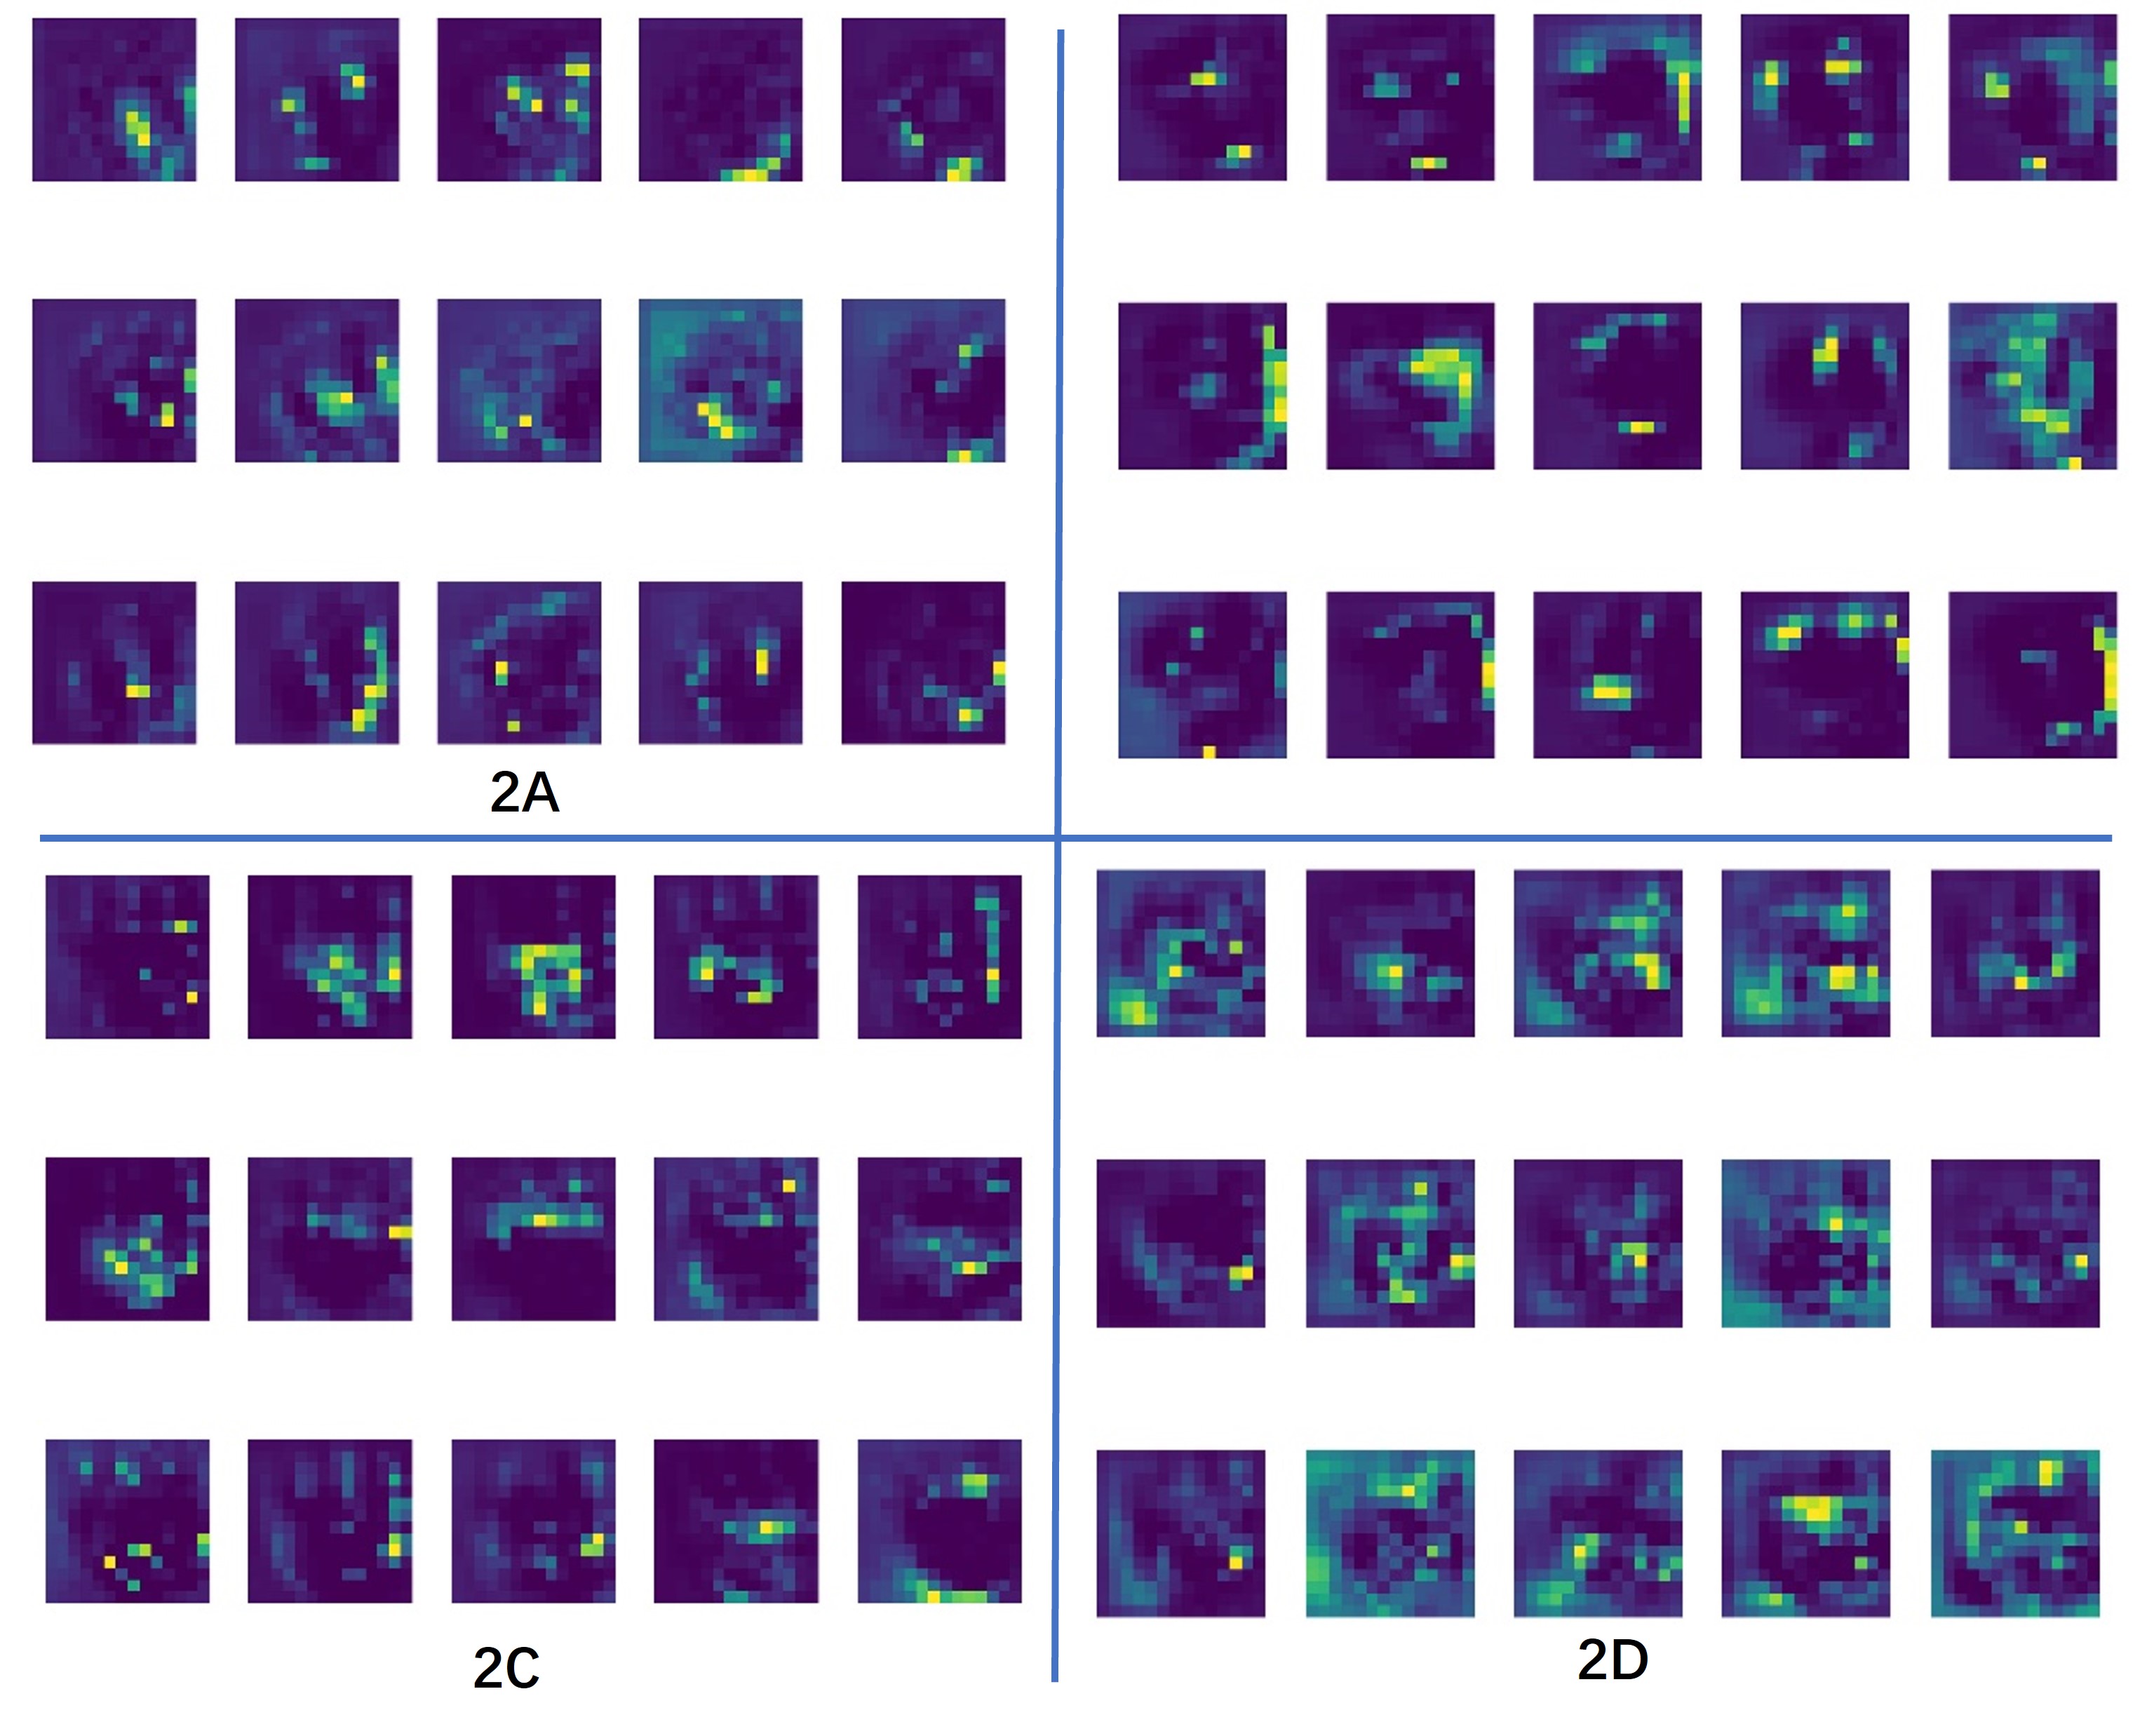
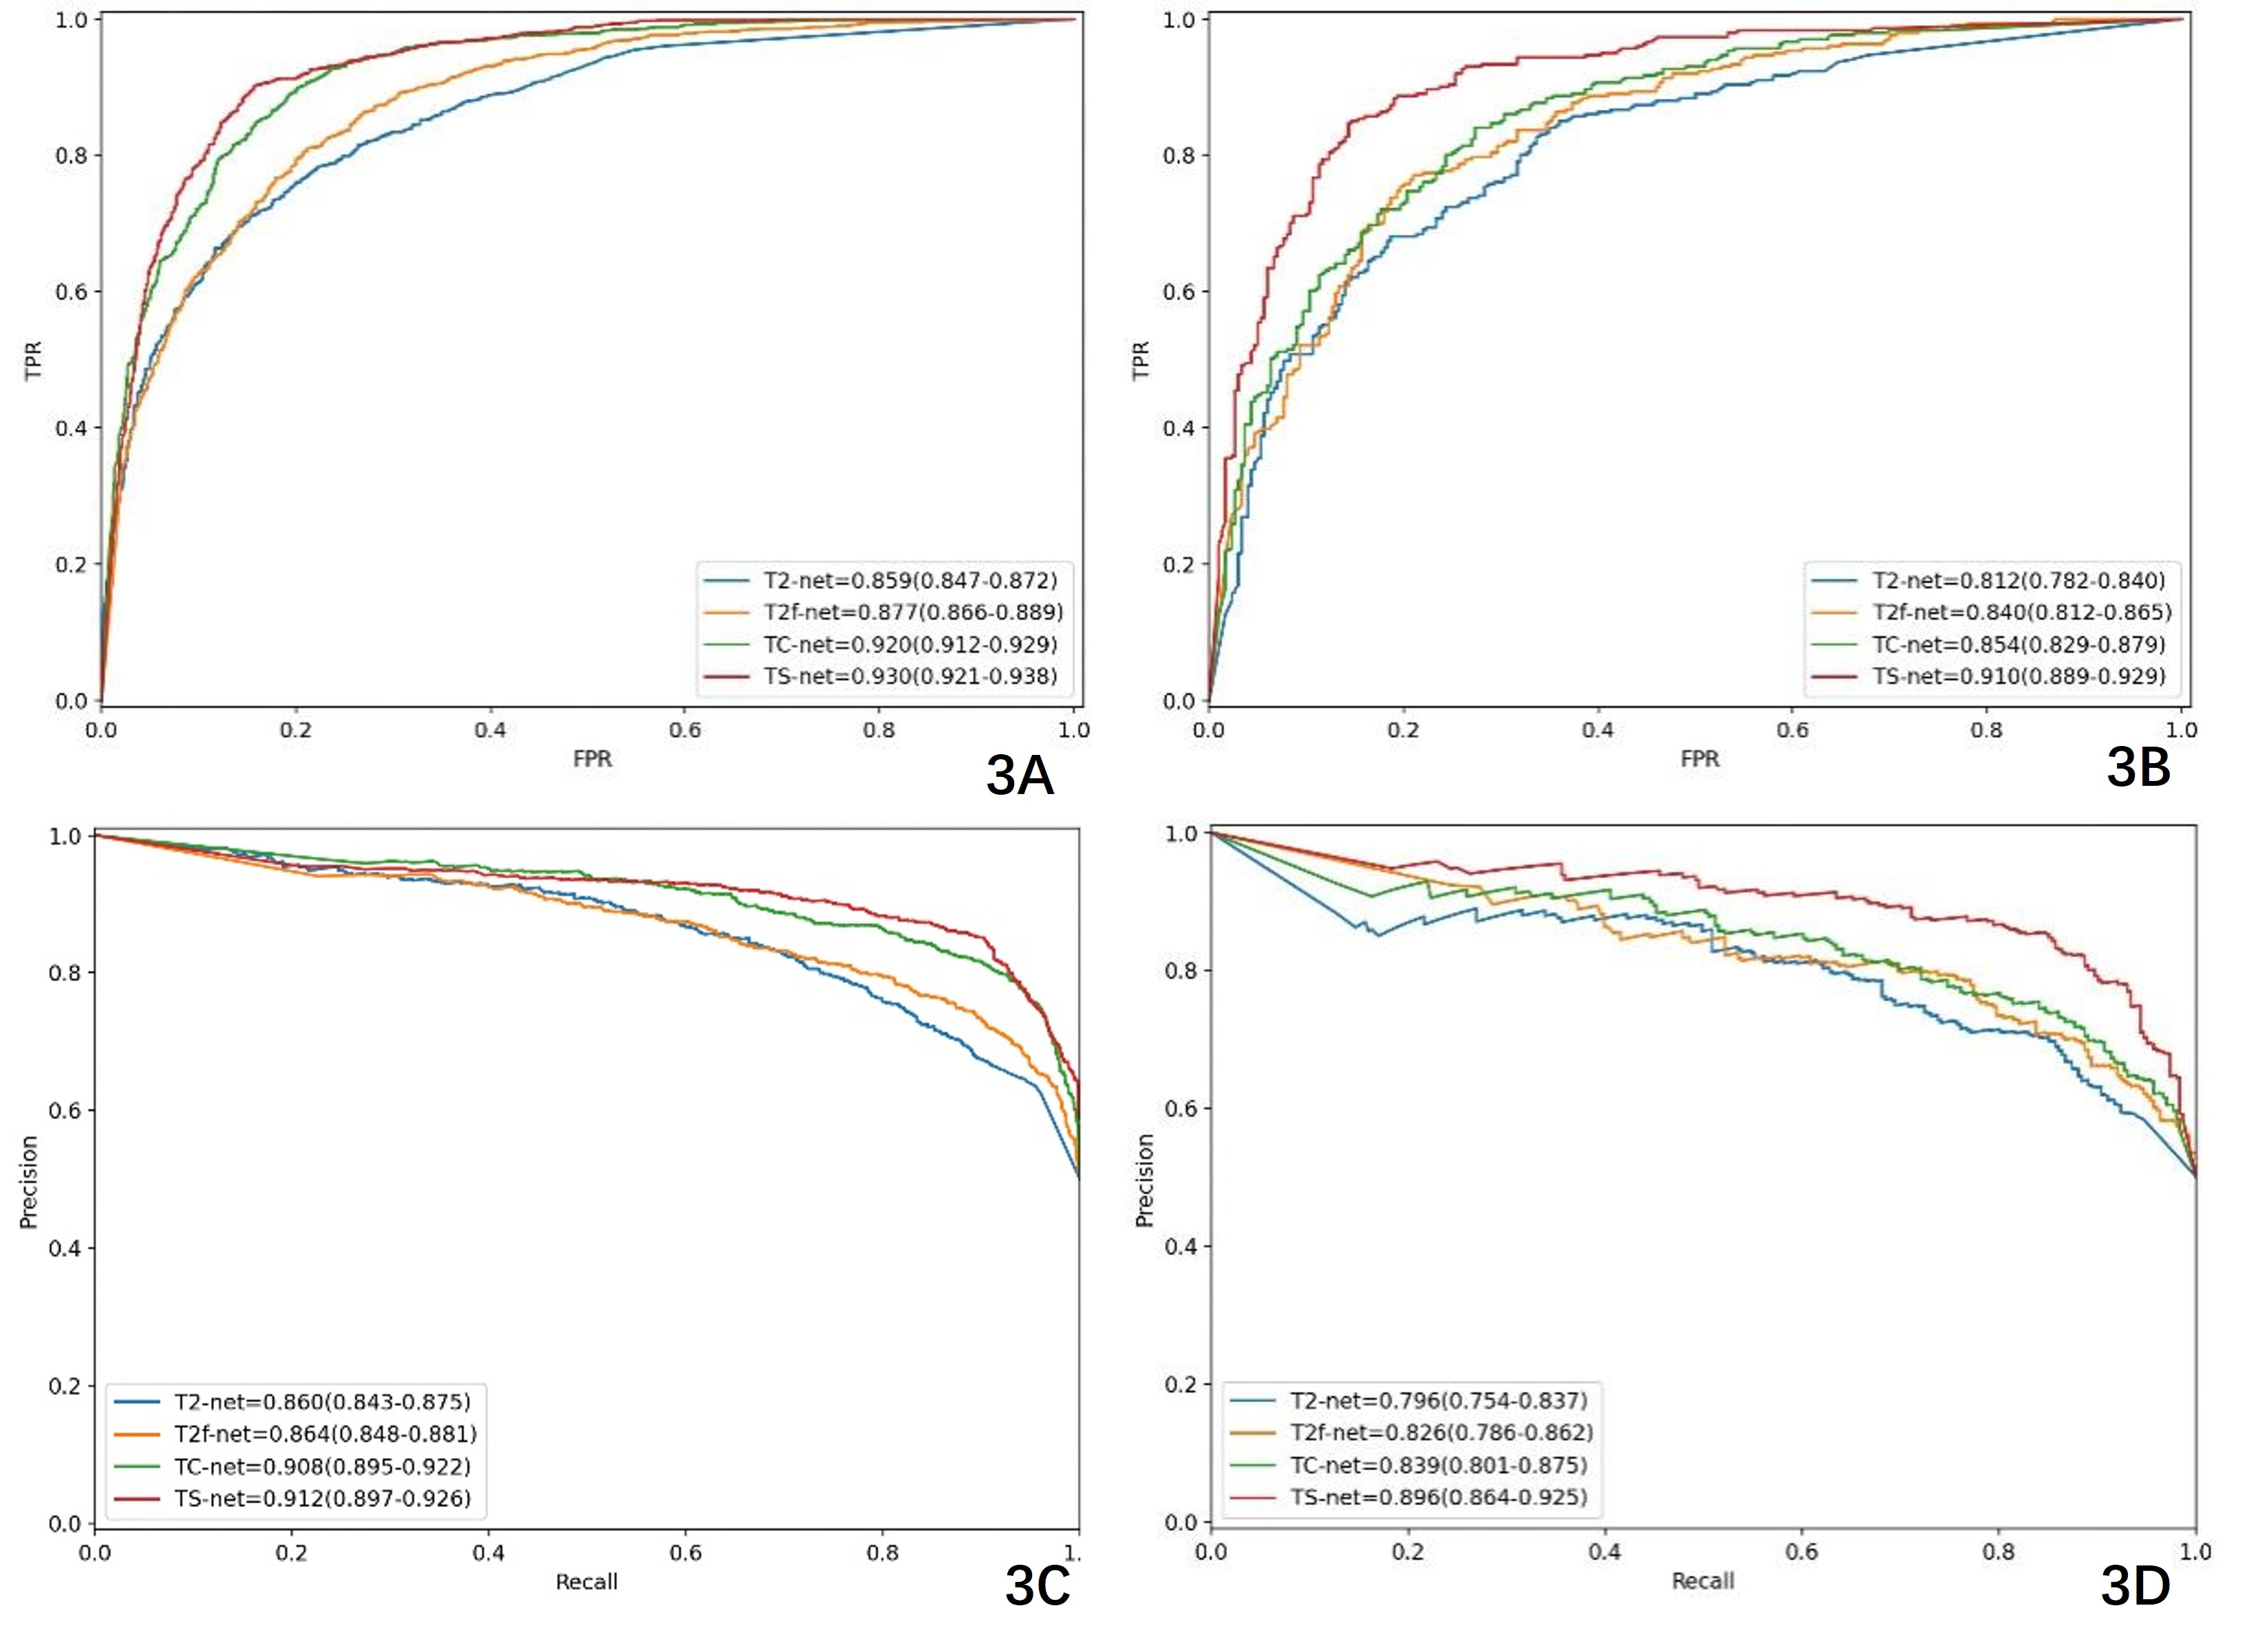
All four prediction models (T2-net, T2f-net, TC-net, and TS-net) had good prediction efficacy for determining the MGMT promoter methylation status in glioma patients. The AUROC values of TS-net were higher than those of T2-net, T2f-net, and TC-net (training set: 0.930 vs. 0.859, 0.877, 0.920; validation set: 0.910 vs. 0.812, 0.840, 0.854). The AUPRC values of TS-net were higher than those of T2-net, T2f-net, and TC-net (training set: 0.912 vs. 0.860, 0.864, 0.908; validation set: 0.896 vs. 0.796, 0.826, 0.839). The AUROC values of TS-net in the validation set were all higher than those of T2-net, T2f-net, and TC-net, and the differences were all statistically significant. In addition, the differences in the training set were statistically significant compared with T2-net and T2f-net (DeLong test, P < 0.05) (Figure 2, Table 2). The Gradient-weighted Class Activation Mapping(Grad-CAM)showed our ResNet34 models focus most on the tumor and surrounding areas, ignoring areas outside of ROI. Feature maps of models demonstrated that fused feature maps contain richer information compared to a single sequence (Figure 3).Discussion
An MGMT promoter methylation status confers a better prognosis and treatment response of gliomas, regardless of the histologic grade[5]. This study demonstrated that CNN models based on conventional MRI images can successfully predict the MGMT promoter methylation status. All the models showed excellent stability and repeatability in quantitatively predicting the molecular subtypes of gliomas. By fusing the features of T2-net, T2f-net, and TC-net, we were able to incorporate more information and improve the accuracy of the model. It is worth noting that deep learning models require a large amount of data to ensure stability and prevent overfitting. One limitation of this study is the relatively small number of lesions, and future studies with larger cohorts are needed to validate these findings.Conclusion
In conclusion, CNN models based on conventional MR imaging can be used to predict the MGMT promoter methylation status in gliomas.Acknowledgements
No acknowledgement found.References
[1] Molinaro A M, Taylor J W, Wiencke J K, et al. Genetic and molecular epidemiology of adult diffuse glioma[J]. Nature Reviews Neurology, 2019, 15(7): 405-417. [2] Louis D N, Perry A, Wesseling P, et al. The 2021 WHO classification of tumors of the central nervous system: a summary[J]. Neuro-oncology, 2021, 23(8): 1231-1251. [3] Ellingson B M, Cloughesy T F, Pope W B, et al. Anatomic localization of O6-methylguanine DNA methyltransferase (MGMT) promoter methylated and unmethylated tumors: a radiographic study in 358 de novo human glioblastomas[J]. Neuroimage, 2012, 59(2): 908-916. [4] Anwar S M, Majid M, Qayyum A, et al. Medical image analysis using convolutional neural networks: a review[J]. Journal of medical systems, 2018, 42: 1-13. [5] Yoon R G, Kim H S, Paik W, et al. Different diagnostic values of imaging parameters to predict pseudo-progression in glioblastoma subgroups stratified by MGMT promoter methylation[J]. European radiology, 2017, 27: 255-266.Figures