0865
Preoperative Prediction of Her2-zero, -low and -overexpression Breast Cancers Using Multiparametric MRI and Machine Learning Modeling1First affiliated hospital of Wenzhou Medical University, Wenzhou, China, 2University of California, Irvine, Irvine, CA, United States, 3Guangxi Normal University, Guilin, China, 4Wenzhou Medical University, Wenzhou, China, 5University of Ulsan College of Medicine, Gangneung Asan Hospital Gangwondo, Gangneung, Korea, Republic of
Synopsis
Keywords: Diagnosis/Prediction, Breast
Motivation: Her2-low breast cancers could benefit from new anti-HER2 therapies.
Goal(s): To construct a preoperative prediction model of HER2 expression levels using multiparametric MRI and machine learning (ML) algorithms.
Approach: 621 patients were investigated. Four ML methods were used to build models based on MRI features to predict HER2 expression levels.
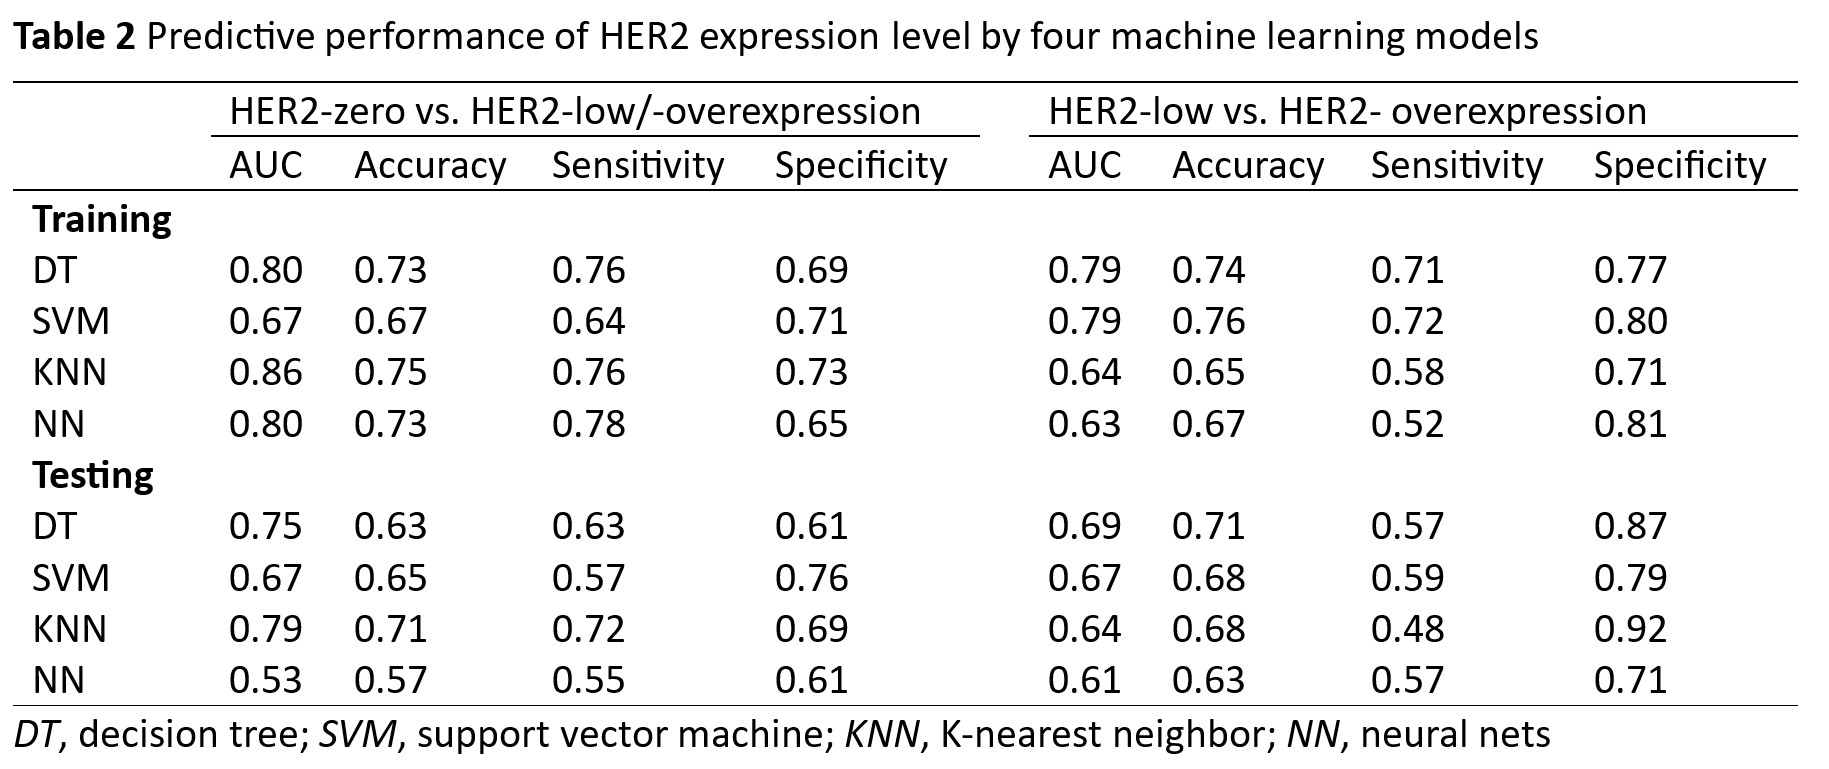
Results: MRI features of multiple lesions, spiculated margin, peritumoral edema and largest diameter were selected to build the models. ML models performed better for predicting HER2-zero vs. HER2-low/-overexpression than HER2-low vs. HER2-overexpression. The best model was KNN of AUC 0.86, sensitivity of 76%, specificity of 73%, and accuracy of 75%.
Impact: MRI features of breast cancer are associated with different HER2 expression levels. MRI-based ML models have the potential to preoperatively predict the HER2 expression status.
Introduction
HER2-targeted therapies have dramatically improved the prognosis of HER2-positive breast cancer (BC) patients. It has been confirmed that HER2 expression is not a binary but rather a continuous variable. Partial HER2-negative BCs express HER2, and HER2-low BC may benefit from novel HER2-targeted therapies. Therefore, the identification of HER2 expression level is essential in the selection of candidates of BC patients for anti-HER2 therapies. Different from the examination of tissue specimens of BC, which may be affected by the sampling bias, breast MRI can non-invasively provide comprehensive information about the entire BC. As artificial intelligence (AI) is applied in medical imaging, some previous studies have performed MRI-based radiomics to predict HER2-positive BC. Fowler’s results showed that MRI-based radiomics could be a potential tool for assessing HER2 expression level, and the accuracy could be high, up to 97.4%. In Zhou’s study, they reported that radiomics signatures based on multiparametric MRI (mpMRI) could distinguish HER2-positive from HER2-negative BC. In the last two years, several studies have focused on the prediction of HER2-low BC as well. Guo et al. constructed an MRI-based deep learning radiomics to identify HER2-low status and further predict the disease-free survival of HER2-low BC patients. Another study conducted at multiple centers also demonstrated that the radiomics signatures and tumor descriptors based on mpMRI may predict distinct HER2 expression levels. However, there is currently no mature application of AI in clinical practice, and experienced radiologists' readings are reported to outperform AI's performance. Therefore, the present study aimed to explore predictors of MRI reading features for HER2 status and construct MRI-based machine learning models assessing distinct HER2 expression levels, especially identifying HER2-low BC.Methods
Six hundred twenty-one patients pathologically confirmed with BC were retrospectively investigated, separating into training (488) and testing (133) datasets. HER2 expression level was identified by immunohistochemistry (IHC) or fluorescence in situ hybridization (FISH) examination according to the American Society of Clinical Oncology/College of American Pathologists (ASCO/CAP) 2018 guidelines. MRI features were reviewed by two radiologists in consensus and then verified by an experienced radiologist, including morphology as mass or non-mass enhancement (NME), shape, margin, number of lesions, internal enhancement pattern (IEP), peritumoral edema, ADC value, largest diameter on MRI, DCE kinetic curve, suspicious invasion of adjacent tissue, BI-RADS category. The predictors of distinct HER2 expression were identified by multivariable analysis and used to construct the predictive model by machine learning algorithms, including Decision Tree (DT), Support Vector Machine (SVM), K-nearest Neighbor (KNN) and Neural Nets (NN).Results
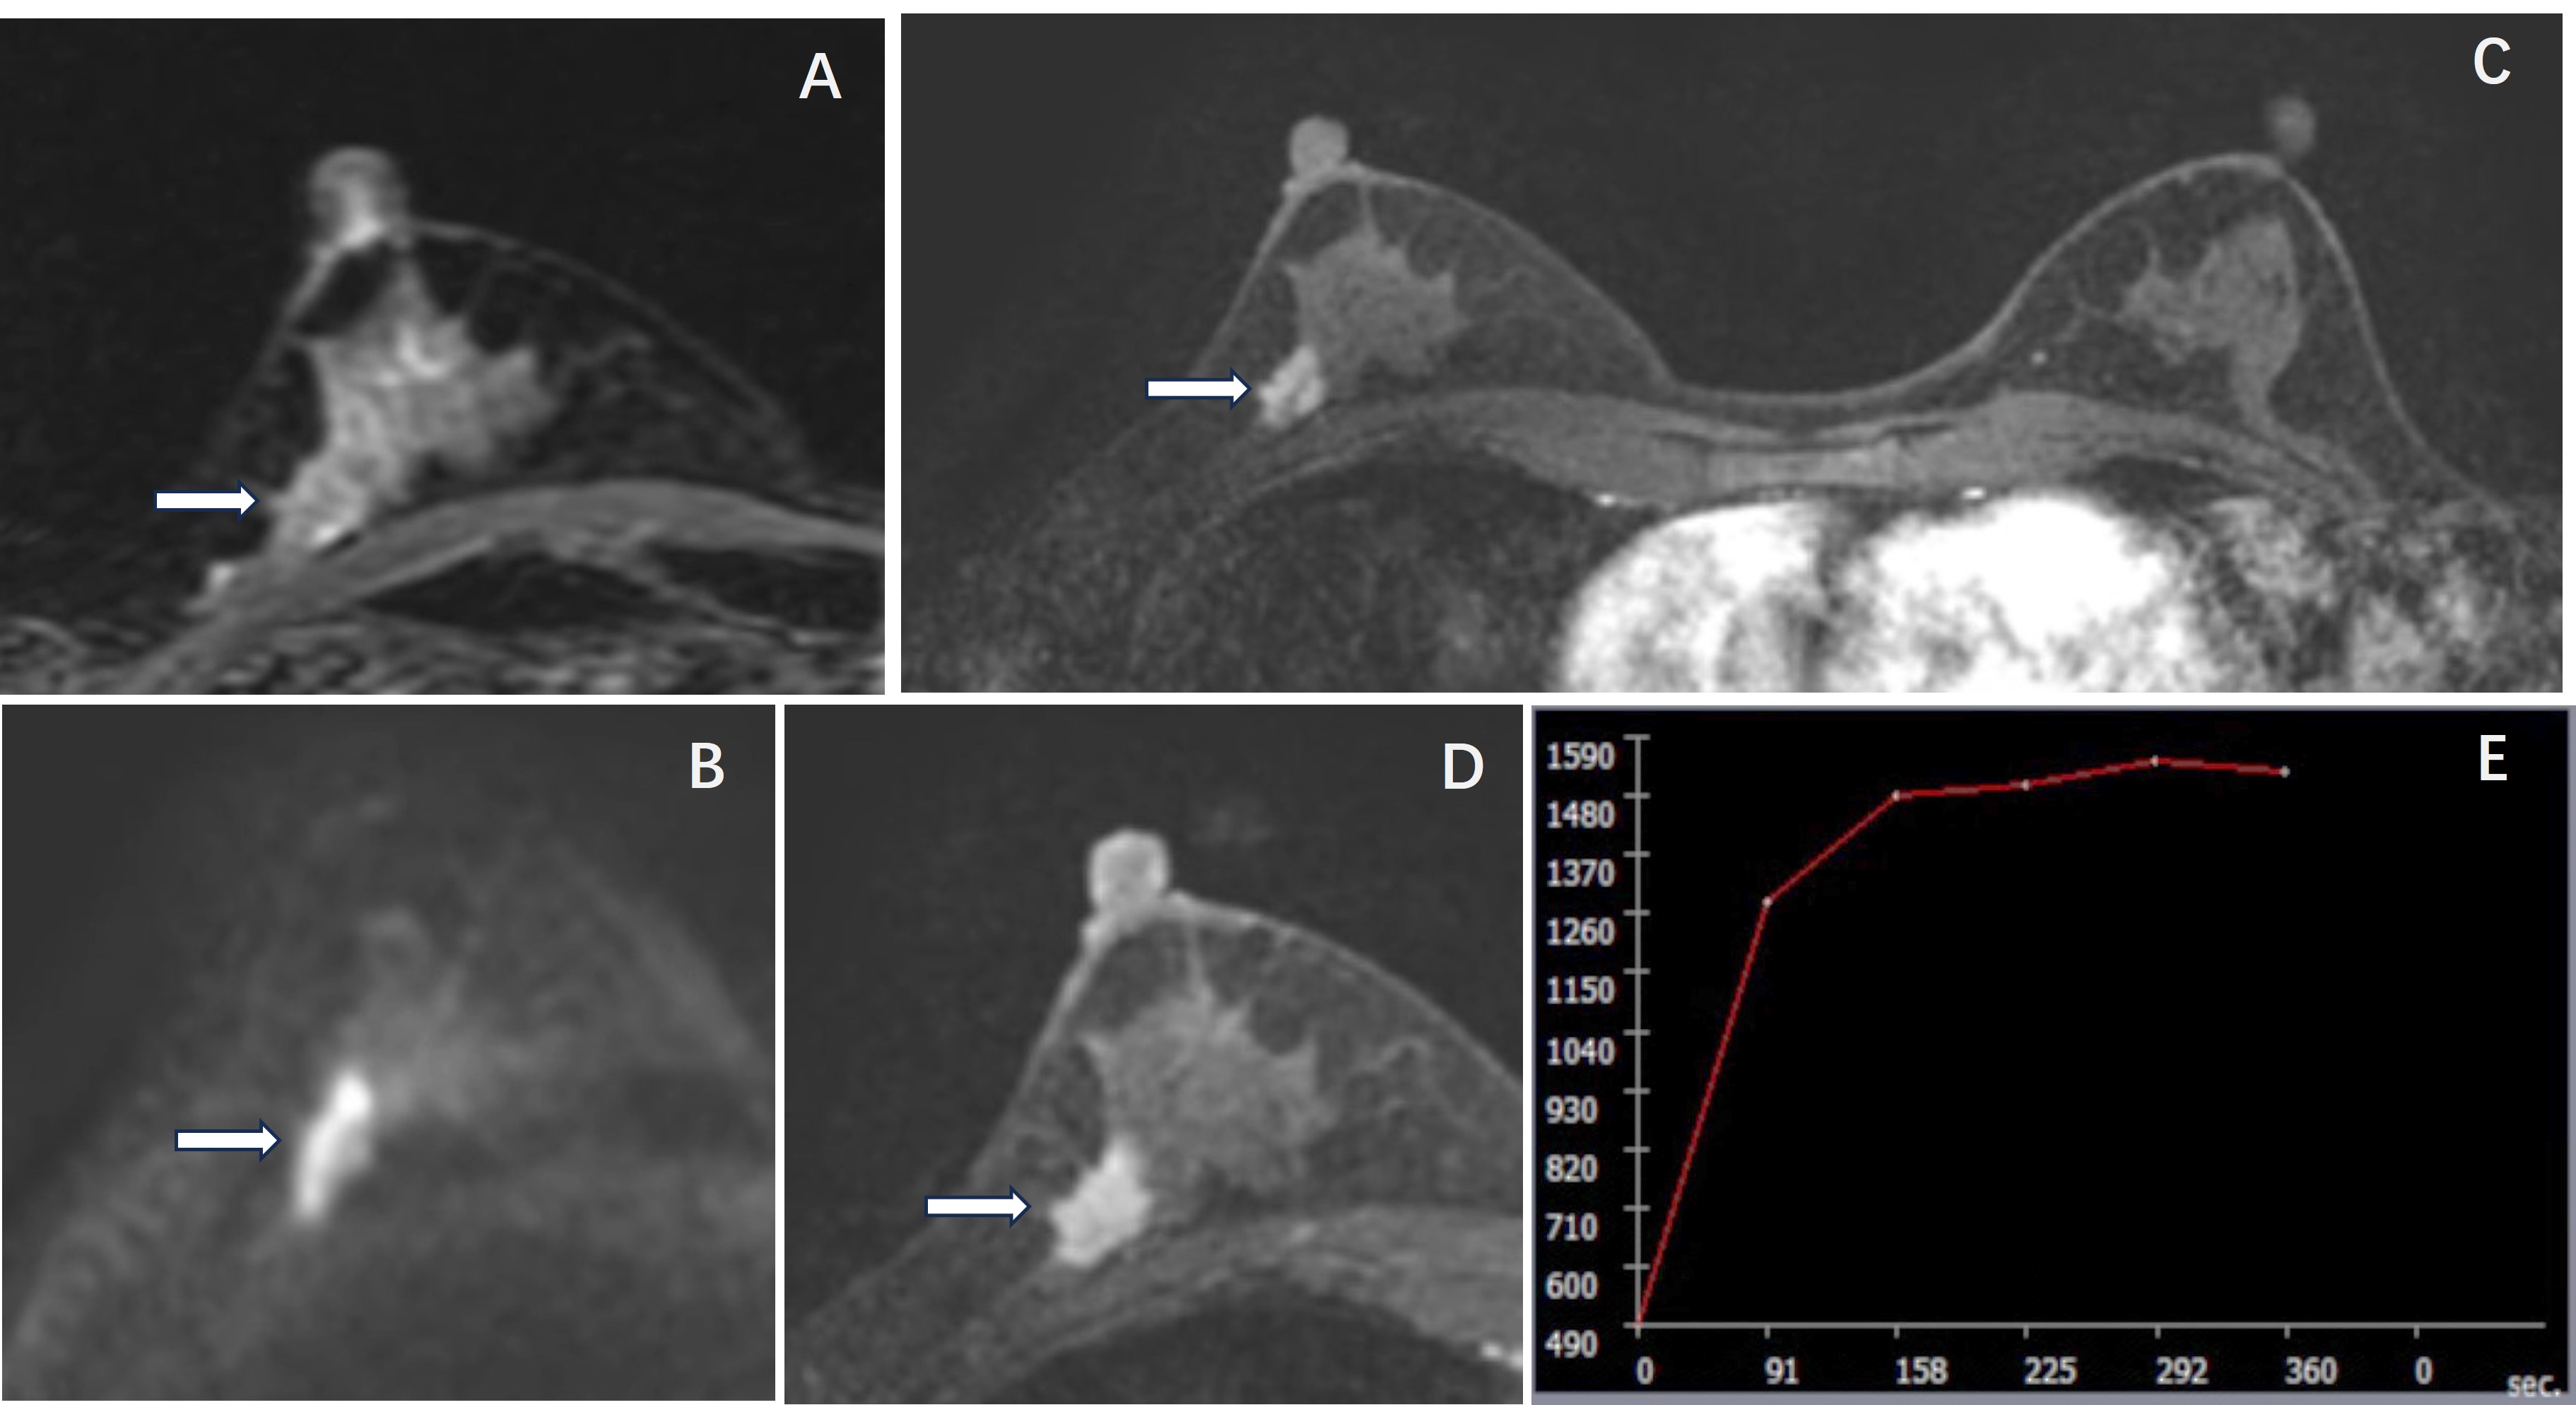
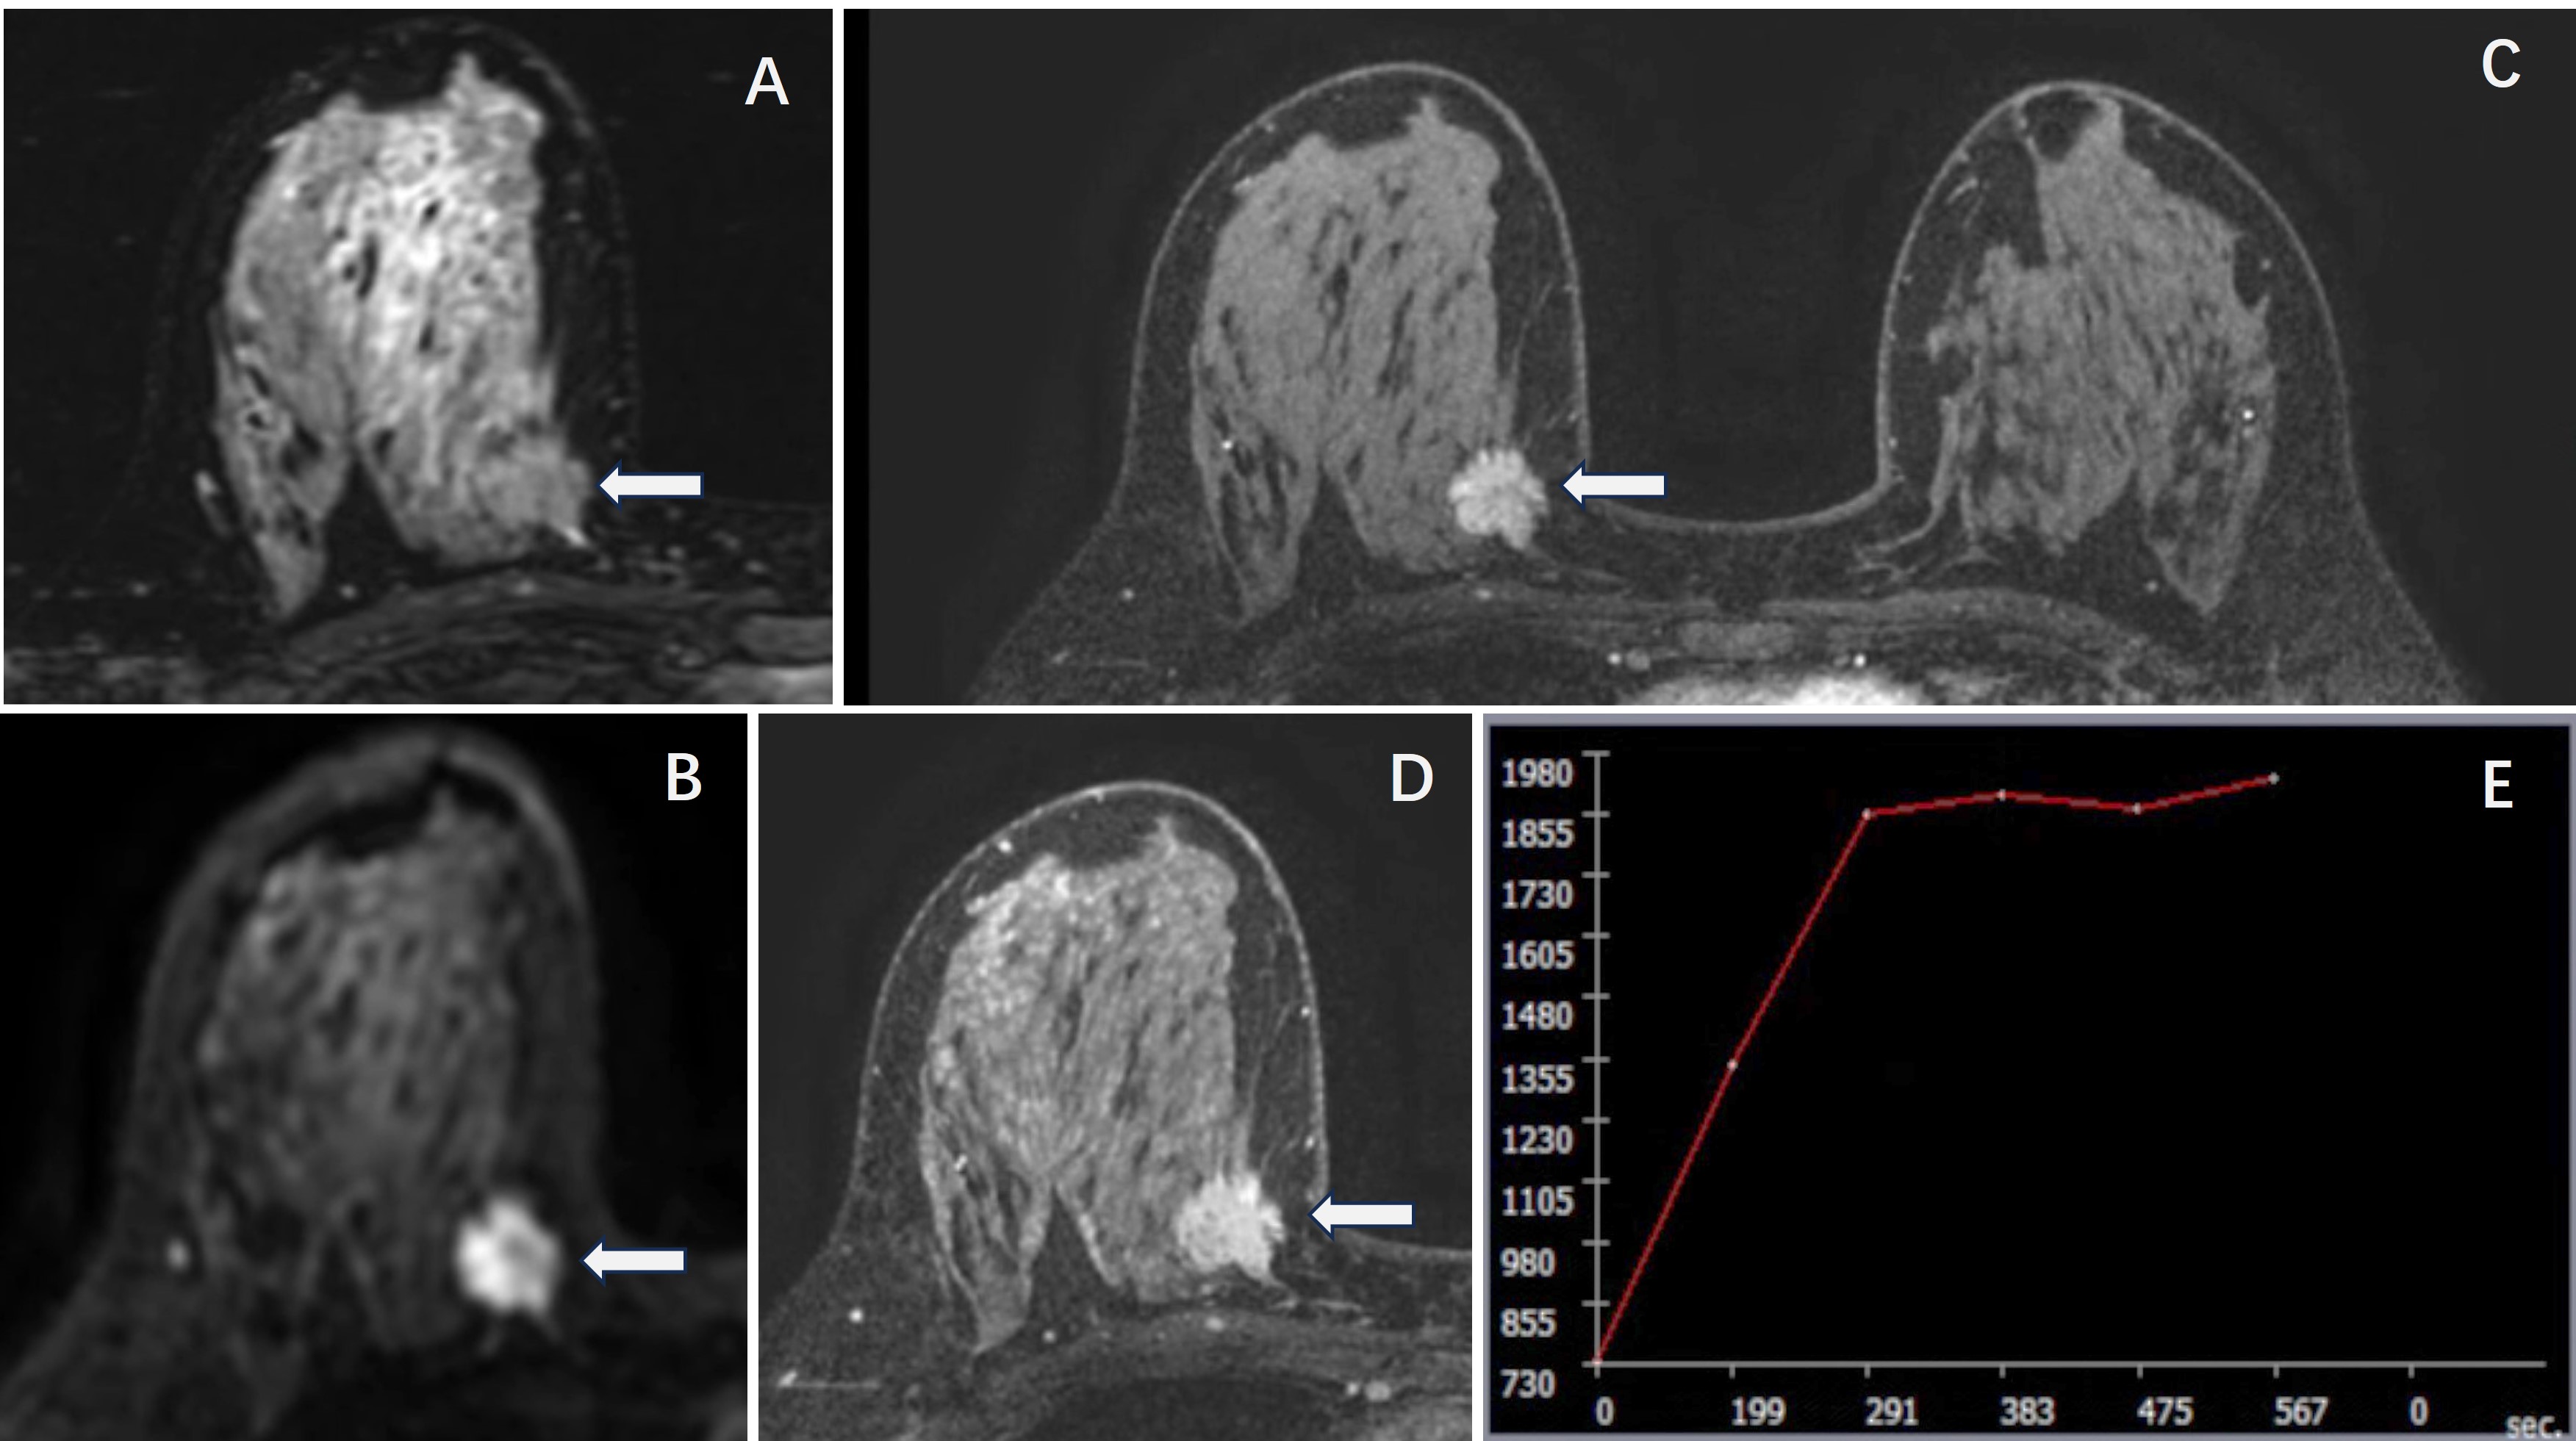
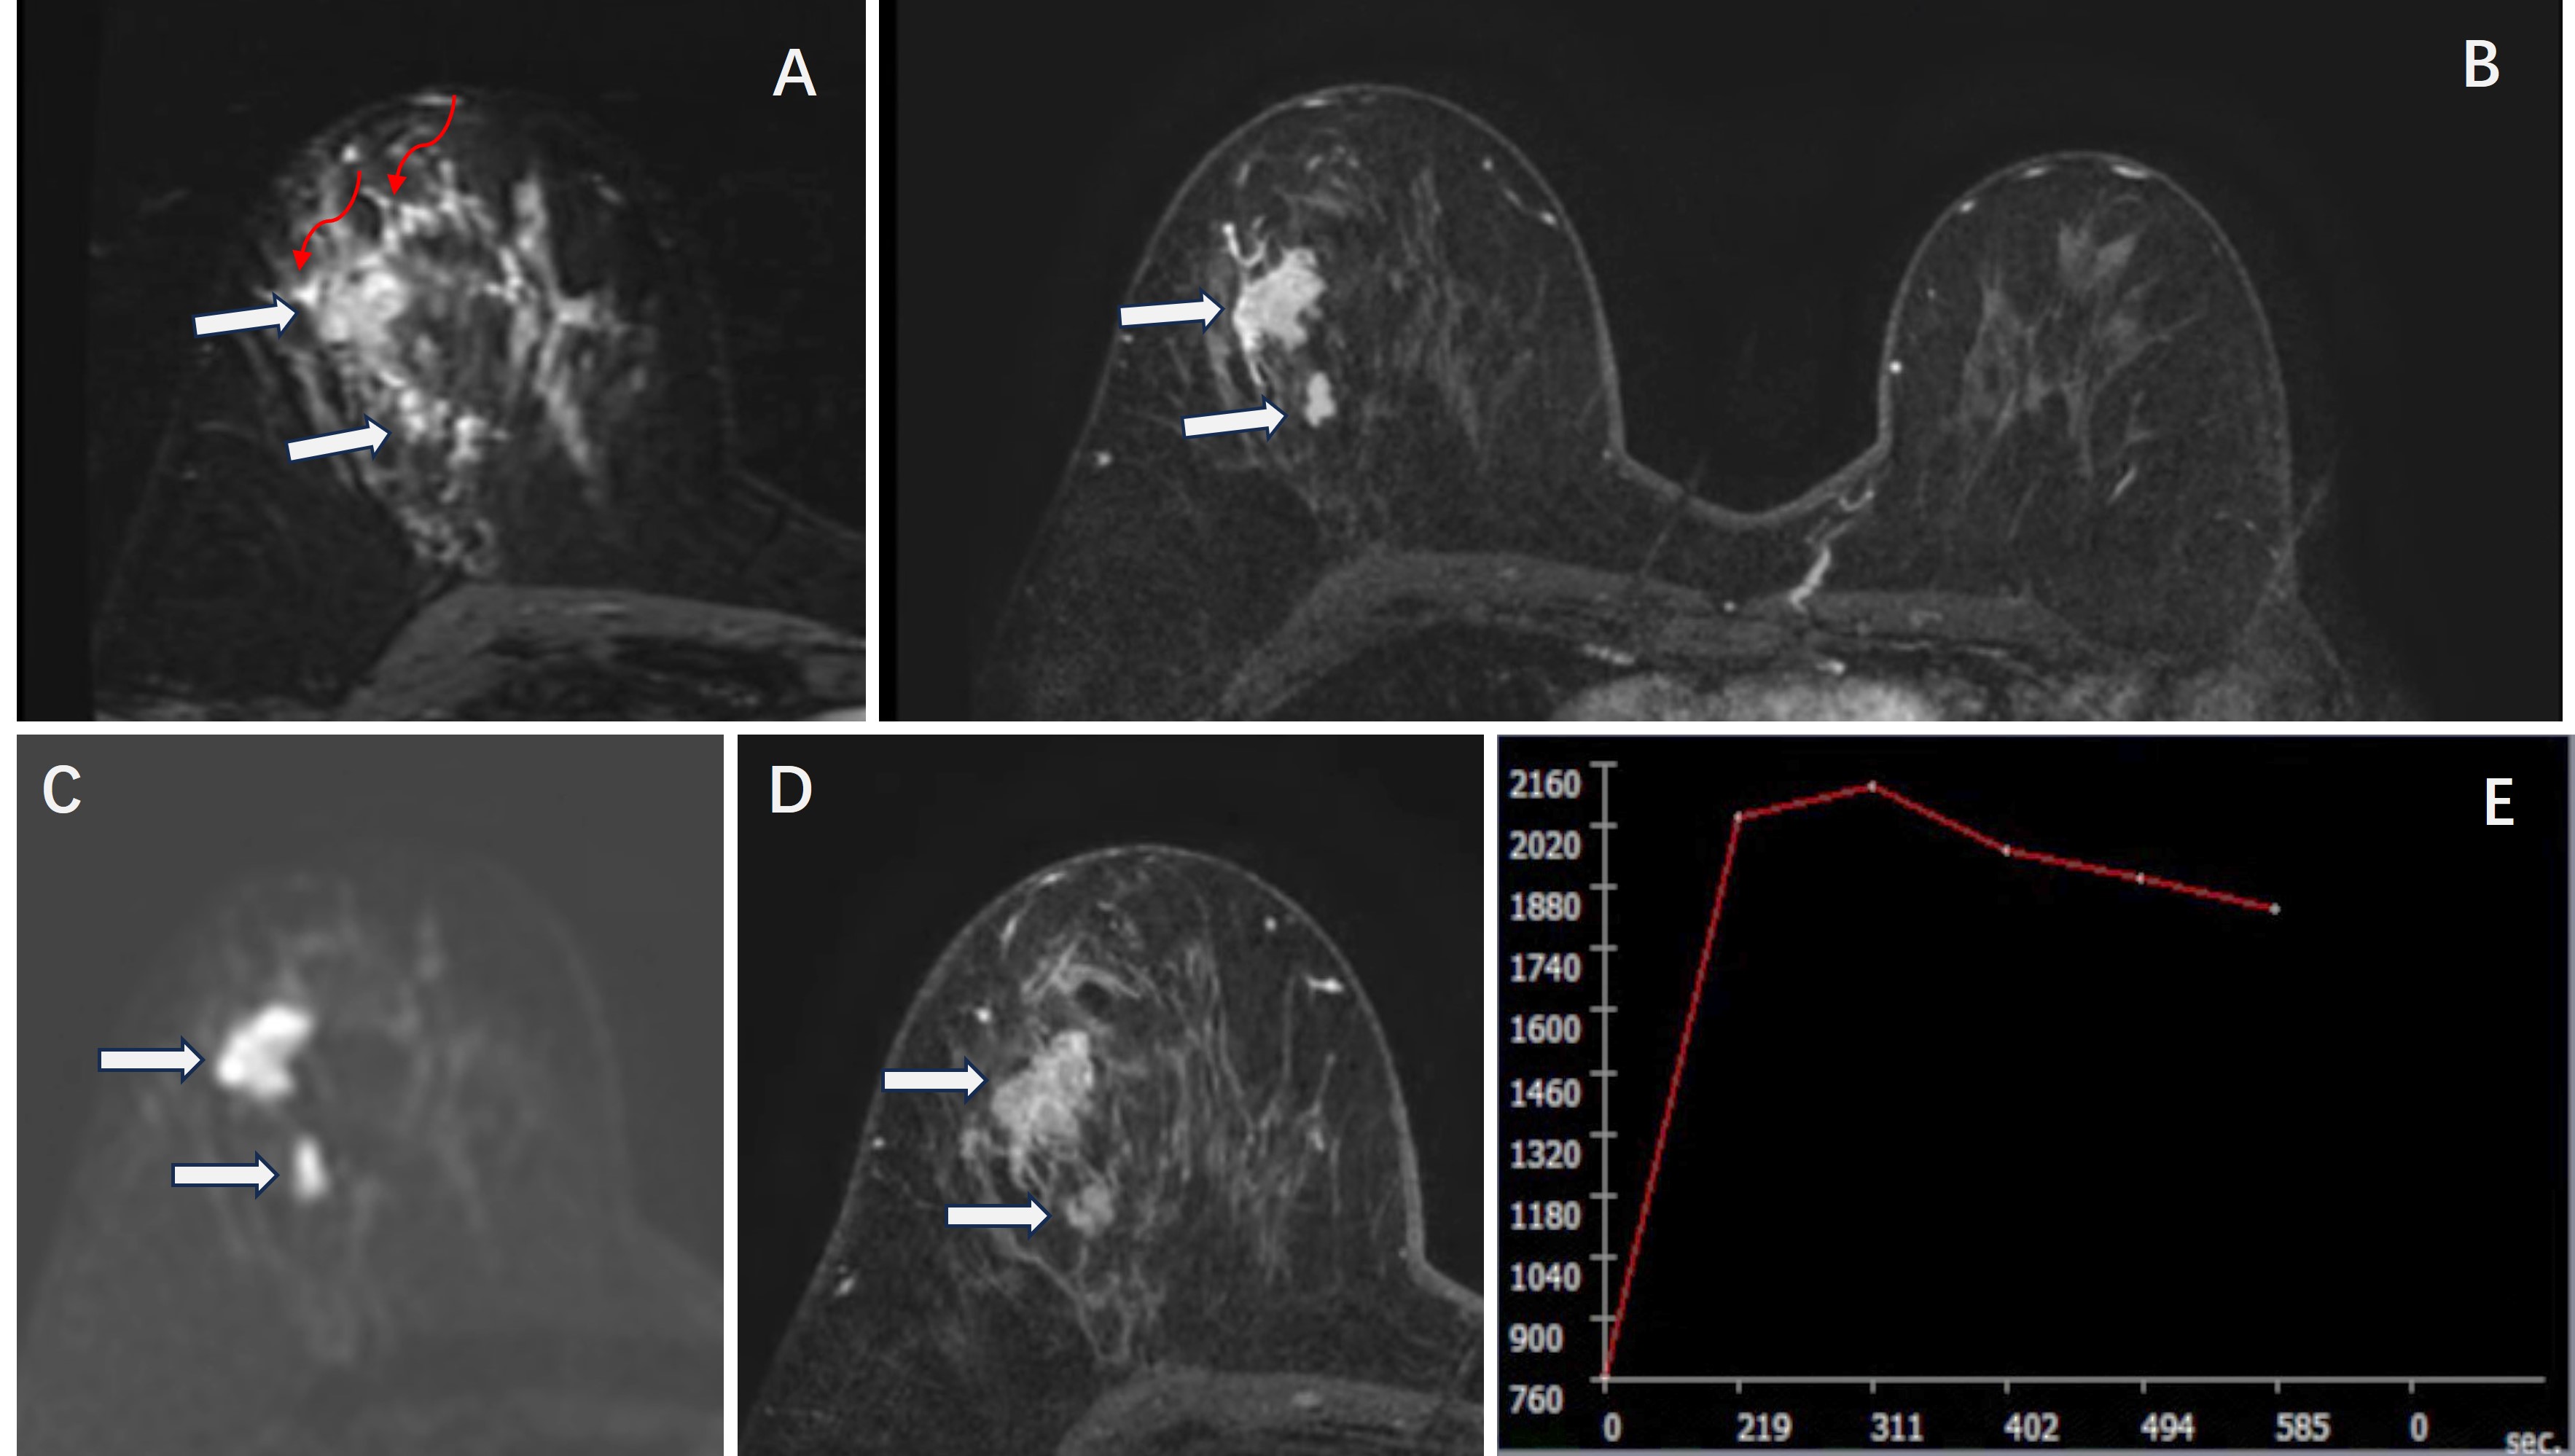
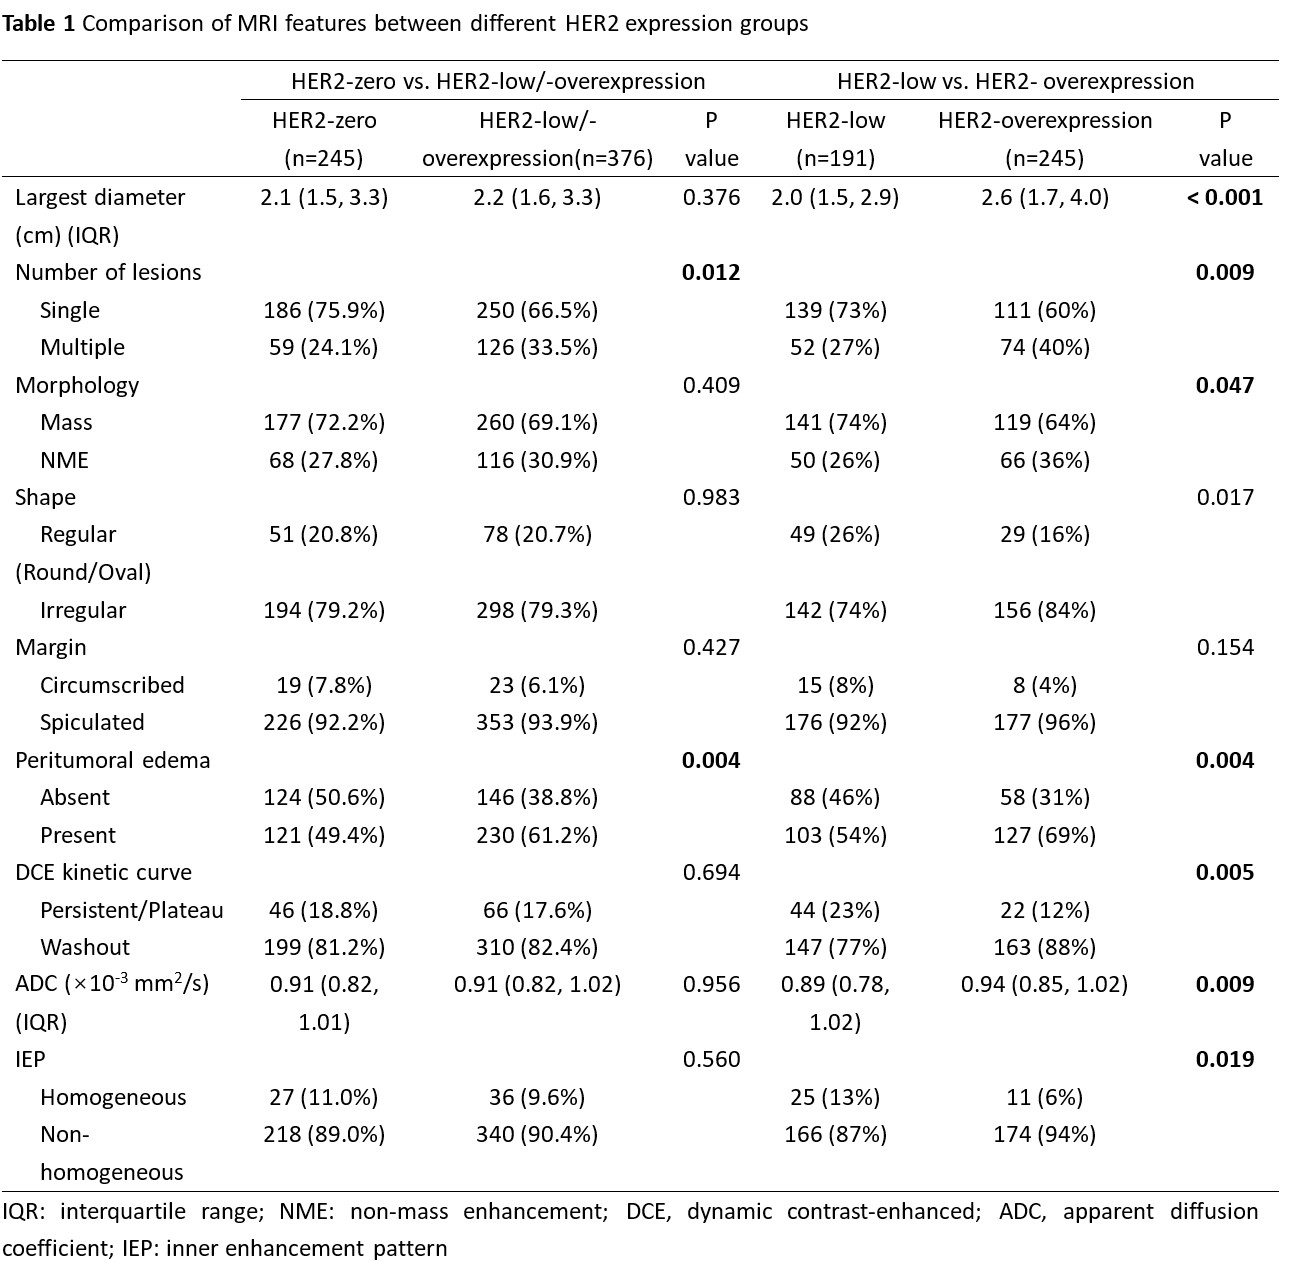
In the training data, there were 194 HER2-zero, 153 HER2-low, and 141 HER2-overexpression BCs, and in testing data, the number was 51, 38, and 44, respectively. The results of univariable analysis are summarized in Table 1. For the prediction of HER2-zero vs HER2-low and -overexpression, multiple lesions, peritumoral edema, spiculated margin and largest diameter were selected to build models. DT, KNN, and NN had comparable AUC in the range of 0.80-0.86, better than SVM, which was 0.67 (Table 2). KNN showed the best predictive performance in training and testing datasets, with AUC 0.86 (95%CI 0.82-0.90) and 0.79 (95%CI 0.71-0.87), respectively. For the prediction of HER2-low vs. HER2-- overexpression, multiple lesions, peritumoral edema, and spiculated margin were included in the models. DT and SVM performed better than KNN and NN, and the best AUC was 0.79 (95%CI 0.72-0.80) for SVM, with a sensitivity of 0.72, specificity of 0.80, and accuracy of 0.76 (Table 2). Three cases with different HER2 status are shown in Figure 1-3.Discussion
HER2-low BC has emerged as a clinical entity potentially targetable by new anti-HER2 medicine. Approximately 50% of BCs show HER2-low expression. Identifying those candidates may dramatically improve their outcomes. The present study showed MRI features of multiple lesions, peritumoral edema, spiculated margin, and largest diameter, which could be valuable predictors of HER2 expression. Then, these selected features were constructed using ML algorithms to build predictive models, and four ML models showed decent performance. For the prediction of HER2-zero vs HER2-low and -overexpression, KNN presented the best performance with AUC 0.86 (95%CI 0.82-0.90), sensitivity 76%, specificity 0.73% and accuracy 75%, which was 0.79 (95%CI 0.71-0.87), 72%, 69% and 71%, respectively, in testing data. In identifying HER2-low from HER2-overexpression BC of training data, DT and SVM showed comparable performance, and the AUC, sensitivity, specificity and accuracy of SVM were 0.79 (95%CI 0.75-0.84), 72%, 80% and 76%, respectively, and it was 0.67 (95%CI 0.56-0.78), 59%, 79%, and 68%, respectively. In conclusion, the mpMRI-based ML model showed the potential in preoperatively predicting HER2-zero vs HER2-low and -overexpression and HER2-lowAcknowledgements
This study was supported in part by Research Incubation Project of First Affiliated Hospital of Wenzhou Medical University (No. FHY2019085), Wenzhou Science & Technology Bureau (No. Y20210232), Zhejiang Provincial Natural Science Foundation of China (LY21F020030) and Key Laboratory of Intelligent Medical Imaging of Wenzhou (No. 2021HZSY0057).References
[1]. Roy A, Kumarasamy V, Dhakal A, et al. A review of treatment options in HER2‐low breast cancer and proposed treatment sequencing algorithm. Cancer. 2023;129(18):2773-278.
[2]. Won H, Ahn J, Kim Y, et al. Clinical significance of HER2-low expression in early breast cancer: a nationwide study from the Korean Breast Cancer Society. Breast Cancer Res. 2022;21;24(1):22.
[3]. Tarantino P, Hamilton E, Tolaney SM, et al. HER2‐low breast cancer: pathological and clinical landscape. J Clin Oncol. 2020;38(17):1951‐1962.
[4]. Fowler AM, Mankoff DA, Joe BN. Imaging neoadjuvant therapy response in breast cancer. Radiology. 2017;285(2):358–75.
[5]. Zhou J, Tan H, Li W, et al. Radiomics Signatures Based on Multiparametric MRI for the Preoperative Prediction of the HER2 Status of Patients with Breast Cancer. Acad Radiol. 2021;28(10):1352-1360.
[6]. Park V. Expanding applications of MRI-based radiomics in HER2-positive breast cancer. EBioMedicine. 2020:61:103085.
[7]. Guo Y, Xie X, Tang W, et al. Noninvasive identification of HER2-low-positive status by MRI-based deep learning radiomics predicts the disease-free survival of patients with breast cancer. Eur Radiol . 2023 Aug 19. doi: 10.1007/s00330-023-09990-6. Online ahead of print.
[8]. Ramtohul T, Djerroudi L, Lissavalid E, et al. Multiparametric MRI and Radiomics for the Prediction of HER2-Zero, -Low, and -Positive Breast Cancers. Radiology. 2023;308(2):e222646.
[9]. Mao C, Hu L, Jiang W, et al. Discrimination between human epidermal growth factor receptor 2 (HER2)-low-expressing and HER2-overexpressing breast cancers: a comparative study of for MRI diffusion models. Eur Radiol. 2023 Sep 6. doi: 10.1007/s00330-023-10198-x. Online ahead of print.
Figures