0863
Explaining MRI radiomics-based detection of prostate cancer using clinical concepts1Department of Circulation and Medical Imaging, NTNU, Norwegian University of Science and Technology, Trondheim, Norway, 2Department of Radiology and Nuclear Medicine, St. Olavs Hospital, Trondheim University Hospital, Trondheim, Norway
Synopsis
Keywords: Diagnosis/Prediction, Radiomics, Explainability, Analysis/Processing, Cancer, Diagnosis/Prediction, Machine Learning/Artificial Intelligence, Prostate, Software Tools
Motivation: Clinical use of computer-aided diagnosis systems for prostate cancer is currently hindered by their internal complexity. Explainability tools can give insight into the functioning of these machine learning (ML) models.
Goal(s): Our goal was to supplement the predictions of an MRI radiomics-based ML model for prostate cancer detection with explanations based on clinical concepts currently used in radiological assessment.
Approach: We clustered correlating MRI radiomics features into groups representing clinical concepts underlying the PI-RADS system. We used SHAP analysis to explain the importance of these concepts in each predicted lesion.
Results: Explainability based on clinical concepts gives insight into ML model predictions.
Impact: Our machine learning pipeline combines accurate prostate cancer detection on MRI with intrinsic explainability, potentially resulting in an easier integration into clinical use.
Introduction
Magnetic resonance imaging (MRI) is a valuable tool to non-invasively distinguish between indolent and clinically significant prostate cancer (csPCa), identifying patients who require a biopsy for definitive diagnosis1,2.Prostate MR images are interpreted by radiologists using the PI-RADS scale to describe the likelihood of csPCa2,3. However, human interpretation of medical images is time-consuming and dependent on experience and training, leading to high inter-observer variability and sometimes poor diagnostic accuracy. Computer-aided detection (CAD) systems for prostate cancer emerged with the intent to support and complement radiologists in MRI analysis1,4-6.
We previously developed a radiomic-based machine learning (ML) system intended as a support tool in the detection of potential csPCa lesions for targeted biopsy sampling7. The algorithm consists of an Xtreme Gradient Boosting (XGBoost) classifier, which is fed with voxel-wise radiomic features extracted from biparametric MRI (bpMRI). It achieved an area under the receiver-operating characteristic curve (AUC) of 91% on an external, unseen test set7.
The underlying radiomics features have a precise mathematical meaning, making the model theoretically explainable, for example using the SHAP method8. However, many features are calculated, some are heavily correlated, and most do not reflect the terminology used by radiologists. The aim of this study is to explain the ML model decisions using clinical concepts underlying the PI-RADS system.
Methods
DatasetsWe used the same bpMRI datasets that were used to train and evaluate the ML algorithm in 7 (Figure 1).
Clinical concept groups
137 radiomics features (Figure 2) were voxel-wise extracted using a sliding window (Pyradiomics9) and averaged over each ground truth lesion in the training set. Subsequently, we computed correlation matrices to analyse the relation between the features, separately considering the features calculated on T2-weighted (T2W), high b-value (HBV), and apparent diffusion coefficient (ADC) images. Hierarchical clustering (dendrogram tree cut height 7, 3 and 2, respectively for the T2W, HBV and ADC case) based on the distance matrix (defined as $$$1-abs(correlationMatrix)$$$) was performed to group features with strong absolute correlation into several clinical concept groups.
Model explainability
For each predicted lesion in the test set, the importance of the clinical concepts was calculated as follows: first, the voxel-level SHAP values for all individual features were calculated. Subsequently, these were summed according to clinical concept groups. Finally, the lesion-level importance of each clinical concept was calculated as the mean SHAP value over all the detected voxels in the lesion. The importance of clinical concepts was compared between true positive (TP), false positive (FP) and false negative (FN) predictions.
Results
We identified 7 feature groups representative of different clinical concepts: T2W, HBV and ADC intensity, T2W, HBV, ADC heterogeneity, and lesion position (Figure 3).Figure 4 shows which clinical concepts contributed to the prediction results of single lesions (left column) and overall (right column). ADC intensity was the most important concept to correctly classify lesions as csPCa (TP). The position of the lesion is a primary factor contributing to FP predictions, although it substantially contributes across all lesion categories. In contrast, heterogeneity features from HBV and ADC images do not seem to influence model predictions much.
Discussion
The prevalent criticism directed at explainability methods linked to deep learning models is that they often provide only a semblance of transparency10,11. In contrast, our ML model is based on intrinsically explainable features from a mathematical perspective, but not from a clinical perspective. This study is a first step toward elucidating which clinical concepts are leveraged by the model in its decision-making process.Although our preliminary results are encouraging, it is important to acknowledge that the evaluation of this tool is challenging in the absence of a ground truth for its explainability. Further research is necessary to validate the defined clinical concept groups, e.g., using digital phantoms or in comparison to radiologist descriptions. Other interesting topics include correlation to cancer aggressiveness and the use of this tool for model optimization.
Conclusion
Explainability based on clinical concepts gives insight into ML-based csPCa detection on MR images, but further validation is required.Acknowledgements
No acknowledgement found.References
1 Sunoqrot, M. R. S., Saha, A., Hosseinzadeh, M., Elschot, M. & Huisman, H. Artificial intelligence for prostate MRI: open datasets, available applications, and grand challenges. European radiology experimental 6, 1-13 (2022). https://doi.org:10.1186/s41747-022-00288-8
2 Barentsz, J. O. et al. ESUR prostate MR guidelines 2012. Eur Radiol 22, 746-757 (2012). https://doi.org:10.1007/s00330-011-2377-y
3 Barentsz, J. O. et al. Synopsis of the PI-RADS v2 Guidelines for Multiparametric Prostate Magnetic Resonance Imaging and Recommendations for Use. Eur Urol 69, 41-49 (2015). https://doi.org:10.1016/j.eururo.2015.08.038
4 Sun, Y. et al. Multiparametric MRI and radiomics in prostate cancer: a review. Australas Phys Eng Sci Med 42, 3-25 (2019). https://doi.org:10.1007/s13246-019-00730-z
5 Cuocolo, R. et al. Machine learning applications in prostate cancer magnetic resonance imaging. Eur Radiol Exp 3, 35-38 (2019). https://doi.org:10.1186/s41747-019-0109-2
6 Yasaka, K., Akai, H., Kunimatsu, A., Kiryu, S. & Abe, O. Deep learning with convolutional neural network in radiology. Jpn J Radiol 36, 257-272 (2018). https://doi.org:10.1007/s11604-018-0726-3
7 Nketiah, G. A. et al. Radiomics-based Machine Learning for Predicting Clinically Significant Cancer in Multicenter Cohort: Comparison to PI-RADS Reading. ISMRM & ISMRT Annual Meeting and Exhibition (Toronto (CA), 2023).
8 Lundberg, S. & Lee, S.-I. A Unified Approach to Interpreting Model Predictions. (2017).
9 Pyradiomics documentation, <https://pyradiomics.readthedocs.io/en/latest/index.html> (
10 Ghassemi, M., Oakden-Rayner, L. & Beam, A. L. The false hope of current approaches to explainable artificial intelligence in health care. Lancet Digit Health 3, e745-e750 (2021). https://doi.org:10.1016/S2589-7500(21)00208-9
11 Kostick-Quenet, K. M. & Gerke, S. AI in the hands of imperfect users. NPJ Digit Med 5, 197-197 (2022). https://doi.org:10.1038/s41746-022-00737-z
Figures
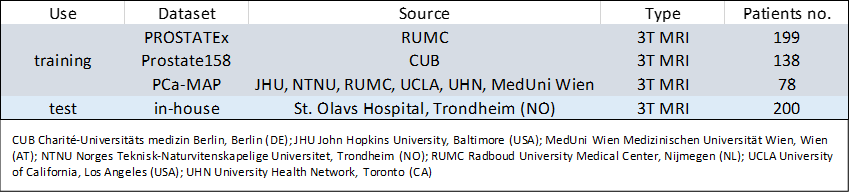
Figure 1: Datasets overview. The 415 cases constituting the training set were used to train the in-house developed ML model7 and for constructing the clinical concept groups. The 200 cases constituting the test set were used to evaluate the performance of the ML model7 and to investigate the explainability of clinical concepts in this study.
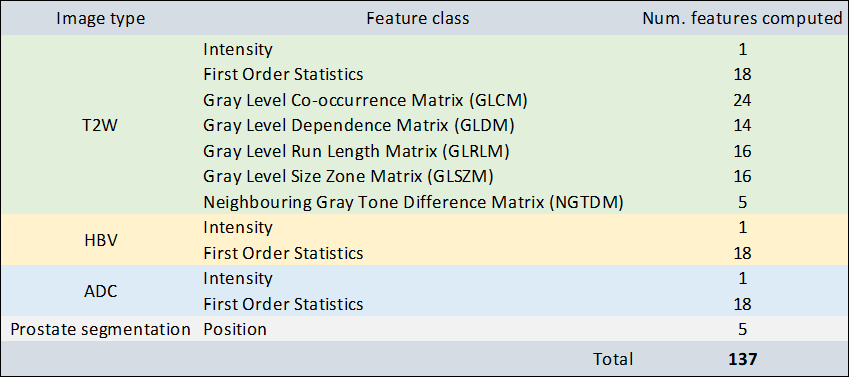
Figure 2: Radiomics features extracted for the ML model. All features were extracted using the Pyradiomics toolkit9 with a 2-dimensional 5 x 5 sliding window approach, except Intensity (which represents the raw voxel intensity) and Position features (which were calculated with custom code7).
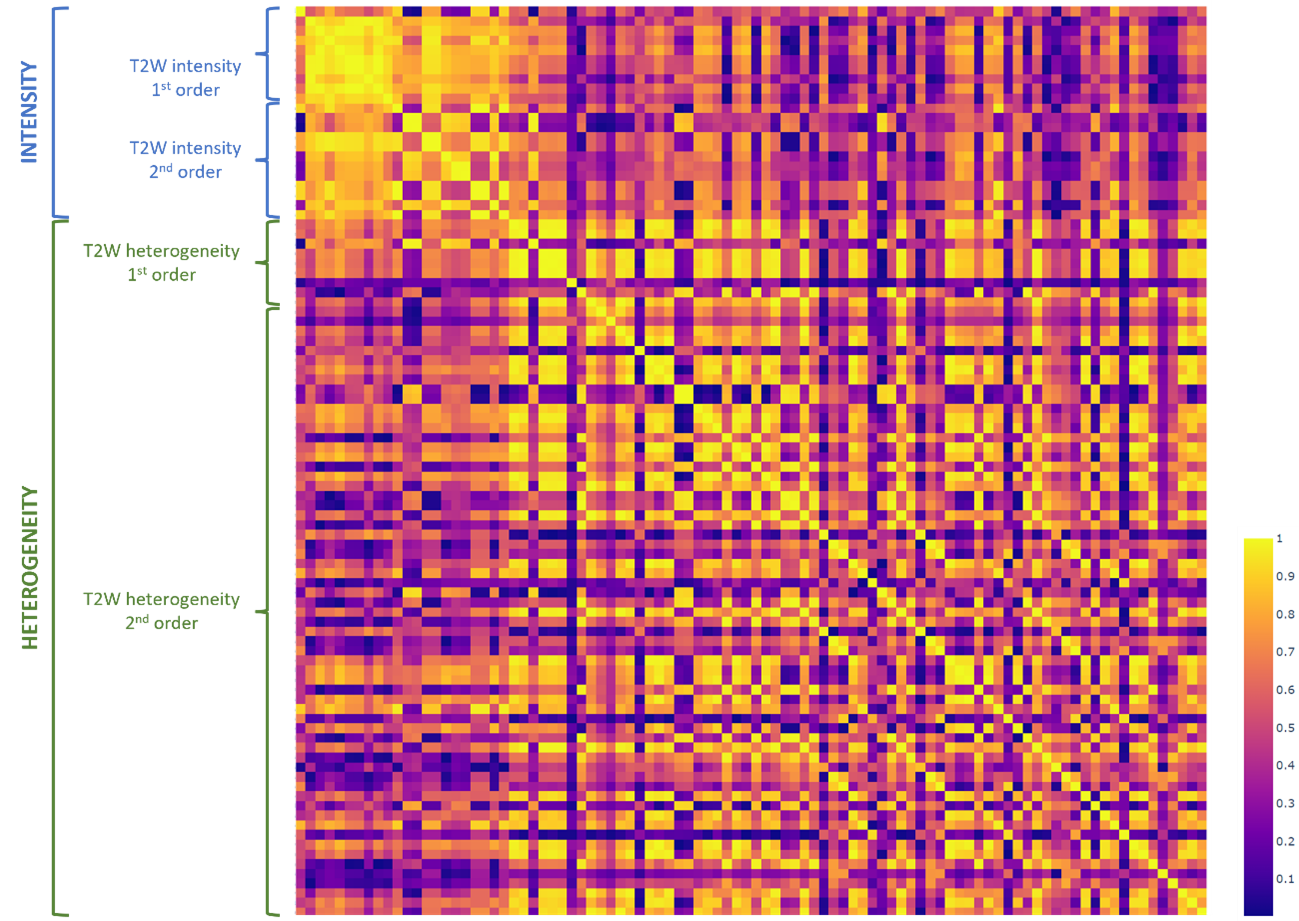
Figure 3: Absolute correlation matrix for the T2W features computed on the training set. For the HBV and ADC images only 1st order features were computed and correlated. The same 1st order features ended up in the intensity and heterogeneity concepts for all image types. The position features were regarded a separate group.
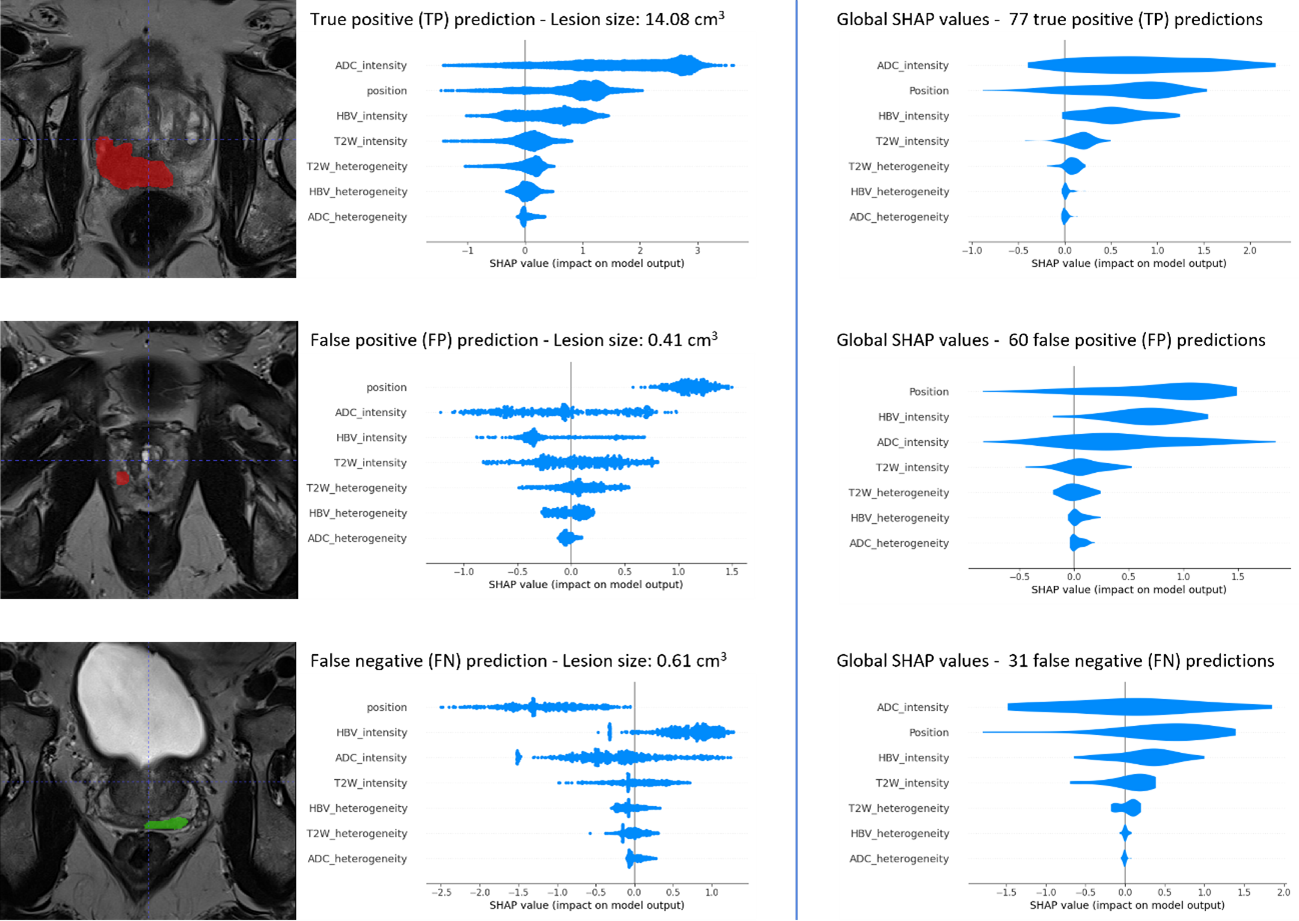
Figure 4: SHAP plots of TP (1st row), FP (2nd row) and FN predictions (3rd row) for single lesions (1st column) and overall (2nd column). For the TP and FP lesions, the detected lesion mask was used to calculate the SHAP values, while for FN lesions the ground truth mask was used.