0862
Prediction of Lymphovascular Space Invasion in endometrial cancer using MRI-based radiomics models1The First Affiliated Hospital of Guangxi Medical University, Nanning, China, 2Philips Healthcare, Guangzhou, China
Synopsis
Keywords: Diagnosis/Prediction, Radiomics
Motivation: Predicting LVSI before surgery remains a critical challenge.
Goal(s): To predict preoperative LVSI in patients with endometrial cancer in a noninvasive way.
Approach: We developed and validated MRI radiomics and clinical-radiomics models based on the features extracted from tumor and peritumoral regions.
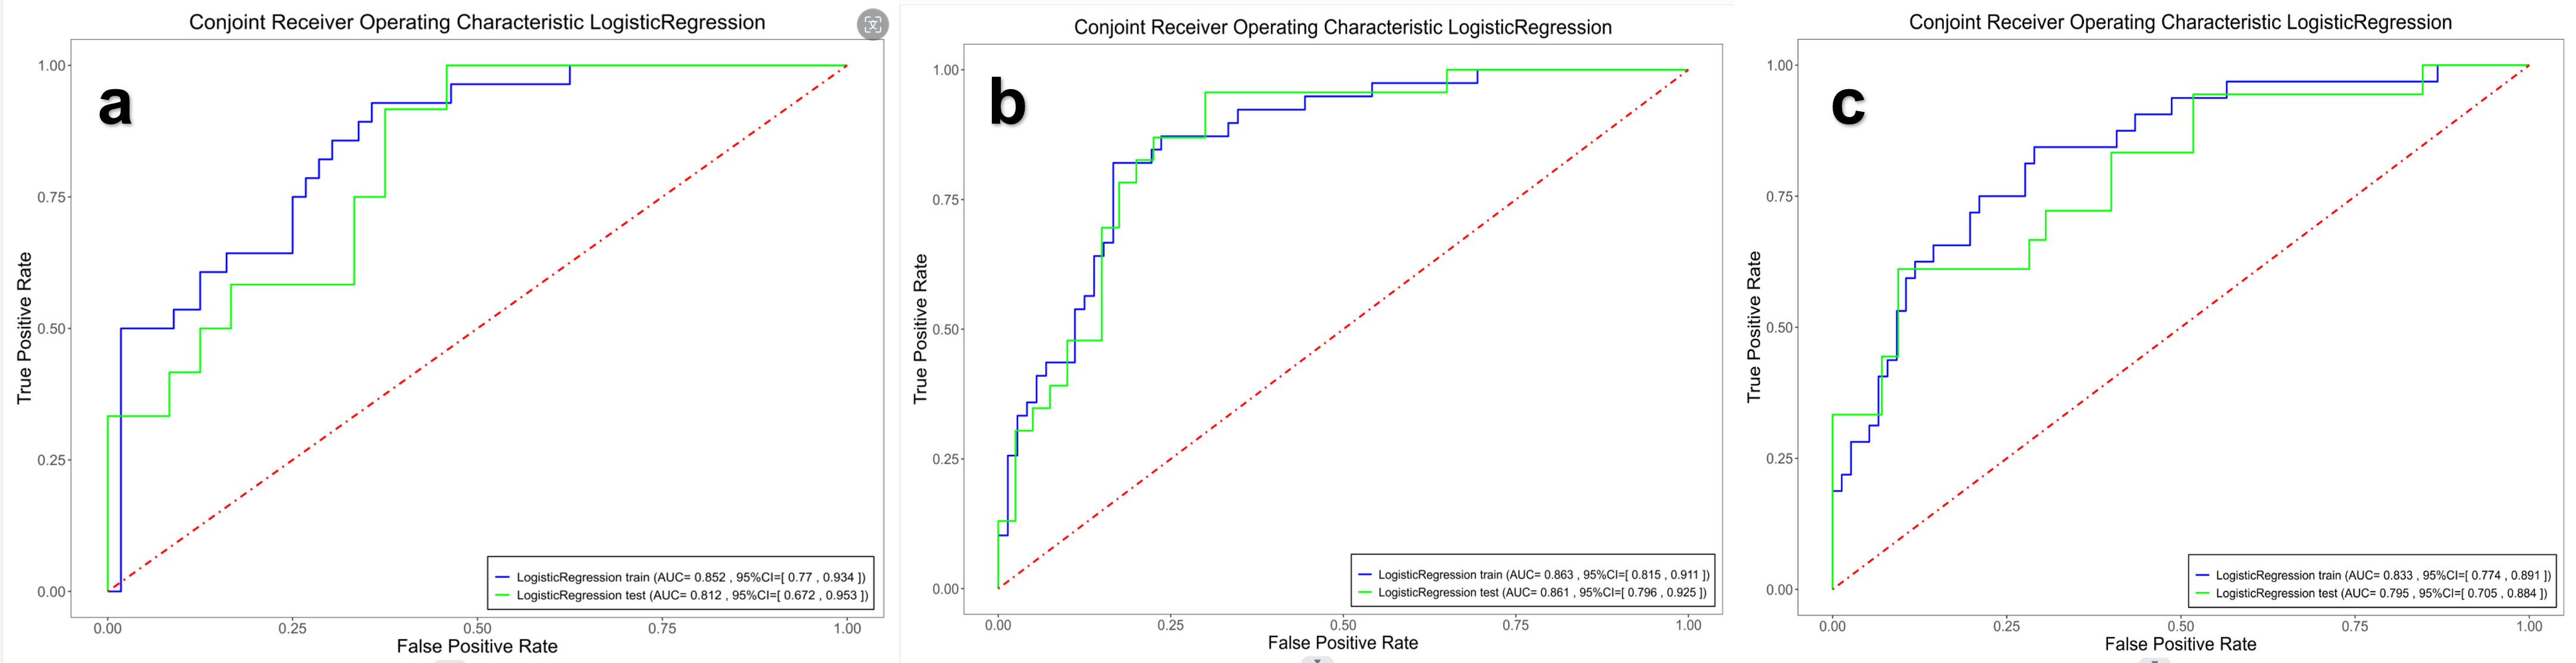
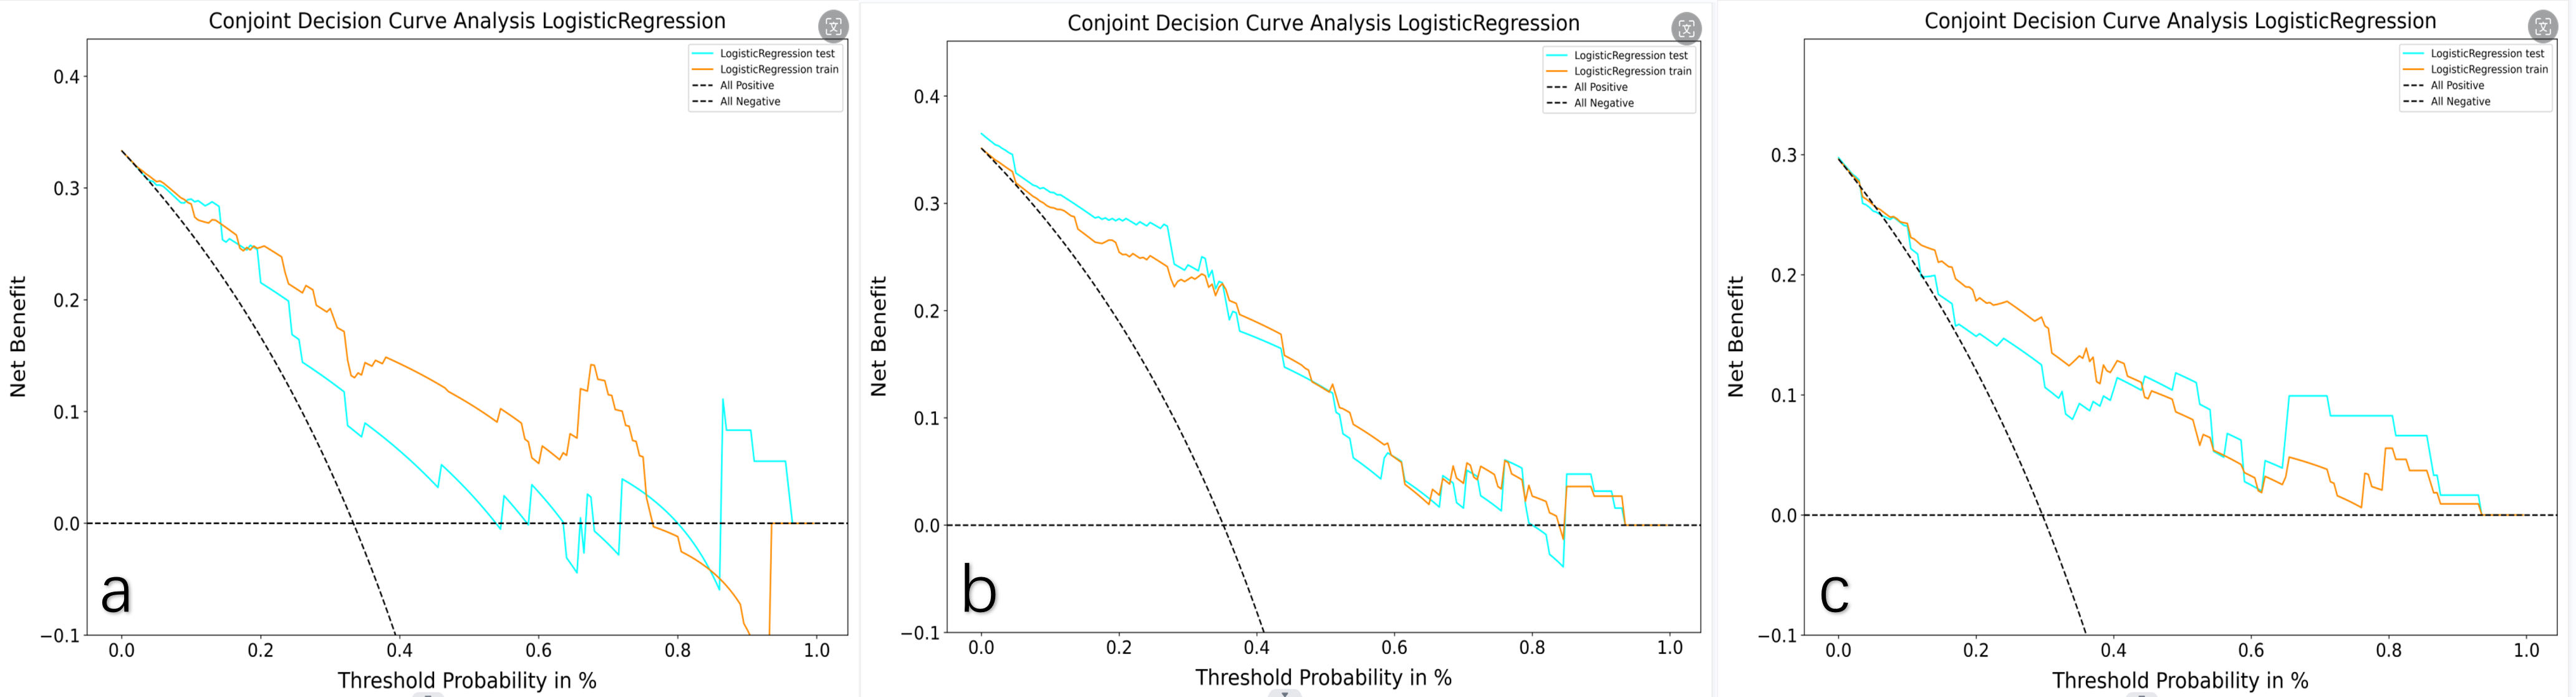
Results: The clinical-radiomics model based on the features extracted from the tumors with 3mm peritumoral region exhibited the hightest predictive performance in the training cohort and testing cohort with an AUC of 0.86 and 0.86, respectively. The model also displayed clinical validity as depicted in the DCA curve.
Impact: Incorporating the radiomics features extracted from tumor with 3mm peritumoral region and clinical significance factors can improve the predictive efficacy of the model for predicting LVSI and increase its applicability in clinical practice.
Introduction
Lymphovascular Space Invasion(LVSI) was defined as infiltration of tumor emboli into lymphatic and(or) blood space, posing a significant risk factor for metastasis to lymph nodes and other sites1. Presently, LVSI can only be identified through post-surgical pathology in EC patients. Predicting LVSI before surgery remains a critical challenge.While prior studies have developed radiomics models to predict LVSI, few have focused on the peritumoral area, and the relationship between LVSI and the peritumoral area remains unconfirmed. Additionally, only a few studies analyzed the correlation between BMI, diabetes mellitus, high blood pressure, hyperlipidemia, and small tumor diameter with LVSI.
In this study, we aimed to develope radiomics and clinical-radiomics models based on the features extracted from intratumor combined with peritumoral region and compared their performance in predicting LVSI.
Methods
This study included 122 EC patients confirmed by postoperative histopathology from 2020 to 2022. All patients were scanned with the Verio 3T MR scanner (Siemens Healthcare, Erlangen, Germany) before treatment. Axial T2WI, DWI, and contrast-enhanced T1WI (early arterial phase) images were acquired. The excluded criteria were: (I) tumor too small to be identified; (II) lack of DWI or contrast-enhanced images; (III) adjuvant therapy before surgery.Clinical and pathological factors, such as age, BMI, pathological type, pathological grade, hypertension, diabetes mellitus, hyperlipidemia, CA125, HE4, and short tumor diameter were collected. Univariate analysis was performed to identify relevant factors for LVSI prediction. Independent predictive clinical factors were then assessed through multivariate logistic regression and incorporated into the clinical-radiomics model.
The VOIs were drawn using ITK-SNAP(Version 4.0.0). Tumor regions were outlined manually while the tumor with 3mm and 5mm peritumoral regions were automatically expanded. The extra-uterine tissue was manually excluded from the VOIs. We extracted 1874 imaging radiomics features from each patient. The study population was divided into a training cohort and a testing cohort in a 7:3 ratio. Features with the Pearson correlation coefficient ≥0.9 were excluded. The imaging features were then ranked in ascending p-value order and the top 5% were selected. Subsequently, the features were further selected by LASSO regression. We constructed the radiomics models using multivariate logistic regression in the training cohort, including the intratumoral region model (IM), IM with 3mm peritumoral region model (PM), and IM with 5mm PM. Clinical-radiomics models (CM) were also respectively constructed using multivariate logistic regression. The area under the curve (AUC) and decision curve analysis (DCA) were used to evaluate the performance of the prediction models.
Result
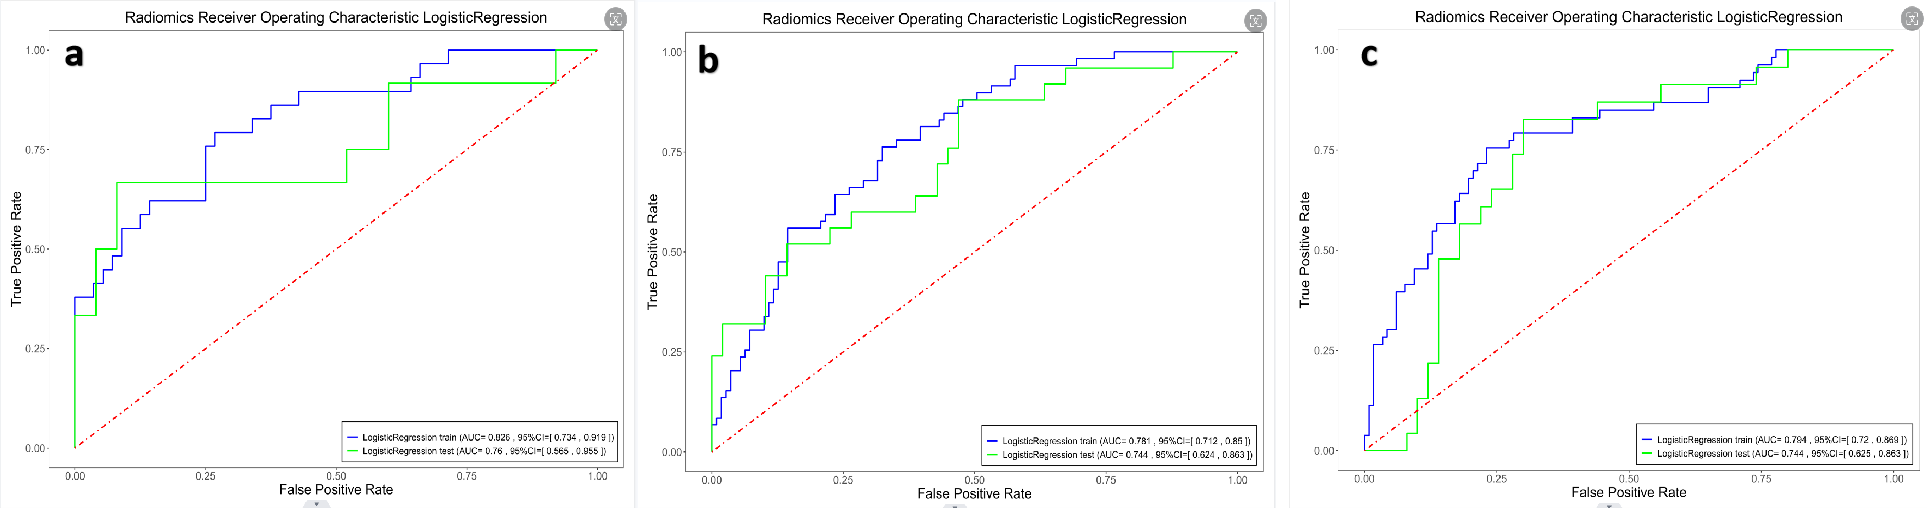
Univariate factor analysis showed that BMI and short tumor diameter were significantly associated with LVSI (p < 0.05). Furthermore, BMI and short tumor diameter remained independent predictors of LVSI by multivariate logistic regression(p < 0.05).Based on the MR radiomics featured, the AUC of the IM, IM with 3mm PM, and IM with 5mm PM in the training cohort were 0.82, 0.78, and 0.79, respectively. In the testing cohort, the AUC were 0.76, 0.74, 0.74, respectively. The CM(IM), CM(IM with 3mm PM), CM(IM with 5mm PM) showed AUC were 0.85, 0.86, 0.83, respectively. In the testing cohort, the AUC were 0.81, 0.86, 0.79, respectively. The CM(IM with 3mm PM) was most effective in predicting LVSI according to the DCA curves.
The Delong test demonstrated a significant difference between the CM and the CM(IM with 3mm PM) (p=0.048).
Discussion
Our results indicated that the CM(IM with 3mm PM) demonstrated better performance in predicting LVSI. The Delong test also revealed a significant difference between the CM (IM) and the CM(IM with 3mm PM). This may suggest that expanding the intratumoral 3mm region may enhance the efficacy of the model in predicting LVSI.Compared to most previous studies that predicted LVSI2,3, we focused on the peritumoral region and its combination with the tumor. Chen et al4developed a clinical-radiomics model to predict LVSI in patients with EC. The model showed AUC were 0.90 in the train cohort and 0.80 in the test cohort. In contrast, we also focused on the peritumoral region and the clinical-radiomics model performed better in the test cohort.
Moreover, BMI, hypertension, hyperglycemia, and hyperlipidemia, which are crucial clinical factors, were included in this study. Xiao et a5 have found that metabolic syndrome, which includes abnormalities in blood glucose, blood pressure, lipids and BMI, is positively associated with LVSI. In this study, BMI was found to be an independent predictor of LVSI.
Conclusion
Incorporation of clinical significance factors and the radiomics features extracted from tumor with 3mm peritumoral region can improve the predictive efficacy of the model for predicting LVSI and increase its applicability in clinical practice.Acknowledgements
Not applicable.References
1. Bosse T, Peters EE, Creutzberg CL, Jürgenliemk-Schulz IM, Jobsen JJ, Mens JW, Lutgens LC, van der Steen-Banasik EM, Smit VT, Nout RA. Substantial lymph-vascular space invasion (LVSI) is a significant risk factor for recurrence in endometrial cancer--A pooled analysis of PORTEC 1 and 2 trials. Eur J Cancer. 2015 Sep;51(13):1742-50.
2. Long, Ling et al. “MRI-based traditional radiomics and computer-vision nomogram for predicting lymphovascular space invasion in endometrial carcinoma.” Diagnostic and interventional imaging vol. 102,7-8 (2021): 455-462.
3. Luo, Yan et al. “Multiparametric MRI-Based Radiomics Nomogram for Predicting Lymphovascular Space Invasion in Endometrial Carcinoma.” Journal of magnetic resonance imaging : JMRI vol. 52,4 (2020): 1257-1262.
4. Chen, J., Wang, X., Lv, H. et al. Development and external validation of a clinical–radiomics nomogram for preoperative prediction of LVSI status in patients with endometrial carcinoma. J Cancer Res Clin Oncol 149, 13943–13953 (2023).
5. Yang, Xiao et al. “Effects of Metabolic Syndrome and Its Components on the Prognosis of Endometrial Cancer.” Frontiers in endocrinology vol. 12 780769. 16 Dec. 2021.
Figures
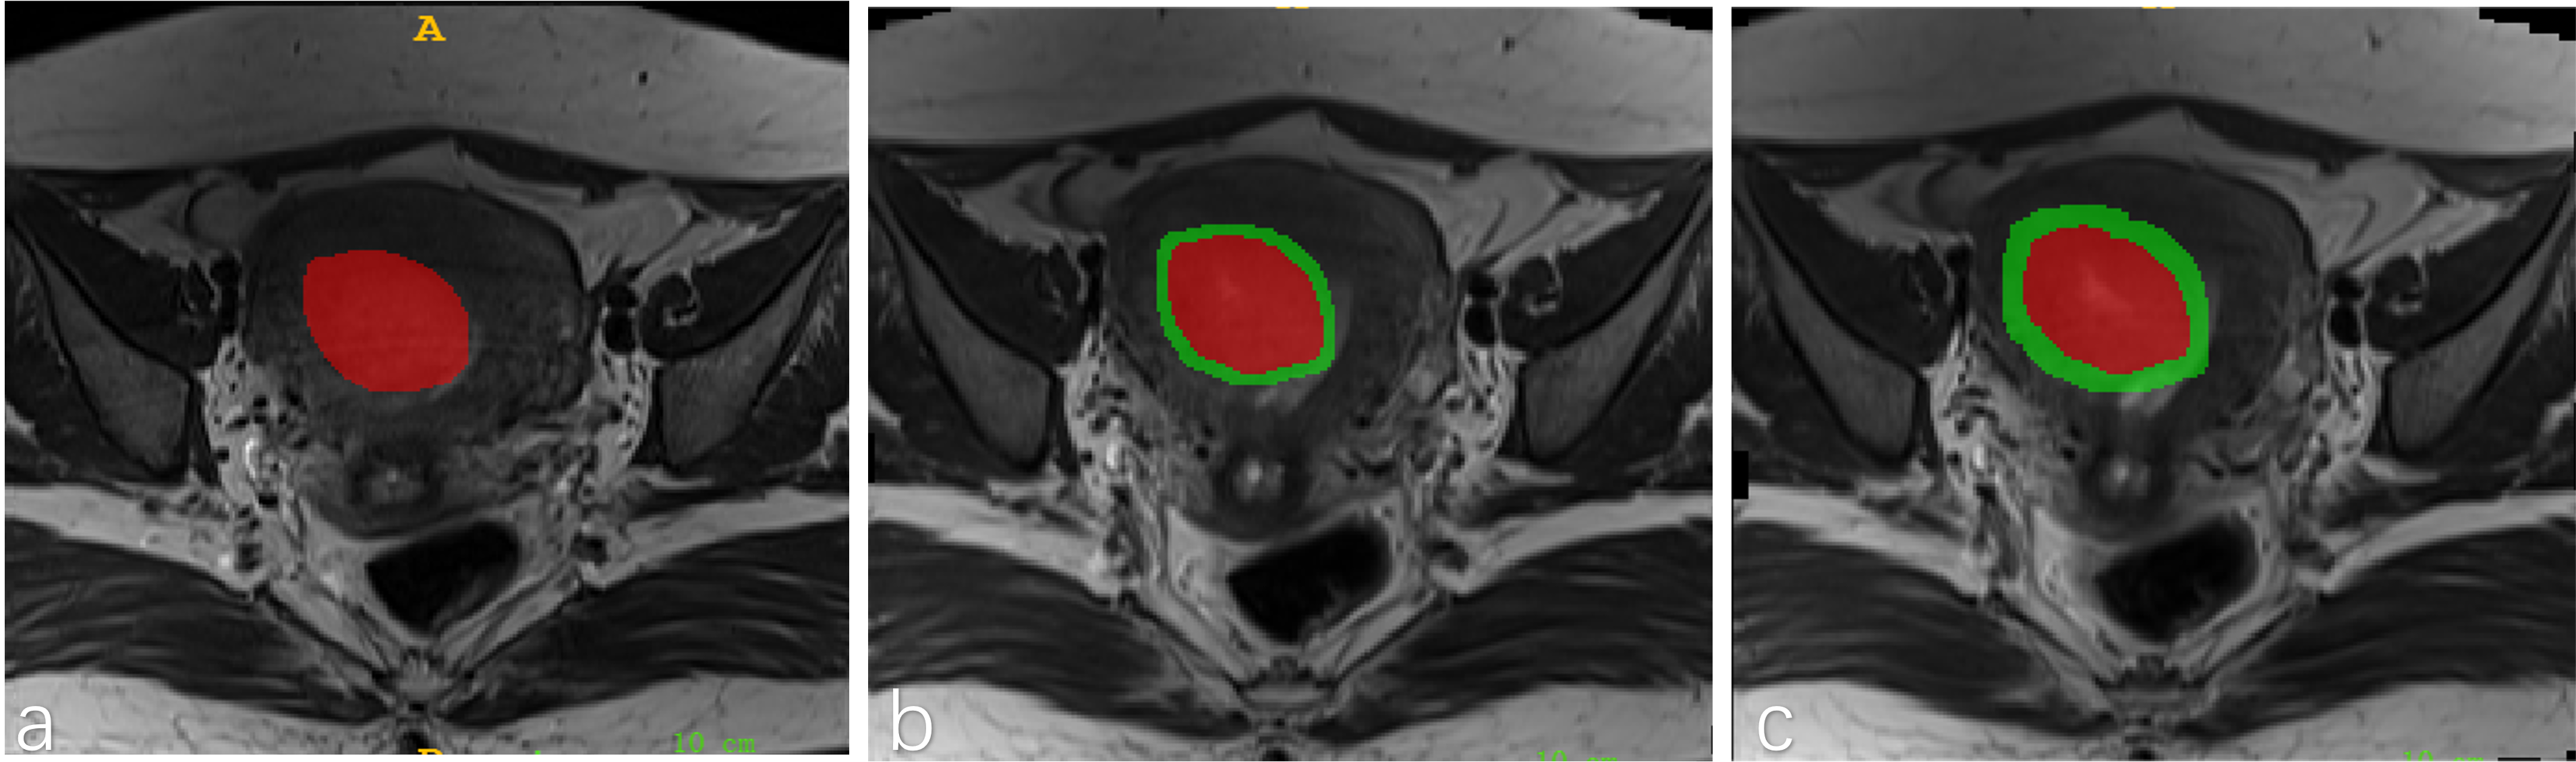
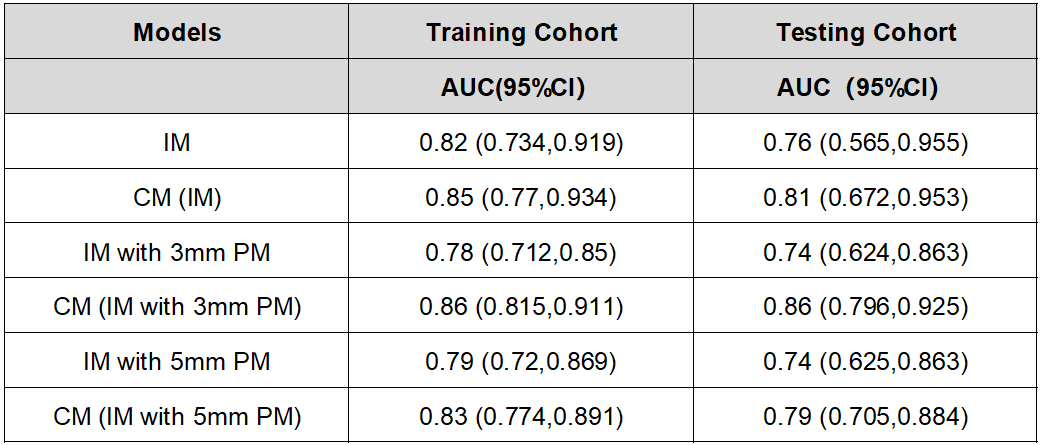
Table 1 Comparison of AUC values with 95% CIs of the established models in the training, testing cohort. IM, intratumoral region model; PM, peritumoral region model; CM, combined model of clinical factors and radiomics.