0861
Prediction of lymph node metastasis after neoadjuvant chemoradiotherapy in rectal cancer with multiparametric MRI-based radiomics1Department of Radiology, The Second Affiliated Hospital of Guangzhou University of Chinese Medicine, Guangzhou, China, 2Philips Healthcare, Guangzhou, China, 3The Second Affiliated Hospital of Guangzhou University of Chinese Medicine, Guangzhou, China, 4Department of Medical Imaging, Nanfang Hospital, Guangzhou, China
Synopsis
Keywords: Diagnosis/Prediction, Radiomics
Motivation: A precise assessment of LN restaging following nCRT is important to guide therapeutic decision and predict prognosis for LARC patients.
Goal(s): To develop and validate a predictive radiomics model for assessing LNM status after nCRT in LARC.
Approach: This study enrolled 150 LARC patients from two centers and constructed several radiomics models based on T2WI and DWI before or/and after nCRT to assess LNM after nCRT.
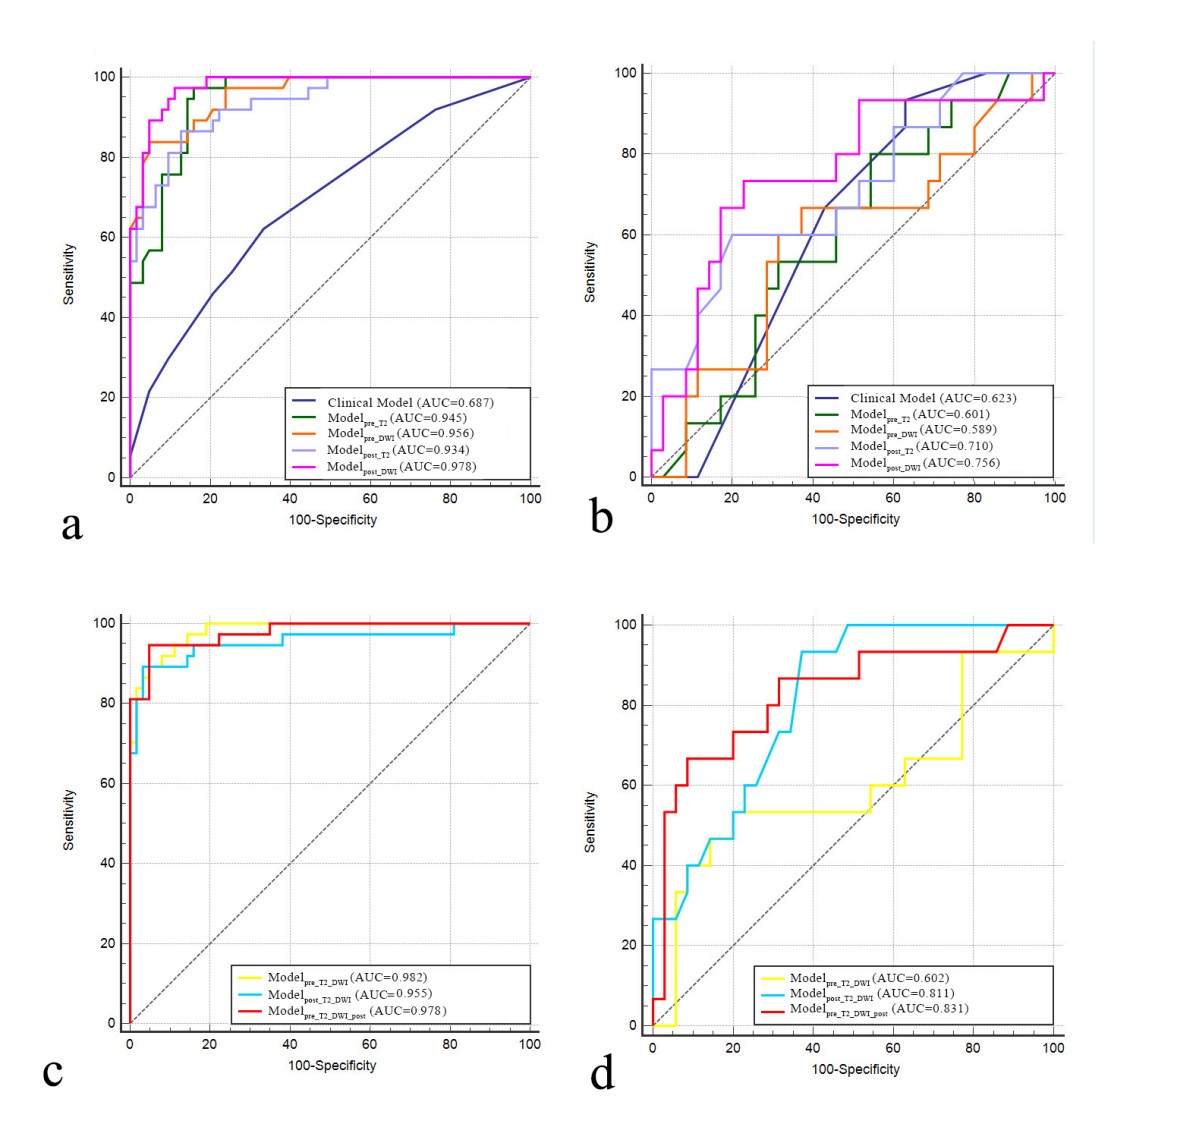
Results: The multiparametric model incorporating MR radiomics features prior to and after nCRT was superior to the clinical model, modelpre_T2_DWI and the single-sequence models (external validation cohort AUC 0.831).
Impact: Radiomics analysis of pre- and post-nCRT multiparameter MR images could predict LNM after nCRT in patients with LARC, and might help guide therapies and predict prognosis for LARC patients.
Introduction
The standard treatment strategy for locally advanced rectal cancer (LARC), which refers to patients with rectal cancer (RC) with clinical (c) T3-cT4 or positive nodal status, is neoadjuvant chemoradiotherapy (nCRT) followed by total mesorectal excision [1]. Accurate prediction of lymph node metastasis (LNM) after nCRT is crucial in formulating therapeutic decision and predicting prognosis for LARC [2-5]. At present, the preoperative evaluation of lymph node (LN) status and restaging following nCRT in rectal cancer (RC) mainly relies on high resolution-MR (HR-MR) [6]. However, the reaction of LN to nCRT could be heterogeneous, ranging from lots of residual cancers to a complete fibrotic response,,causing LN changes in the morphology, dimension, quantity and texture [7,8]. In this setting, visual assessment based on MRI to identify LNM following nCRT may be ambiguous. Radiomics extracts quantitative features from medical images and transforms them into mineable high-dimensional data, revealing pathophysiological information about tumor heterogeneity in biomedical images [9,10]. Thus, the aim of this study was to construct and validate multiparametric MR-based radiomics models included the pre or/and post nCRT information to predict LN status following nCRT in patients with LARC.Methods
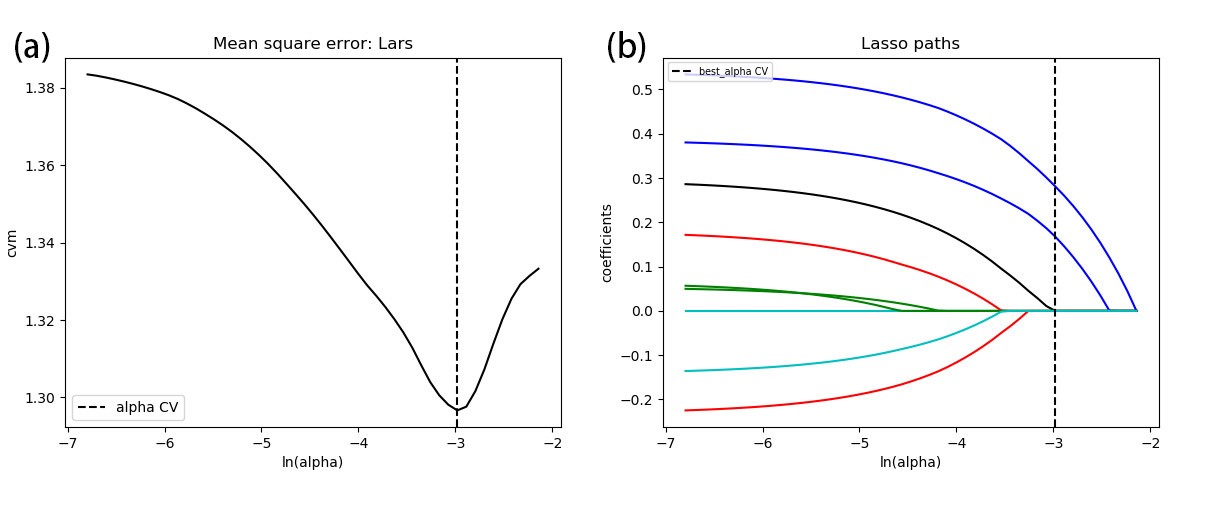
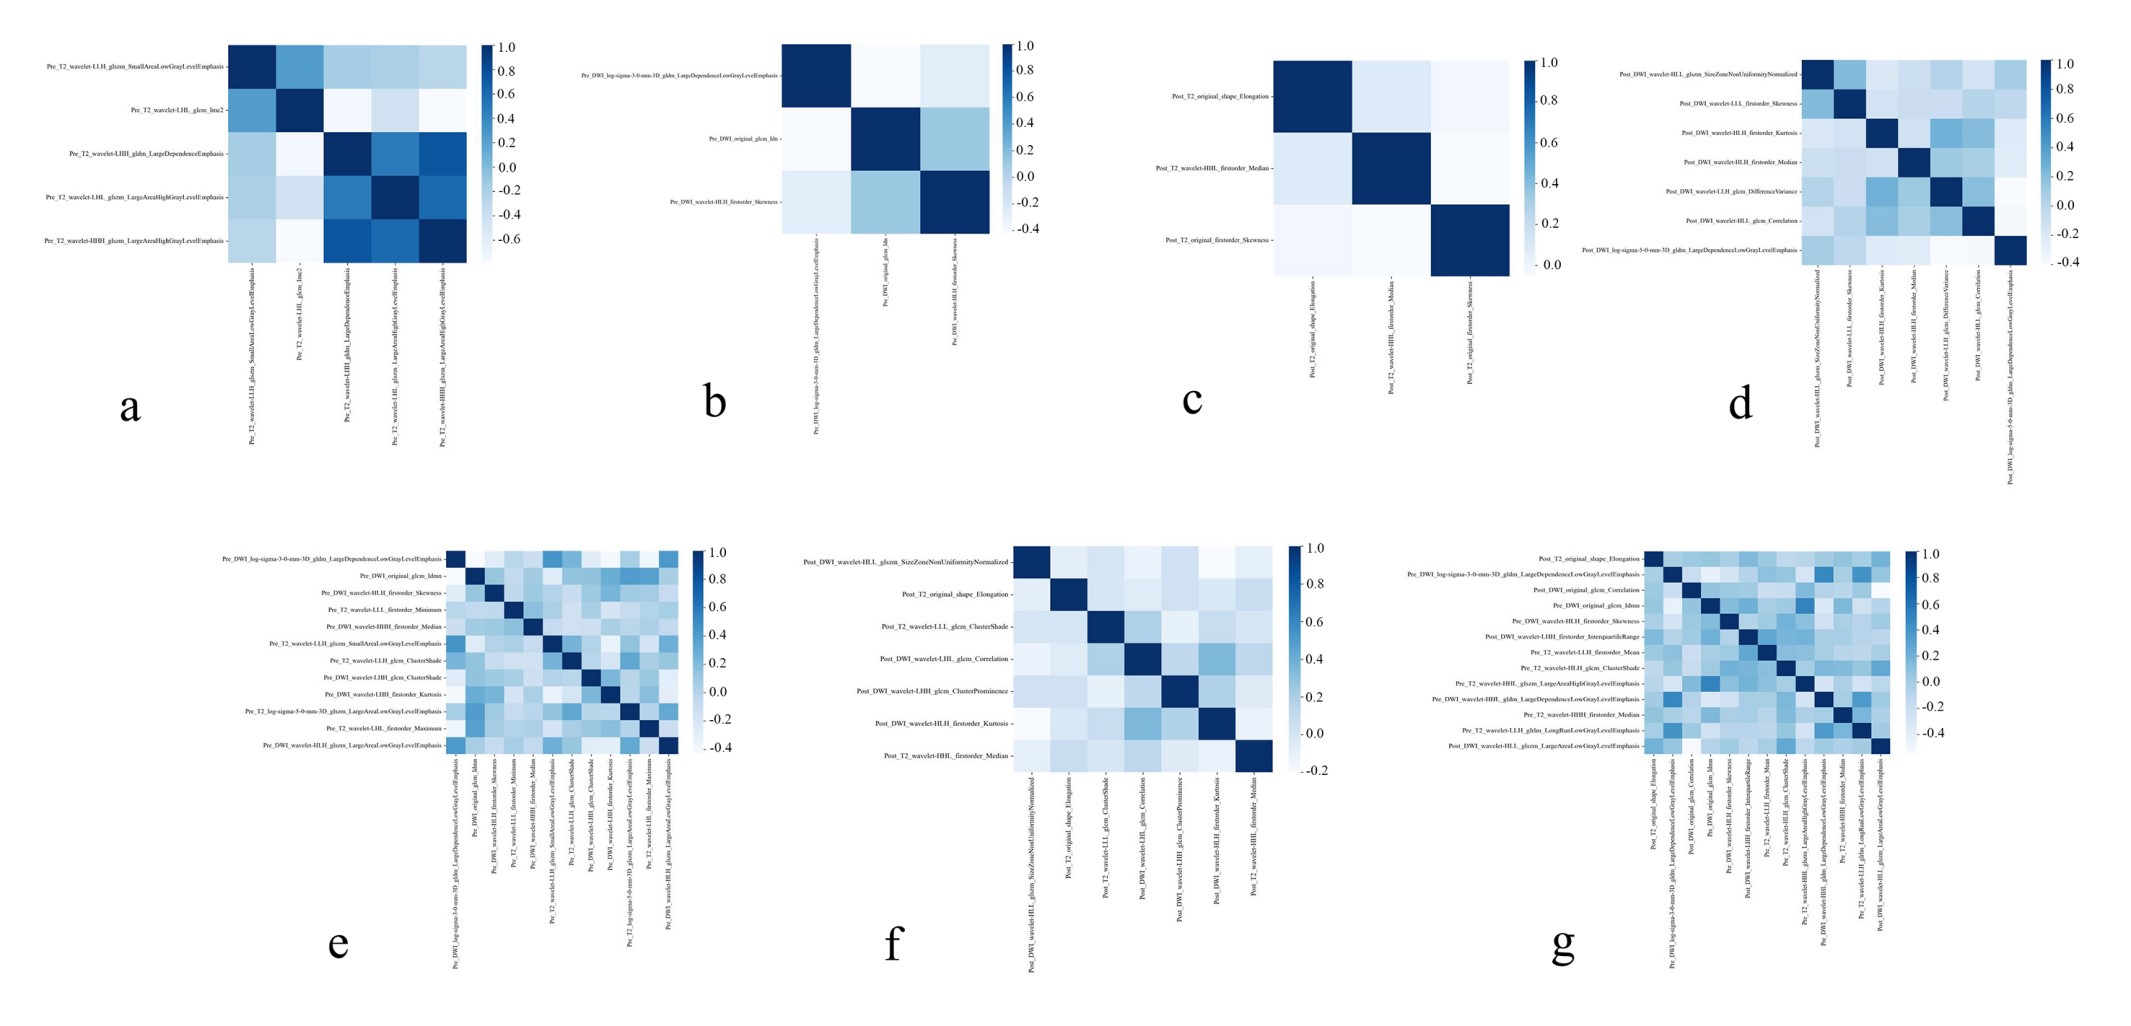
The retrospective study enrolls 150 LARC patients from two centers and divide into internal (center A, n=100) and external validation set (center B, n=50). Radiomic features were obtained from T2WI and DWI before and after nCRT. Dimensionality reduction and feature selection were performed using Spearman correlation analysis and multivariate logistic regression analysis. Clinical features were screened using least absolute shrinkage and selection operator regression analysis. Based on the selected features, single-sequence and multiple-sequence radiomic models were constructed using random forest classifiers. The predictive ability was evaluated with AUC and compared using the Delong method.Results
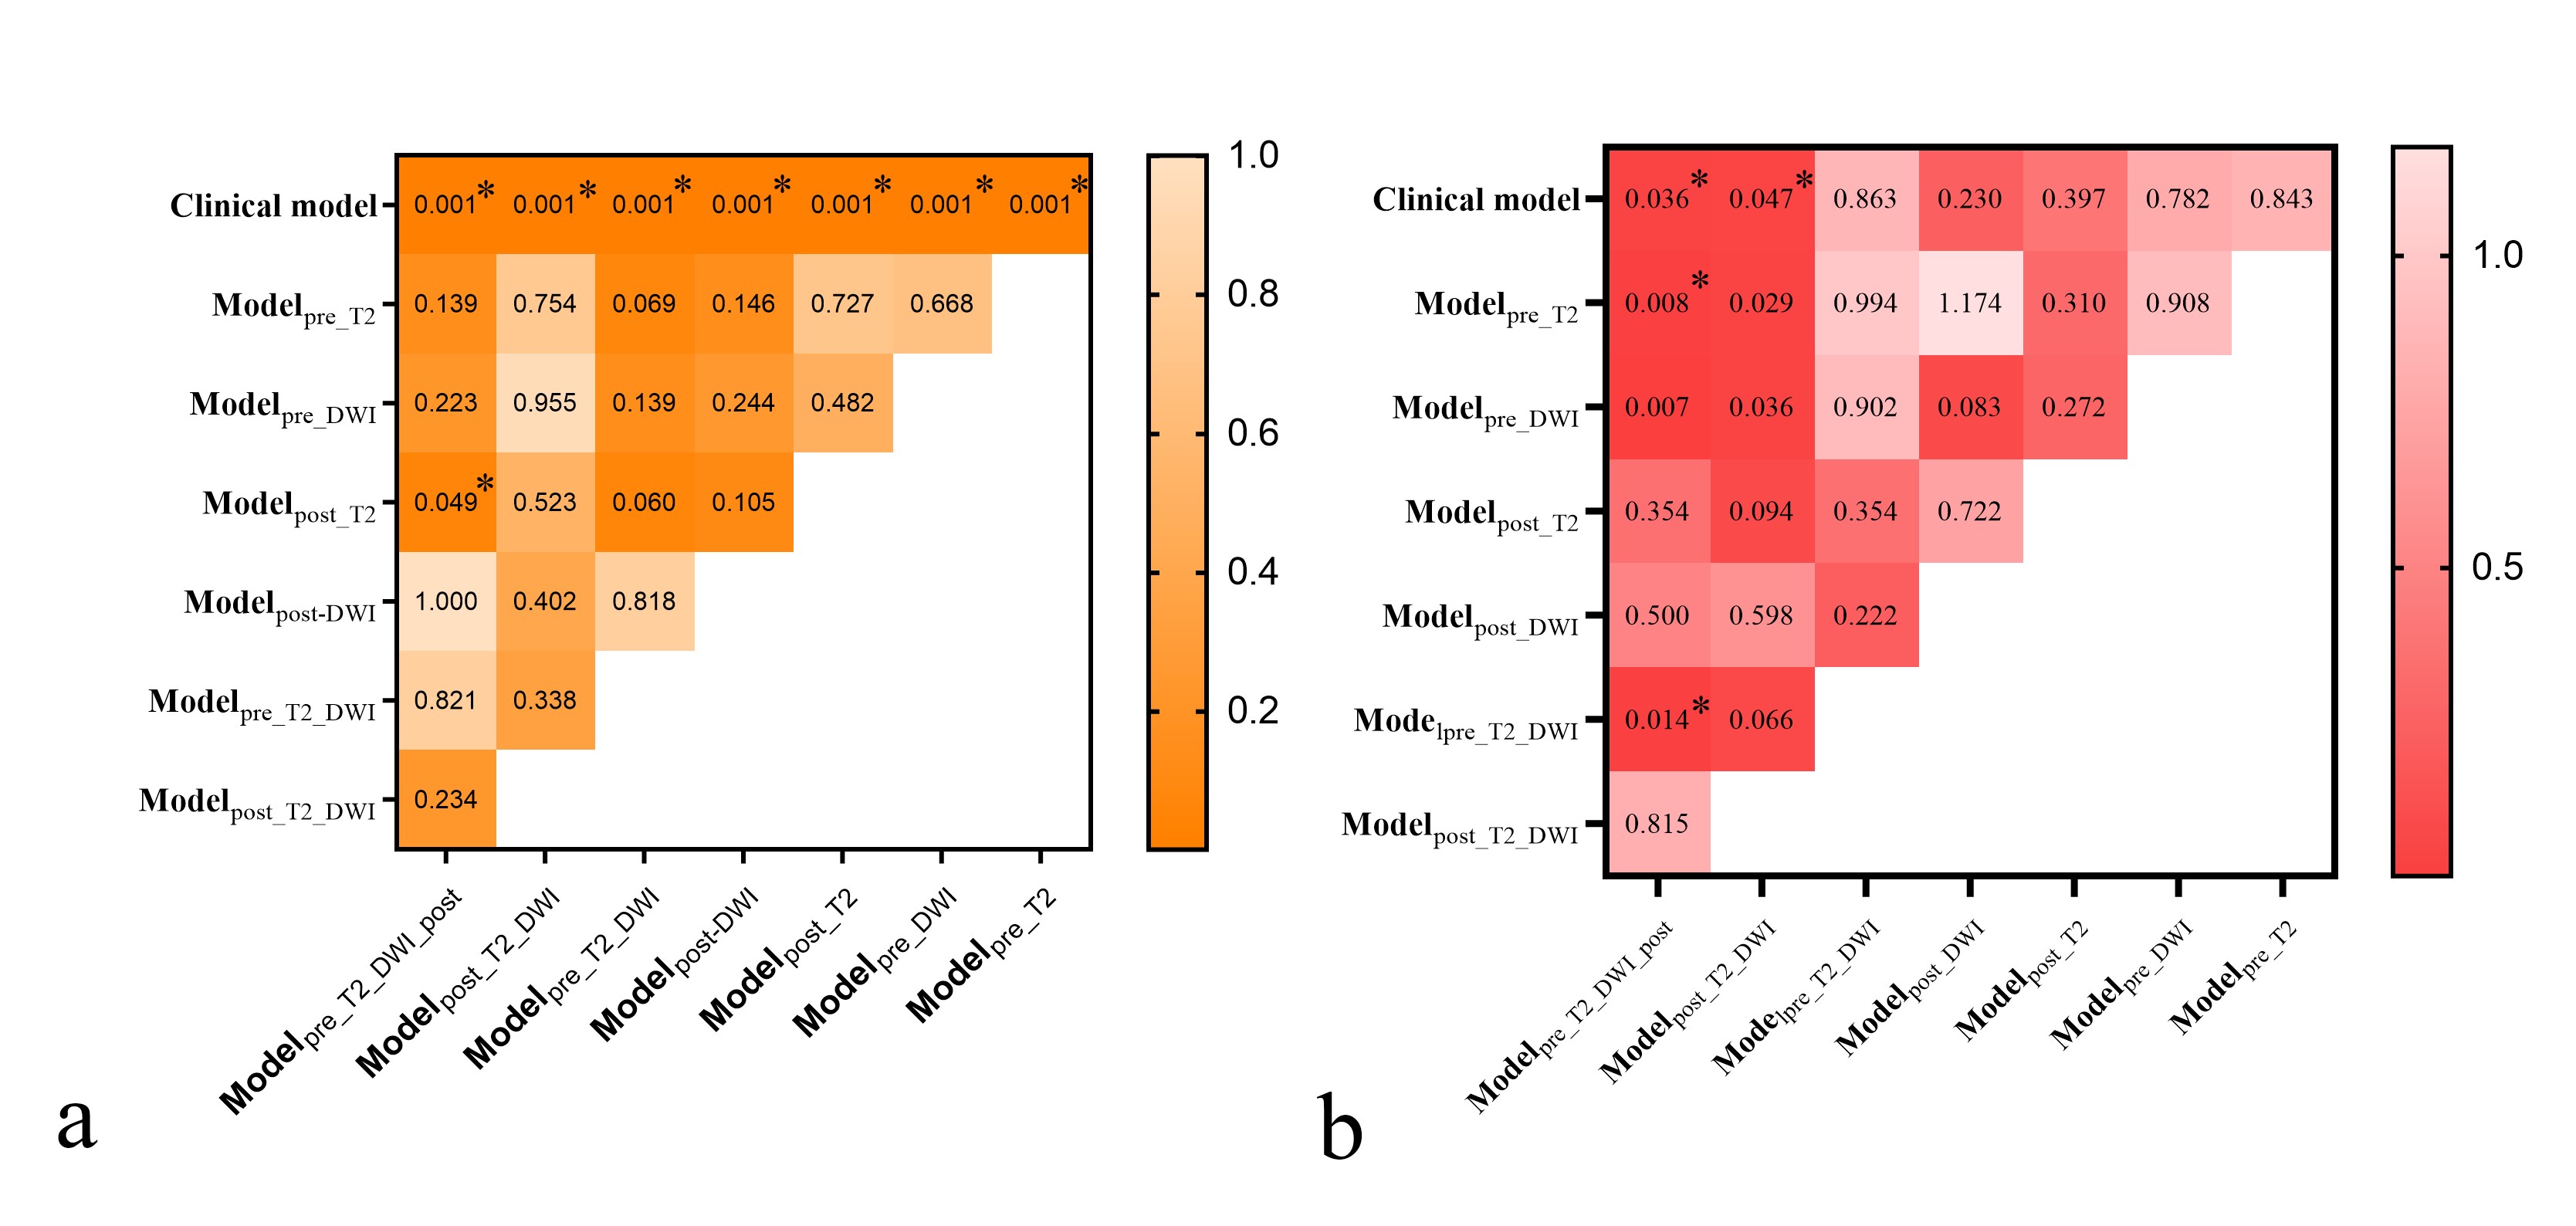
The AUCs of the clinical model and the single-sequence model ranged from 0.589 to 0.756 in the external validation cohort. Among the single-sequence model, the modelpost_DWI (external validation cohort AUC 0.756) outperformed the others in predictive powers. In all models, the modelpre_T2_DWI_post achieved the best performance in predicting LNM, with AUCs of 0.978 and 0.831 in the training cohort and external validation cohort, respectively, which were signifcantly greater than the clinical model, the single-sequence models, and modelpre_T2_DWI (p<0.05).Discussion
In this two-center study, one clinical model, four single-sequence radiomics models, and three combined-sequence radiomics models based on primary tumors were built to identify LNM after preoperative nCRT in LARC, and an independent test set to assess predictive performance. Our finding revealed that the radiomics analysis based on the baseline and follow-up MR data obtained more significant features and information on treatment- induced tumor changes. Additionally, the features of each MR sequence can still be found in the radiomics signature constructed by the Pre_T2_DWI_ Post after feature selection after eliminating redundant features, which highlights the significance of MRI parameters of both before and after nCRT in predicting LNM. Tumors have been proved biologically heterogeneous, showing obvious differences in cells, microenvironmental factors metabolism, vasculature, structure and function. These radiomics features revealed tumor heterogeneity at different scales, provide insights into tumor microenvironments, and proved valuable in predicting treatment response in various tumors.Among single-sequence models, the modelpost_DWI exhibited superior predictive power, with an AUC of 0.756 in the external validation set. Our results suggested radiomics features derived from DWI might be useful cues for predicting LN status in LARC patients. This observation is partially consistent with data from previous study, which showed that texture features extracted from DWI images and ADC maps can predict pathological N stages in RC, with an AUC of 0.802 [11]. There is growing evidence that DWI allow for qualitative and tumor microenvironment- based quantitative assessment of the post treatment tumor bed [12]. The histopathological characteristics of primary tumors are closely related to LNM in RC [13]. Therefore, it might be the reason that the modelpost_DWI could successfully identify the LNM after nCRT.
Among clinical factors, mrTRG and gender were found to be associated with LNM after nCRT, which was consistent with previous research findings [14, 15].Nevertheless, the predictive performance of clinical model still significantly weaker than modelpre_T2_DWI_ post (p=0.036). This might be due to clinicopathological features reflecting the coarse features of tumors, which inevitably involve clinicians’ subjective judgment of patients; while radiomics features contain multidimensional quantitative information that can more objectively and accurately reflect tumor heterogeneity and biological characteristics.
Conclusion
Our findings suggest that the multiparametric model incorporating MR radiomics features prior to and after nCRT is the optimal for predicting LNM after nCRT in patients with LARC, and might help guide therapies and predict prognosis for LARC patients.Acknowledgements
No acknowledgment was found.References
[1] Benson AB, Venook AP, Al-Hawary MM et al (2022) Rectal Cancer, Version 2.2022, NCCN Clinical Practice Guidelines in Oncology. J Natl Compr Canc Netw 20:1139-1167
[2] Guillem JG, Chessin DB, Cohen AM et al (2005) Long-term oncologic outcome following preoperative combined modality therapy and total mesorectal excision of locally advanced rectal cancer. Ann Surg 241:829-836; discussion 836-828
[3] Leibold T, Shia J, Ruo L et al (2008) Prognostic implications of the distribution of lymph node metastases in rectal cancer after neoadjuvant chemoradiotherapy. J Clin Oncol 26:2106-2111
[4] Chang GJ, Rodriguez-Bigas MA, Skibber JM, Moyer VA (2007) Lymph node evaluation and survival after curative resection of colon cancer: systematic review. J Natl Cancer Inst 99:433-441
[5] Chan AK, Wong A, Jenken D, Heine J, Buie D, Johnson D (2005) Posttreatment TNM staging is a prognostic indicator of survival and recurrence in tethered or fixed rectal carcinoma after preoperative chemotherapy and radiotherapy. Int J Radiat Oncol Biol Phys 61:665-677
[6] Beets-Tan RGH, Lambregts DMJ, Maas M et al (2018) Magnetic resonance imaging for clinical management of rectal cancer: Updated recommendations from the 2016 European Society of Gastrointestinal and Abdominal Radiology (ESGAR) consensus meeting. Eur Radiol 28:1465-1475
[7] Rullier A, Laurent C, Capdepont M et al (2008) Lymph nodes after preoperative chemoradiotherapy for rectal carcinoma: number, status, and impact on survival. Am J Surg Pathol 32:45-50
[8] Perez RO, Pereira DD, Proscurshim I et al (2009) Lymph node size in rectal cancer following neoadjuvant chemoradiation--can we rely on radiologic nodal staging after chemoradiation? Dis Colon Rectum 52:1278-1284
[9] Gillies RJ, Kinahan PE, Hricak H (2016) Radiomics: Images Are More than Pictures, They Are Data. Radiology 278:563-577
[10] Lambin P, Leijenaar RTH, Deist TM et al (2017) Radiomics: the bridge between medical imaging and personalized medicine. Nat Rev Clin Oncol 14:749-762
[11] Yin J-D, Song L-R, Lu H-C, Zheng X (2020) Prediction of different stages of rectal cancer: Texture analysis based on diffusion-weighted images and apparent diffusion coefficient maps. World Journal of Gastroenterology 26:2082
[12] Jayaprakasam VS, Alvarez J, Omer DM, Gollub MJ, Smith JJ, Petkovska I (2023) Watch-and-wait approach to rectal cancer: the role of imaging. Radiology 307:e221529
[13] Chang H-C, Huang S-C, Chen J-S et al (2012) Risk factors for lymph node metastasis in pT1 and pT2 rectal cancer: a single-institute experience in 943 patients and literature review. Annals of surgical oncology 19:2477-2484
[14] Berho M, Oviedo M, Stone E et al (2009) The correlation between tumour regression grade and lymph node status after chemoradiation in rectal cancer. Colorectal Disease 11:254-258
[15] Wee IJY, Cao HM, Ngu JC-Y (2019) The risk of nodal disease in patients with pathological complete responses after neoadjuvant chemoradiation for rectal cancer: a systematic review, meta-analysis, and meta-regression. International Journal of Colorectal Disease 34:1349-1357
Figures