0854
Hybrid Multidimensional MRI: Demonstrating Repeatability in Non-Invasive Prostate Cancer Tissue Characterization1Radiology, University of Chicago, Chicago, IL, United States, 2Pathology, University of Chicago, Chicago, IL, United States
Synopsis
Keywords: Prostate, Prostate
Motivation: Validate the consistency and reliability of Hybrid Multidimensional MRI (HM-MRI) through repeatability assessments.
Goal(s): Evaluate the repeatability of HM-MRI in prostate tissue characterization and its diagnostic accuracy for prostate cancer.
Approach: Our approach consists on performing dual HM-MRI scans with a one-week interval to assess measurement consistency and diagnostic accuracy of HM-MRI biomarkers.
Results: The results indicate high reproducibility of HM-MRI metrics, evidenced by strong inter-class correlation coefficients, with consistent tissue composition measurements across initial and repeat scans, and robust diagnostic performance of HM-MRI parameters in prostate cancer detection.
Impact: The findings of this study highlights the potential of HM-MRI as a reliable tool for prostate cancer diagnosis, paving the way for non-invasive clinical applications and inspiring further research into its utility in other diagnostic imaging techniques.
Introduction
The Hybrid Multidimensional MRI (HM-MRI) represents a significant advancement in the non-invasive diagnosis and characterization of prostate cancer (PCa)1. This technique has been developed to quantify the composition of epithelium, stroma, and lumen in the prostate, motivated by the characteristic high epithelium and low lumen in PCa. Its application has been rigorously validated against gold-standard histological data2, exhibiting potential to surpass the diagnostic accuracy of even experienced radiologists3Repeatability studies are needed to assess the consistency and reliability of this technique when subjected to repeated measurements to ensure that the technique can be adopted with confidence by the medical community at large, making it more widespread in the clinical setting. Therefore, the purpose of this study is to present the first repeatability study for HM-MRI in estimating prostate tissue composition non-invasively and diagnostic accuracy of HM-MRI biomarkers in PCa diagnosis.
Methods
Hybrid Multidimensional MRI (HM-MRI) acquisitions were performed on eight patients scheduled for clinical MRI examinations utilizing an endorectal coil (ERC MRI) in conjunction with a 16-channel pelvic phased array coil on a Philips 3.0 T Ingenia system. The protocol included multi-planar T2-weighted images and Apparent Diffusion Coefficient (ADC) maps at varying b-values. The HM-MRI scan produces a 4×4 matrix of hybrid data for each distinct b-value and echo time (TE) combination. Patients underwent two HM-MRI scanning sessions spaced one week apart to facilitate a comparison of the repeatability of the HM-MRI metrics. Five of these patients had a confirmed diagnosis of prostate cancer from biopsy analyses. Regions of Interest (ROIs) were delineated in the peripheral zone (PZ), transitional zone (TZ), and identified cancerous regions on the initial scans. These ROIs were replicated in terms of size and shape on the corresponding slice of the follow-up scan, while allowing for positional adjustments due to patient repositioning. Quantitative analysis within these ROIs included mean and standard deviation calculations for ADC and T2 values, as well as volume fractions for epithelium, stroma, and lumen, accompanied by their respective ADC and T2 measurements. The percentage variance of these parameters in the follow-up scan relative to the first scan was also determined. Statistical analyses incorporated the paired t-test to evaluate mean differences between the initial and repeat scans, inter-class correlation (ICC) for assessing measurement consistency, and the Area Under the Curve (AUC) to quantify the diagnostic performance of the repeatability data.Results
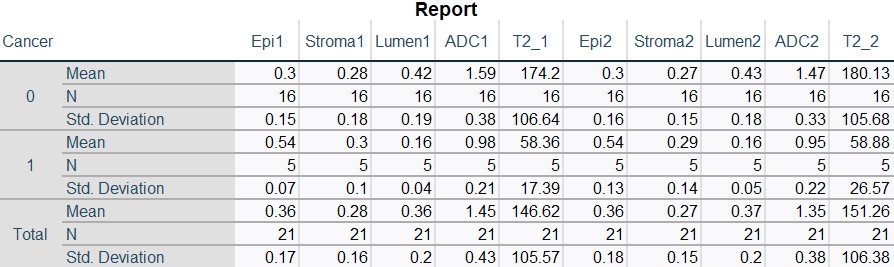
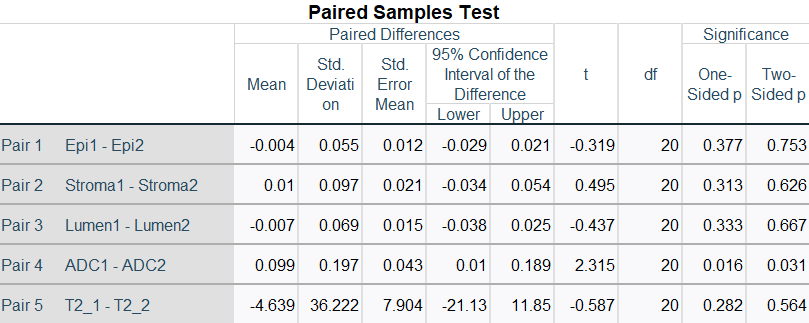
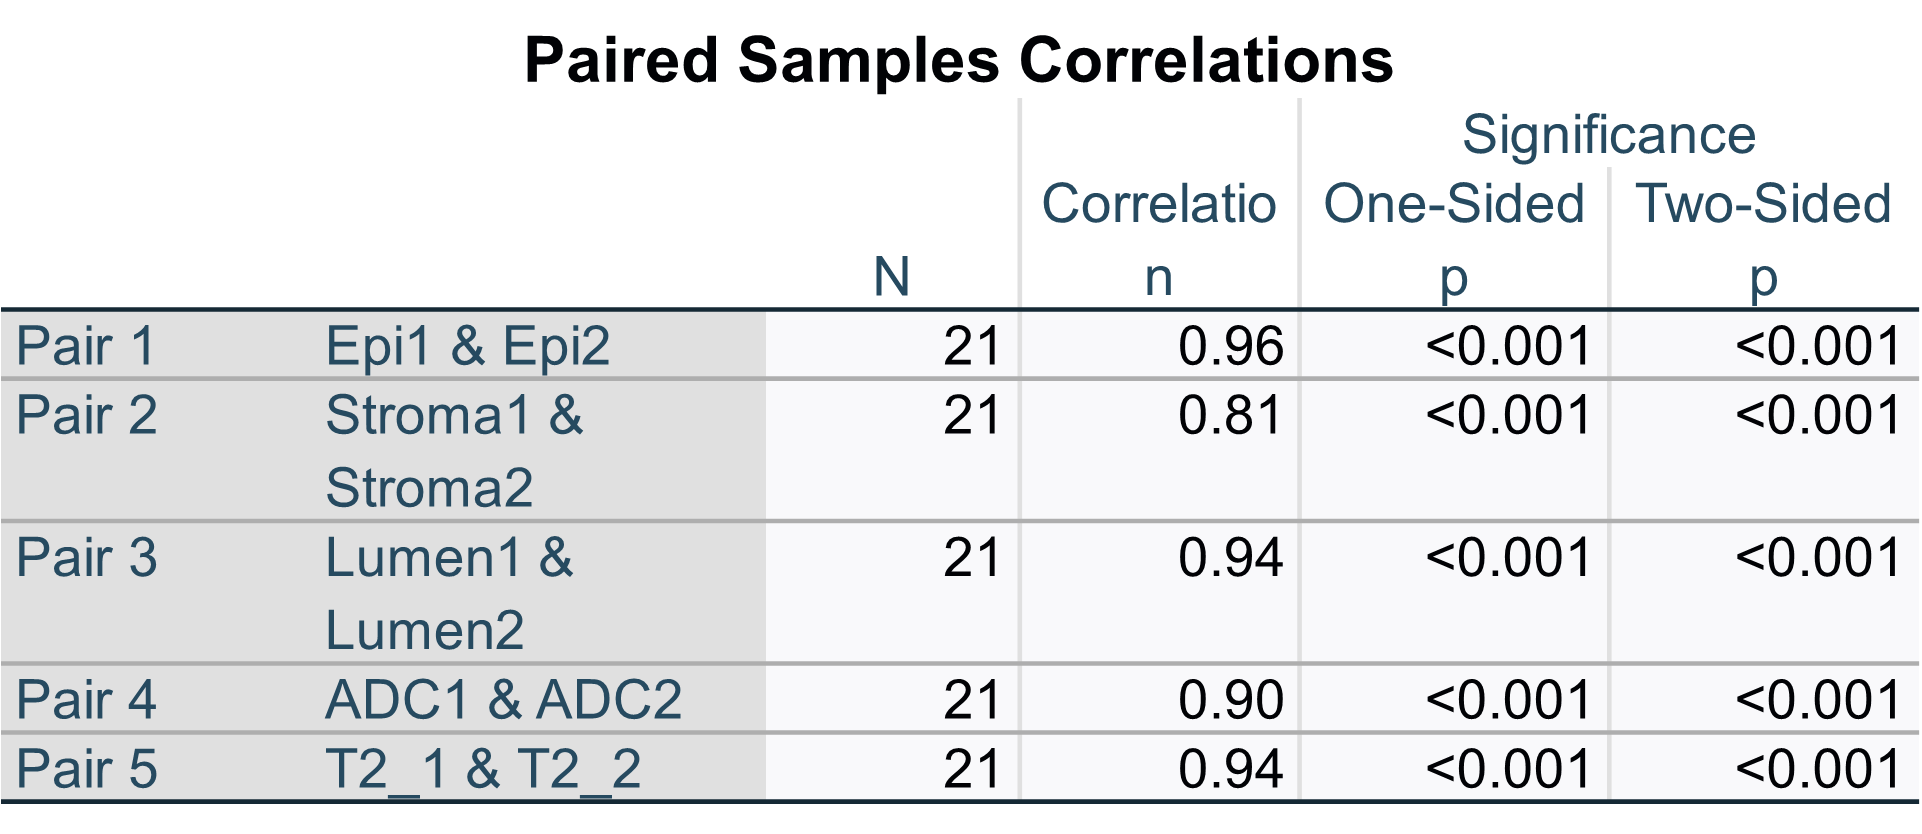
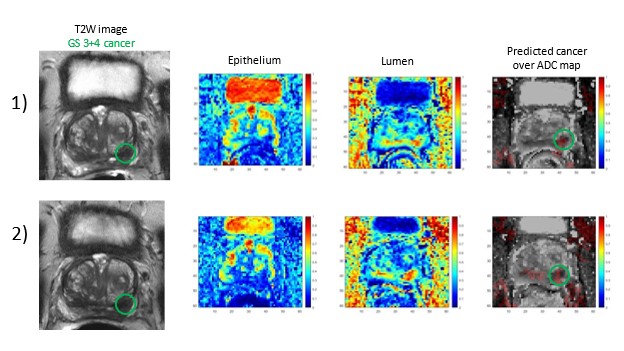
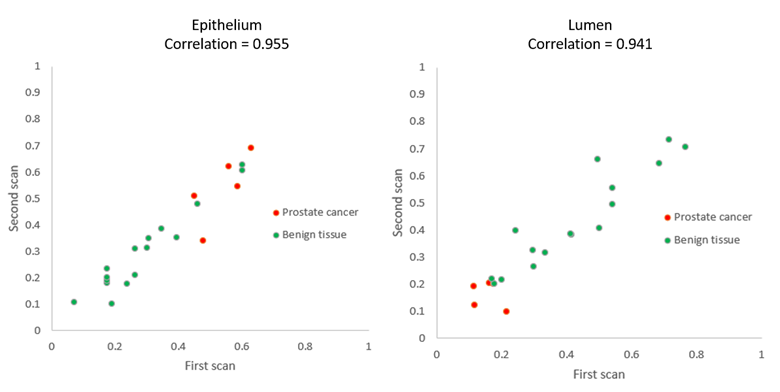
The results shows that HM-MRI measurements are highly reproducible demonstrated by the excellent inter-class correlation coefficients (ICC) (Table 3). The ICC for epithelium stood at 0.96 and for lumen at 0.94, indicating high reliability. The repeatability assessment of HM-MRI in tissue composition for epithelium and lumen revealed no significant differences between the initial and subsequent scans (Table 2). The average epithelium percentage was 54.14% in the first scan and 54.17% in the second, while lumen constituted 15.71% and 16.35%, respectively. Prostate cancer (PCa) tissue demonstrated a characteristic high epithelium and low lumen composition compared to benign tissue during both scans as expected as shown in Table 1. The Area Under the Curve (AUC) also showed excellent results for the first and repeated scans for epithelium (0.89 and 0.86), lumen (0.95 and 0.98), ADC (0.94 and 0.93), and T2 (0.94 and 0.94).Discussion
The high ICC and pairwise correlation shown here is crucial as it supports the reproducibility of HM-MRI measures and combined with the high diagnostic performance of HM-MRI parameters in diagnosing PCa based on their higher epithelium and lower lumen compared to benign tissue. These findings demonstrate that HM-MRI holds strong potential for reliable, non-invasive PCa diagnostics, presenting non-invasive tissue characterization critical for accurate disease assessment.Conclusion
HM-MRI has demonstrated to be repeatable in the evaluation of PCa, affirming its role as a promising tool in the non-invasive assessment of tissue composition. This ensures diagnostic consistency and strengthen the role of the HM-MRI in the PCa detection.Acknowledgements
We would like to express our sincere gratitude to the Radiology Department at the University of Chicago for their support and resources that made this research possible.References
1. A. Chatterjee et al. “Diagnosis of Prostate Cancer with Noninvasive Estimation of Prostate Tissue Composition by Using Hybrid Multidimensional MR Imaging: A Feasibility Study”. Radiology (2018).
2. A. Chatterjee et al. “Histological validation of prostate tissue composition measurement using hybrid multi-dimensional MRI: agreement with pathologists’ measures”. Abdominal Radiology 47 (2021), pp. 801–813.
3. G. Lee, A. Chatterjee, I. Karademir, et al. “Comparing Radiologist Performance in Diagnosing Clinically Significant Prostate Cancer with Multiparametric versus Hybrid Multidimensional MRI”. Radiology 305.2 (2022), pp. 399–407.
Figures