0852
Automated 3D Volume Segmentation of Subcutaneous and Visceral Abdominal Fat Using Fat-Water Imaging1Department of Radiology, Mass General Brigham, Boston, MA, United States, 2Harvard Medical School, Boston, MA, United States, 3Research Program in Men's Health: Aging and Metabolism, Mass General Brigham, Boston, MA, United States
Synopsis
Keywords: Endocrine, Body, Fat Water Imaging
Motivation: The study is driven by the need to accurately quantify abdominal fat, particularly visceral fat, to better understand its link with metabolic diseases
Goal(s): This research aims to develop a robust, automated 3D segmentation method for distinguishing and quantifying Subcutaneous and Visceral Fat from volumetric fat-water MRI images.
Approach: Utilizing Fat-Water Imaging combined with 3D whole volume segmentation and morphology provides improved quantification.
Results: The new method yielded more reliable and consistent fat compartment segmentation across subjects, outperforming the prior 2D segmentation techniques and showing promise for aiding the study of metabolic disorders.
Impact: The study's automated 3D Fat-Water image segmentation technique aids the assessment of abdominal fat, enabling clinicians and researchers to efficiently study and evaluate metabolic disease risk and progression.
Background
Segmentation and quantitation of Subcutaneous Fat (SCF) and Visceral Fat (VF) in the abdominal cavity can reveal key insights in many metabolic diseases. VF specifically is associated with diseases processes including Type 2 Diabetes Mellitus, dyslipidemia, and cardiovascular disease. Thus, a rapid and reliable method to quantify VF would be a valuable tool for the study of these diseases. Fat-Water Imaging (FWI) has been shown to provide reproducible estimates of tissue fat and water fractions [1] and provides the ideal image data for an automated abdominal fat analysis.Objective
Conventional approaches to medical image segmentation often involve a 2D slice by slice approach, often relying on manual tracing by an expert. Volume based 3D segmentation has potential to improve the reliability of automated segmentation methods since each point effectively has more neighboring points and thus more information is available for determining tissue boundaries. Segmentation of Abdominal FWI scans to separate SCF and VF was done on whole abdominal volumes and the fat volumes and mass of each compartment were calculated.Methods
The study utilized a 3T GE SIGNA and LAVA Flex sequences to obtain separated fat and water images. A total of 57 scans were performed on 32 subjects (ages 19-70). The proposed method leverages the inherent contrast properties of FWI fat fraction estimation and 3D whole volume morphological operations, requiring no training dataset, which promotes computational efficiency and practicality in clinical settings. First, the loaded fat and water image volumes were subjected to a thresholding operation where each slice was binarized based on 10% of the maximum intensity value in that slice to create the preliminary images. Then, a Gaussian filter was applied to the combined fat and water image data to smooth out noise and facilitate a more reliable segmentation. This smoothed data was then thresholded to generate mask that covers only the subject’s anatomy. Using the generated mask, the fat and water fraction images were computed to represent the relative composition within each voxel according to the method in [2]. The edges within the fat fraction image were detected using the Canny algorithm to outline the boundaries of the abdominal fat. A region-growing algorithm was applied to isolate the abdominal region based on the edge-detected data. Finally, additional Gaussian smoothing and thresholding were applied to determine the final segmentation masks, ensuring the elimination of extraneous regions. The fat volumes of the SCF and VF segments were quantified by counting the voxels with more than 0.5 fat fraction. This method was compared to a previous abdominal segmentation method [3] that uses k-means clustering and 2D slice by slice approach. To quantify the quality of the segmentation, the volume difference between adjacent slice SCF volumes were calculated. Since adjacent slices should have smaller differences, it can be used to assess the consistency of each segmentation.Results
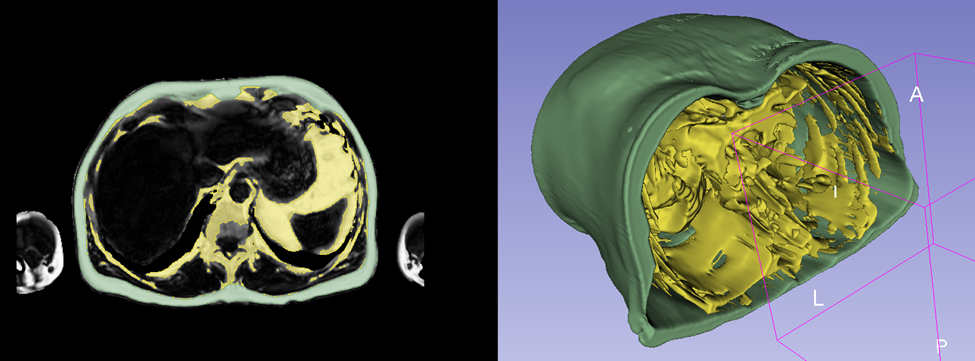
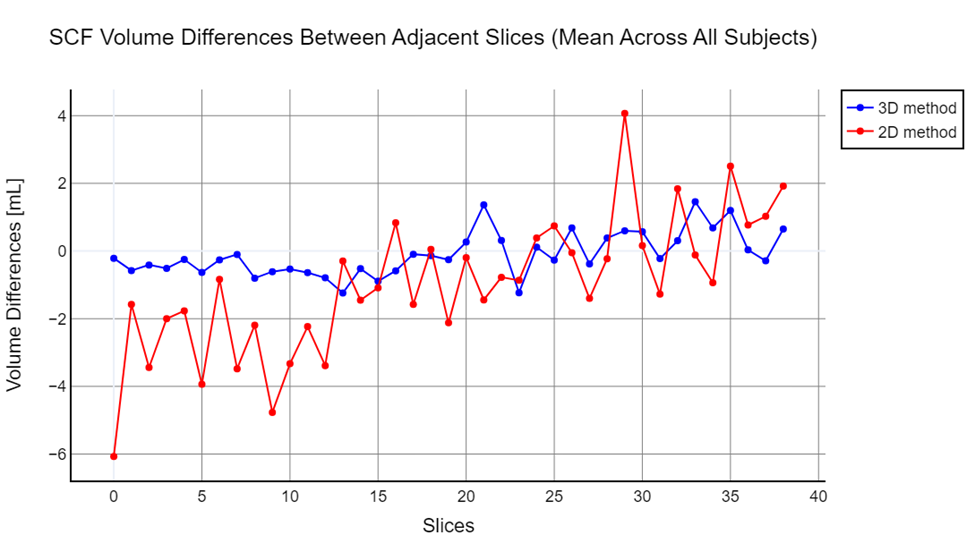
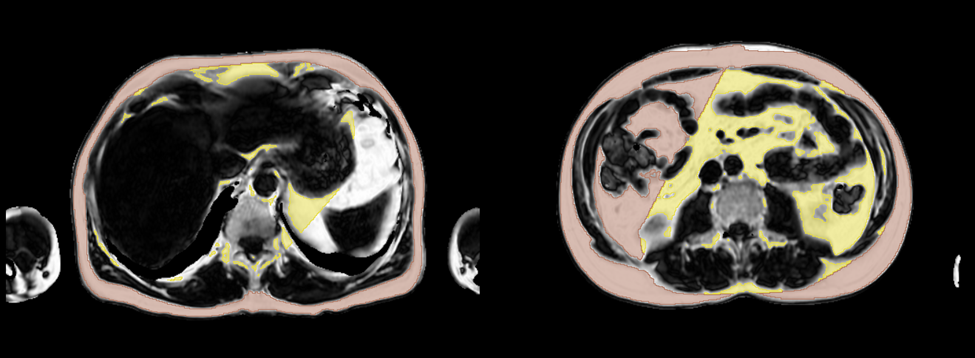
Figure 1 shows an example of the segmentation result. The slice differences were plotted and averaged across all subjects. Figure 2 shows the average slice SCF volume difference plot from each method. The mean difference using the 3D method was -0.00098 + 0.027 whereas the 2D method was -0.0096 + 0.089.The overall mean SCF volume difference with the proposed method is lower than the SCF volume difference from the previous method. In addition, A qualitative inspection of the data reveals why the previous method deviates more between slices: the 2D clustering algorithm does not see the adjacent slices and the resulting SCF label map can be inconsistent. This method also sporadically produces SCF segment labels that extend deep into the intrabdominal area (Figure 3). In contrast, the proposed method relies primarily on the 3D morphologic operations and thus does not have such a failure mode.
Conclusions
The results suggest that this method can provide more consistent SCF and VF segmentation compared to the previous method. This automated 3D segmentation approach has potential to be a robust and efficient tool for clinical and research applications, particularly in the study and assessment of metabolic disorders. By utilizing the biologically meaningful reproducible measurement of FWI fat fractions quantitation on the full volumetric data, this method minimizes user dependency, reliance on any training data or clustering algorithms.Furthermore, segmentation of the SCF and VF can be the initial step of more granular abdominal compartment segmentation. Segmentation of abdominal organs such as a liver can likely be improved by masking out the SCF and VF compartments.
Acknowledgements
No acknowledgement found.References
[1] Berglund, J., Johansson, L., Ahlström, H. and Kullberg, J., 2010. Three‐point Dixon method enables whole‐body water and fat imaging of obese subjects. Magnetic Resonance in Medicine: An Official Journal of the International Society for Magnetic Resonance in Medicine, 63(6), pp.1659-1668.
[2] Weedall, A.D., Wilson, A.J. and Wayte, S.C., 2019. An investigation into the effect of body mass index on the agreement between whole-body fat mass determined by MRI and air-displacement plethysmography. The British journal of radiology, 92(1103), p.20190300.
[3] Shen, J., Baum, T., Cordes, C., Ott, B., Skurk, T., Kooijman, H., Rummeny, E.J., Hauner, H., Menze, B.H. and Karampinos, D.C., 2016. Automatic segmentation of abdominal organs and adipose tissue compartments in water-fat MRI: application to weight-loss in obesity. European journal of radiology, 85(9), pp.1613-1621.
Figures