0851
T2-weighted imaging and water-fat-silicone separation in breast MRI.1Radiology, Stanford University, Stanford, CA, United States, 2Bioengineering, Stanford University, Stanford, CA, United States, 3Electrical Engineering, Stanford University, Stanford, CA, United States
Synopsis
Keywords: Breast, Breast
Motivation: Breast MRI is increasingly used for diagnosis and high-risk screening in patients with silicone breast implants, a common aesthetic procedure, but silicone-specific sequences lengthen and complicate protocols.
Goal(s): We aim to demonstrate simultaneous water-fat-silicone separation with T2-weighting, and improved contrast between fat and silicone.
Approach: We propose Dual-Interval Echo-Time (DIET) preparation to provide T2-weighting with reduced fat signal, and multi-point species separation with 5 gradient echoes at each spin-echo.
Results: We demonstrate robust water-fat-silicone separation (WFSS) and improved control of T2-weighting in water, and the contrast between fat and silicone.
Impact: We have combined DIET Fast Spin Echo with multi-echo water-fat-silicone separation to enable T2-weighted imaging for subjects with silicone breast implants. This may allow improved evaluation of breast tissue, as well as assessment of complications with implants.
Introduction/Purpose
Approximately 200,000 breast augmentation procedures were performed in the USA in 2021, of which approximately 80% used silicone implants. MRI has been shown to be effective at evaluating complications after surgery and with silicone implant aging1. Breast MRI protocols normally include 2D and 3D T1- and T2-weighted sequences for anatomy and fluid assessment, as well as multiplanar T2-weighted high-resolution water- and silicone-specific scans, where one or two species (i.e. water or/and fat) are suppressed. Methods have been proposed for obtaining water-fat-silicone separated images from one acquisition with chemical-shift encoding2,3. In particular, recent work achieves 3D high-resolution phase-based image separation and field mapping from a T1-weighted spoiled gradient-echo sequence with 4-6 echoes3. Here, we aim to achieve T2-weighted imaging with water-fat-silicone separation, and to improve both contrast and separation using the DIET technique4.Methods
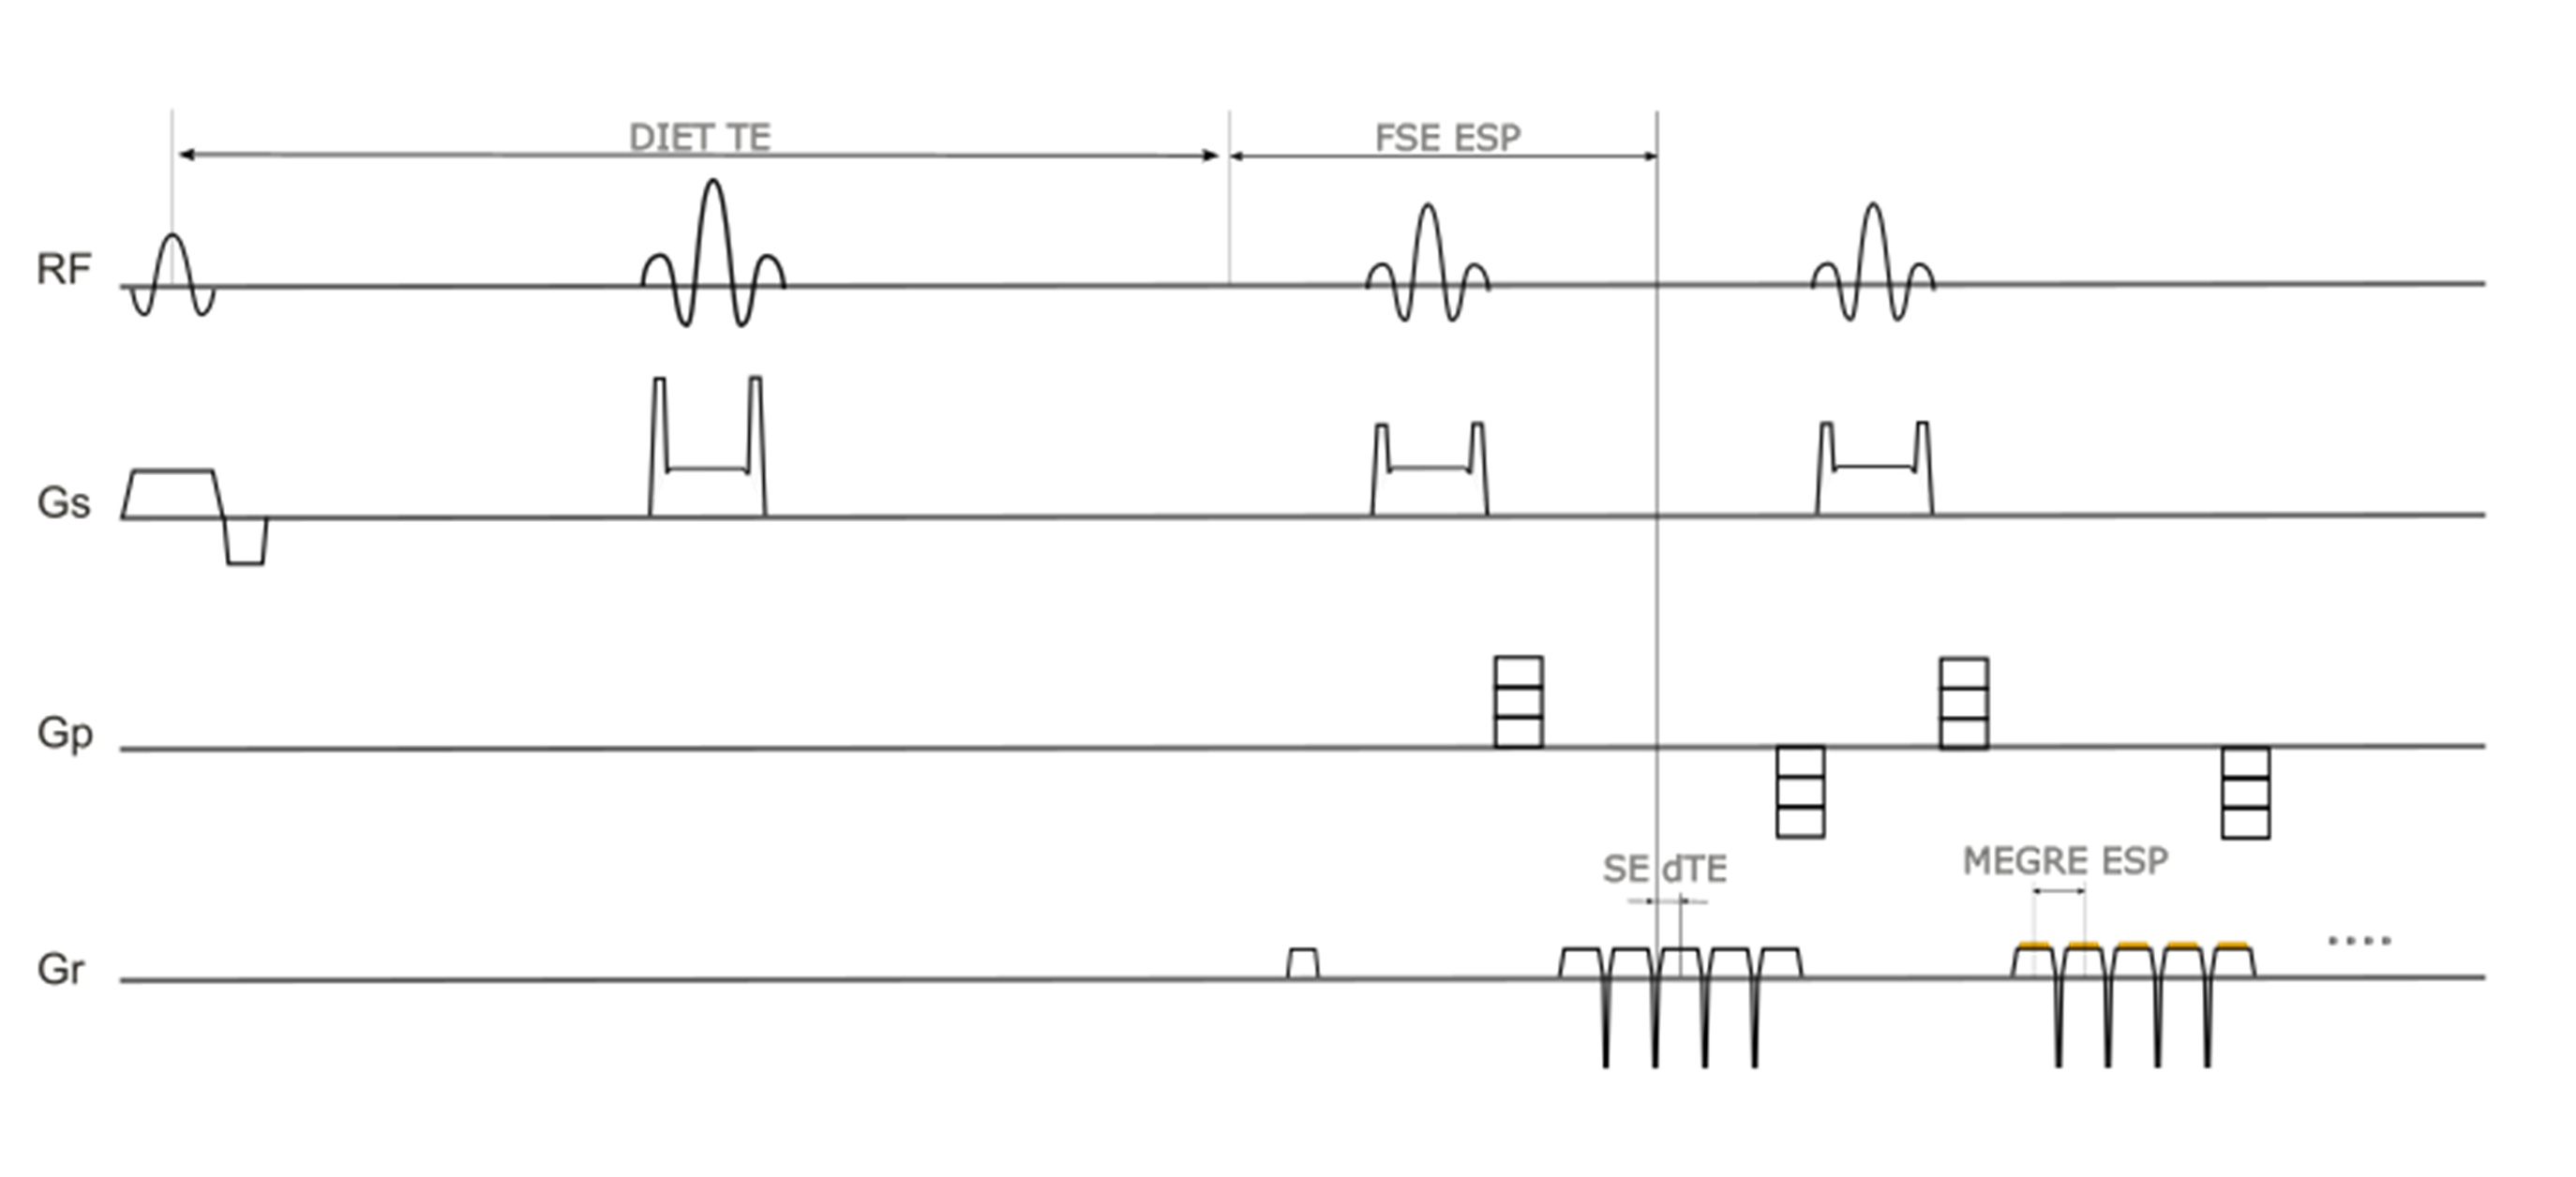
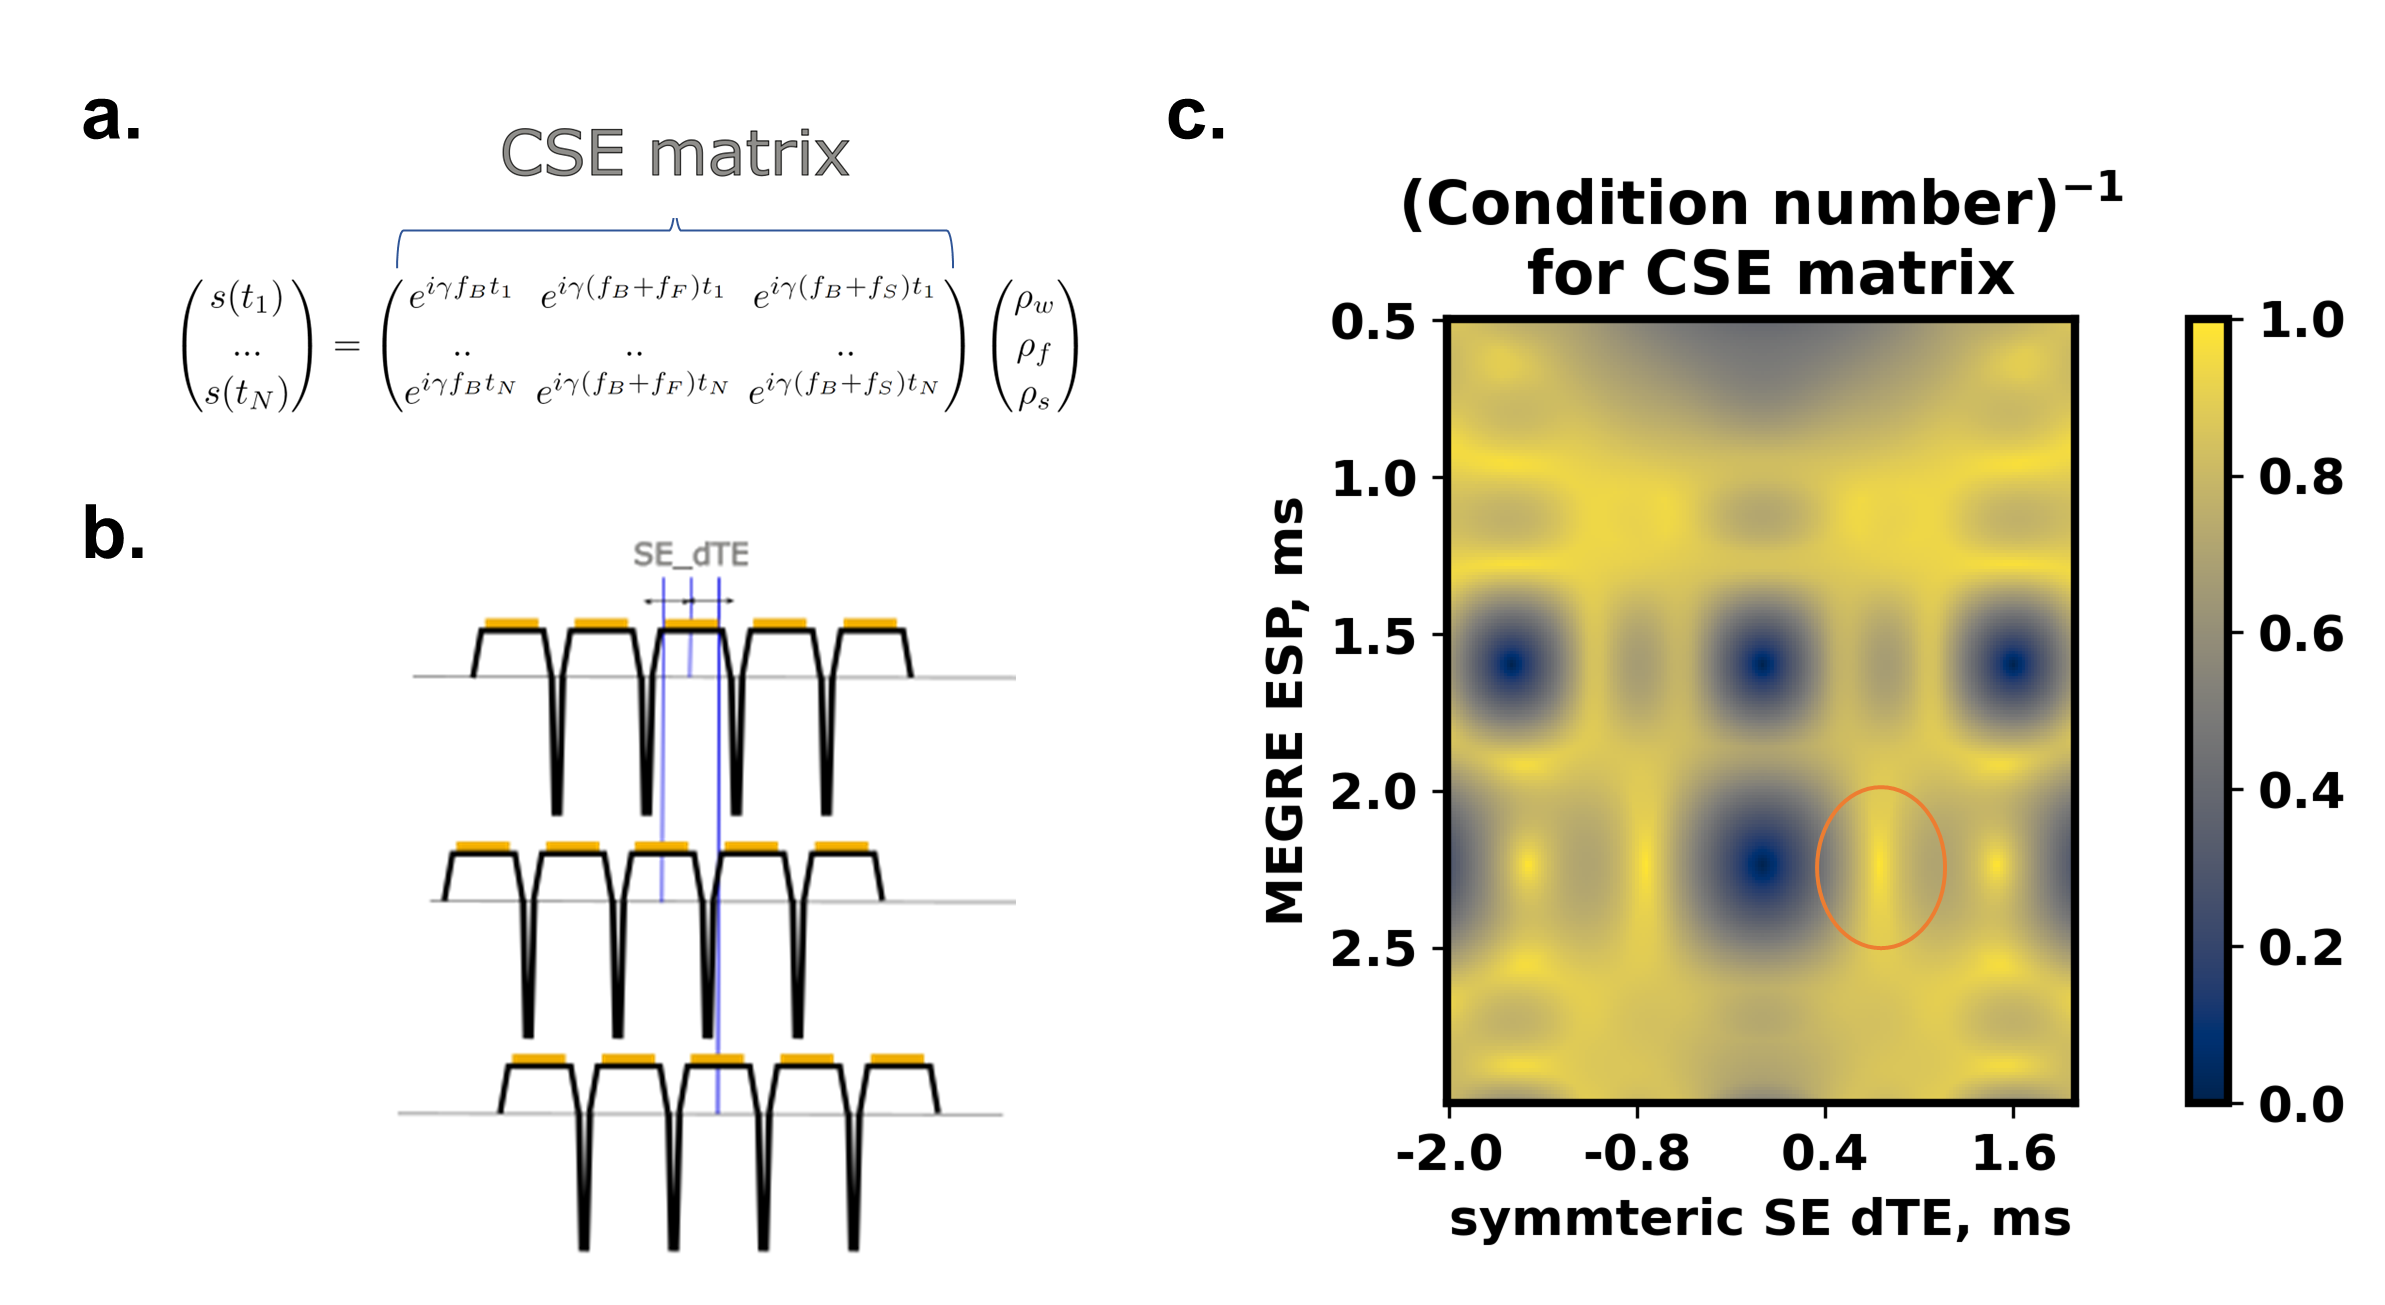
Acquisition: 2D multislice FSE sequence was modified to accommodate Dual-Interval Echo-Time (DIET) preparation and multi-echo gradient echo (MEGRE) readout. The sequence diagram is presented in Figure 1. Signal dephasing due to J-coupling between asymmetric hydrogen nuclei in fat tissue causes fat signal decay like that in Spin Echo sequences. Therefore, increasing the DIET_TE increases the T2-weighted contrast and reduces fat signal in images. MEGRE allowing for chemical-shift encoding was implemented with flyback rephasing at each spin echo to be robust to EPI phase errors. To achieve spectral FOV and resolution sufficient for water-fat-silicone separation, we acquired three interleaved multi-echo readouts with shifted spin echo. The choice of both the spin echo shifts (SE_dTE) and MEGRE_ESP was based on the inverse condition number calculations with single-peak fat and silicone models presented in Figure 2.Chemical shift encoding problem conditioning5 was assessed with three echo set interleaves by changing MEGRE_ESP from 0.5 to 3.0 ms and SE_dTE from -2.0 to 2.0 ms. Based on the results in Figure 2, SE_dTE was chosen 0.8 ms with MEGRE_ESP = 2.4 ms.
Data processing: Multi-echo images were reconstructed using SENSE6 with the coil sensitivities estimated at the spin echo using ESPIRIT7. Water-fat-silicone separation and field mapping was performed using the open-source hmrGC library8. One iteration of field mapping, separation and R2 prime mapping was run with a silicone peak model at -4.4 ppm and a multi-peak fat model9.
Experiments: Three healthy volunteers with a silicone implant placed adjacent to the breast and two volunteer patients with silicone implants were imaged at 3T (Signa Premier, GE Healthcare) with the following scan parameters: FOV = 360*360 mm, 1.4 mm in-plane and 5 mm slice thickness, FSE_ESP = 16 ms, FSE_ETL = 8, TR = 3 s. Five gradient echoes were acquired with MEGRE_ESP = 2.4 ms. The spin echo was shifted by FSE_dTE = [-0.8, 0., 0.8] ms correspondingly between the three interleaves. Parallel imaging R=2. The total scan time for three time-interleaved DIET MEGRE FSE acquisitions with 15 slices was approximately 3 mins.
2D axial T2-weighted STIR as well as STIR Water-suppressed clinical sequences with TE = 30 ms were acquired as reference.
Results
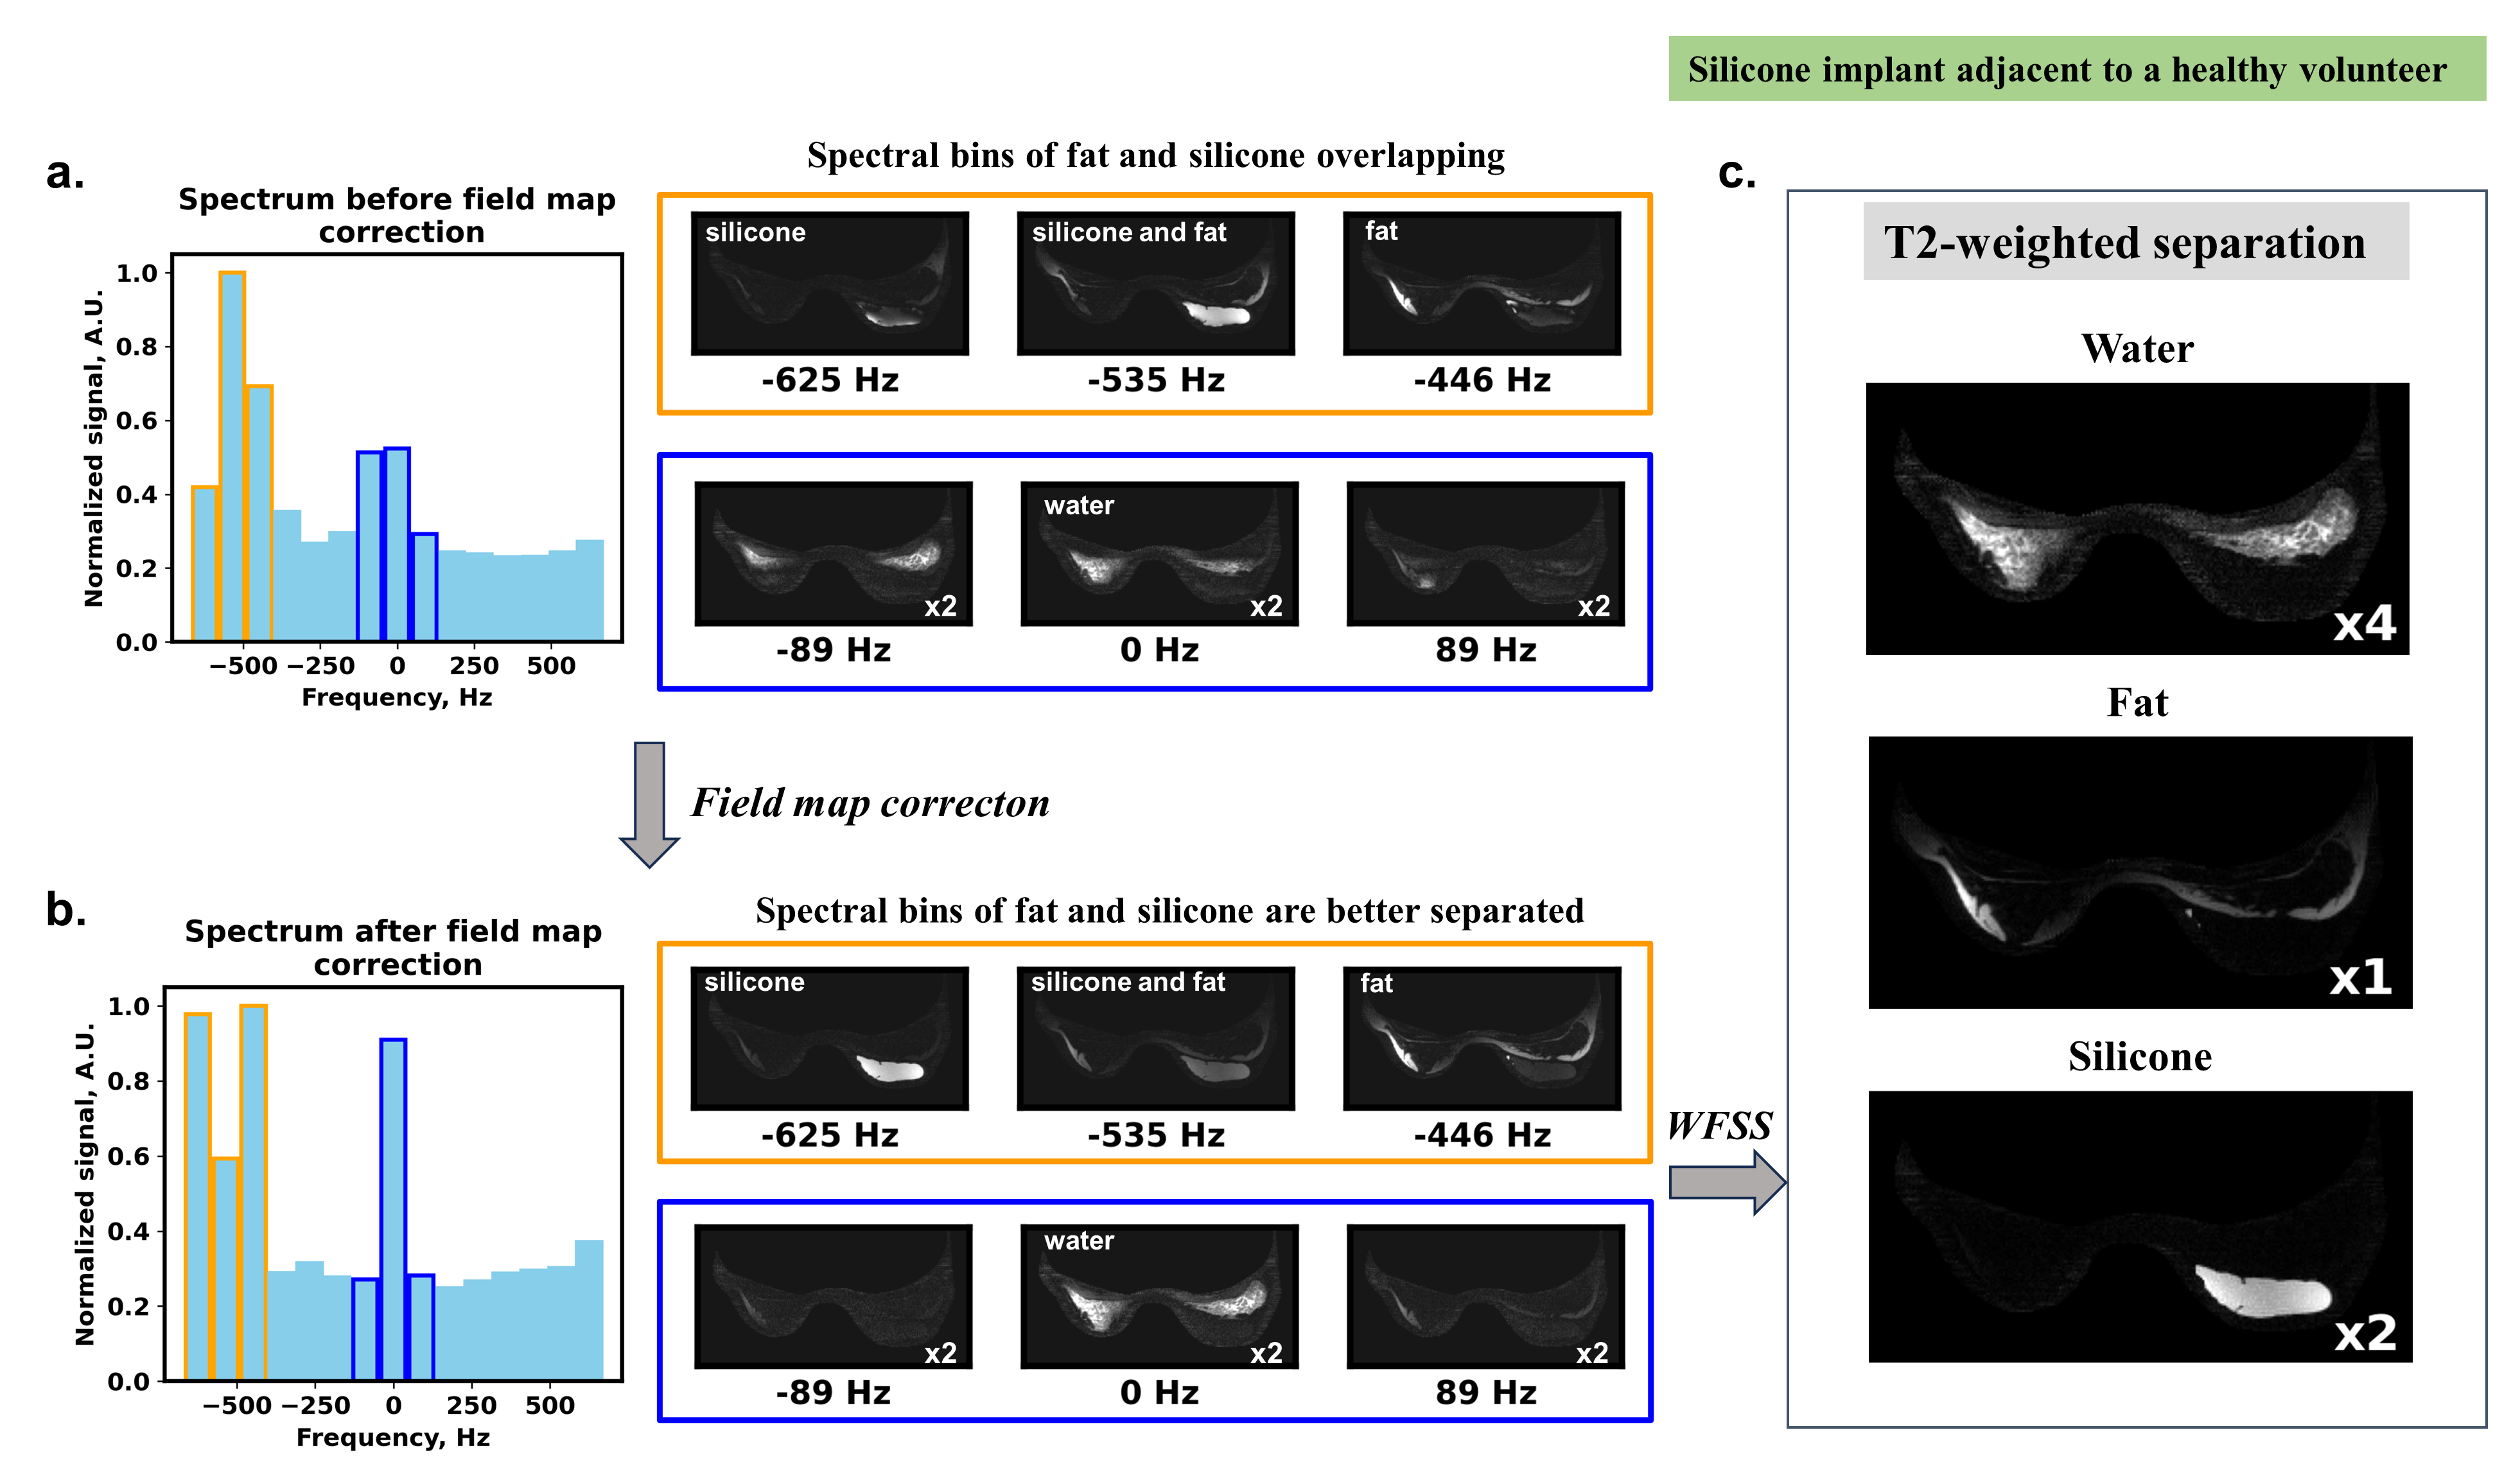
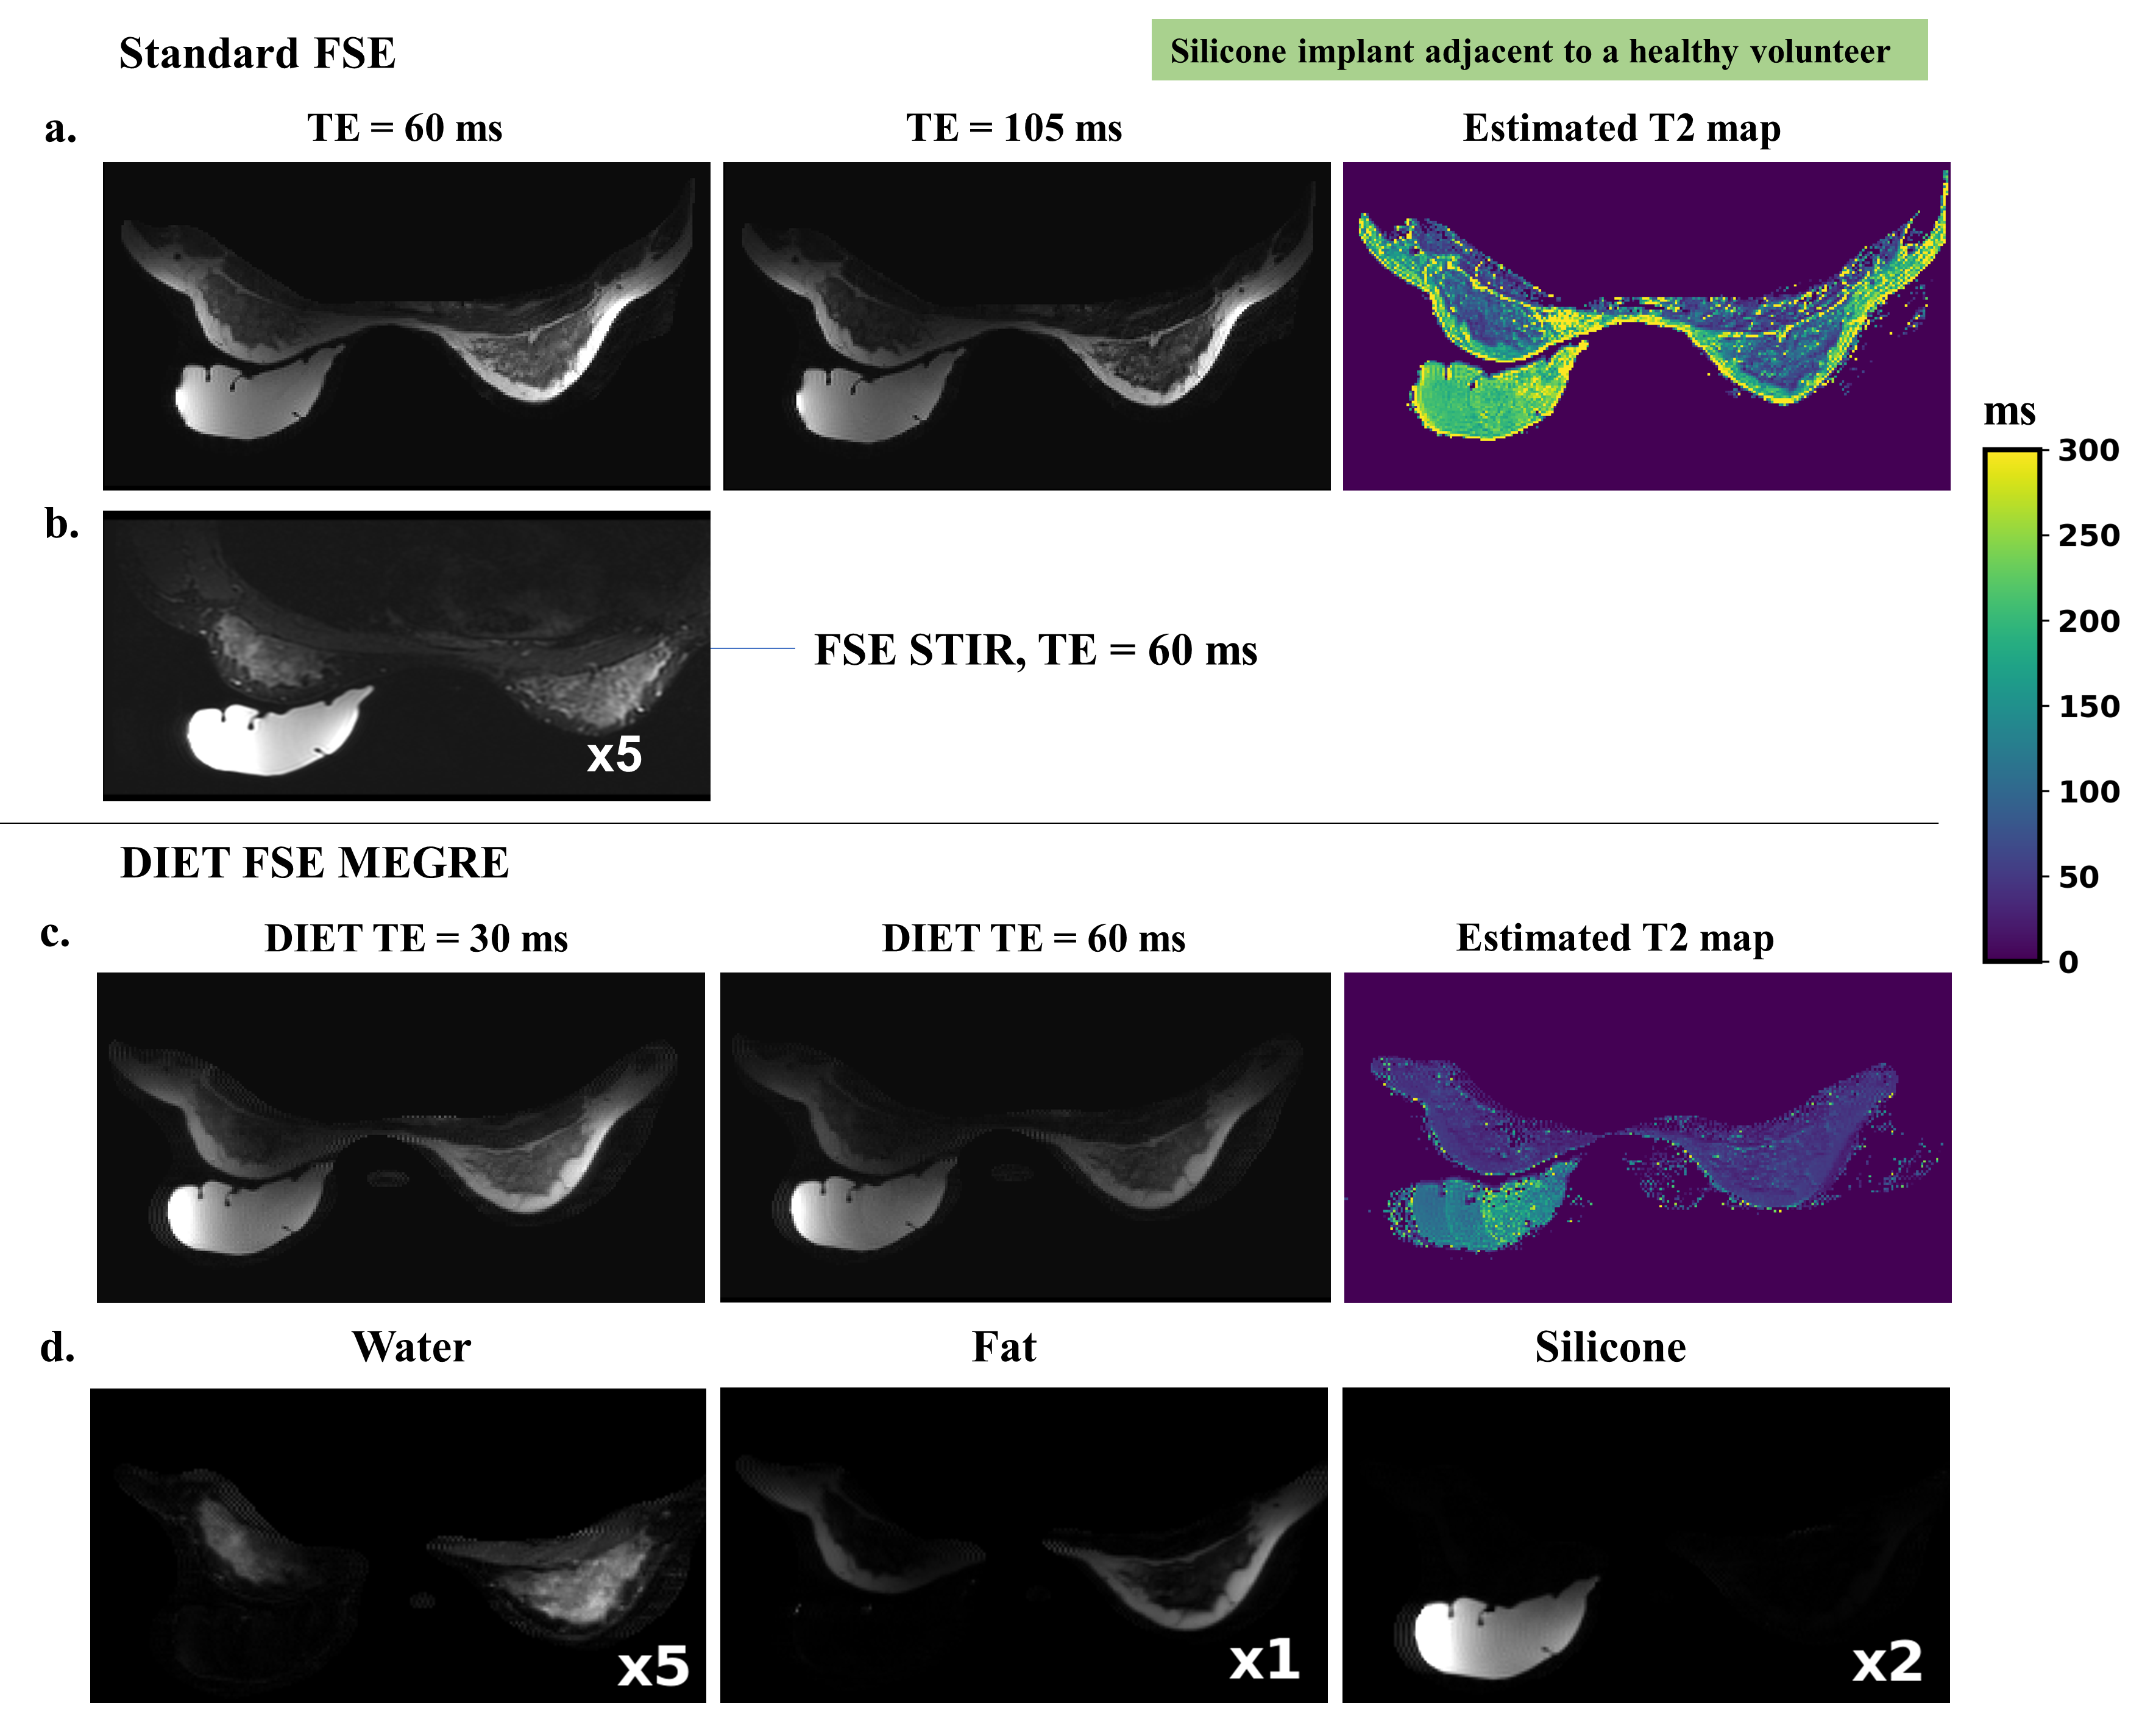
Figure 3 demonstrates spectral distribution and spectral images from the DIET MEGRE FSE scan before and after the field map correction. The field map estimation and demodulation in b) narrows the water peak at 0 Hz and allows the fat and silicone peaks to be better distinguished.T2-weighted water-fat-silicone separation is shown in c). Figure 4 presents contrast for all species with the standard T2-weighted FSE (a) versus the DIET FSE (c) at effective TEs of 70 and 100 ms for both sequences. The rightmost column with rough estimates of T2 maps from two TE times indicates faster T2 decay of fat compared to silicone for DIET FSE. Figures b) and d) highlight weighting of water with FSE and DIET FSE correspondingly, and d) shows the WFSS results.
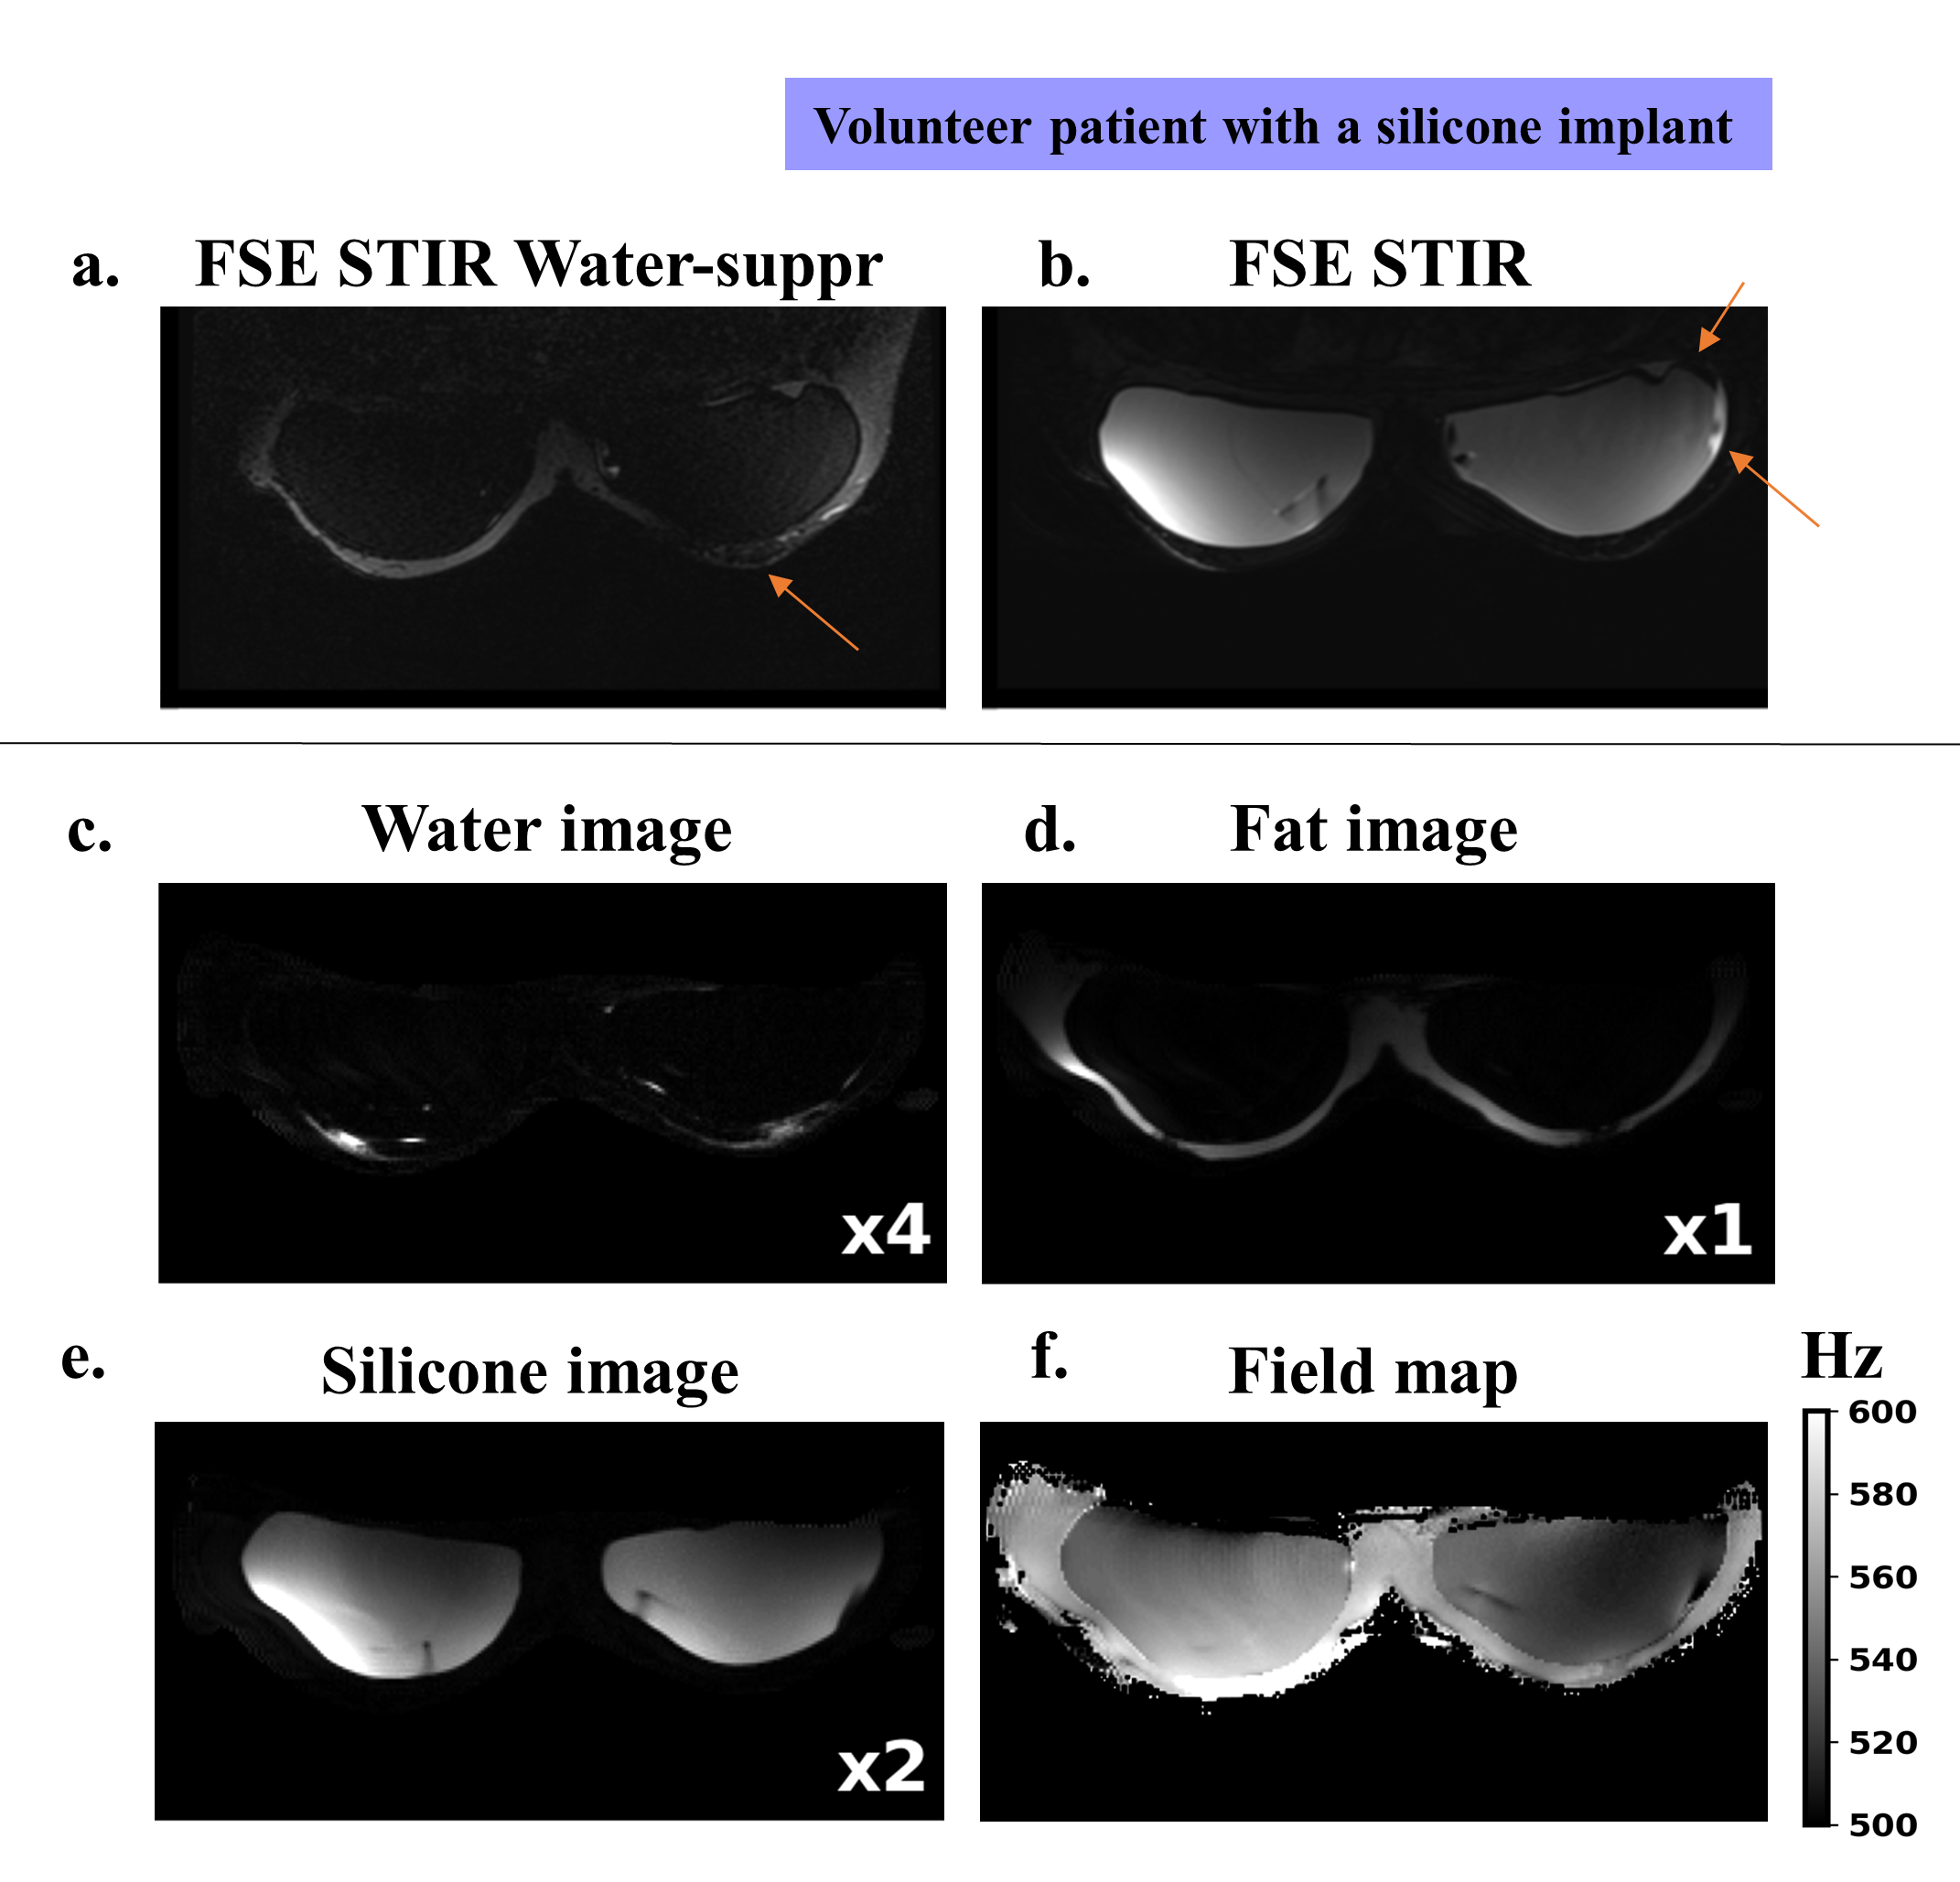
Figure 5 shows silicone(-water) specific standard images (a-b) versus our T2-weighted WFSS (c-e) in a patient with a silicone implant.
Conclusion/Discussion
We presented a 2D acquisition method for T2-weighted imaging with improved contrast between species and robust water-fat-silicone separation using DIET-prepared FSE with MEGRE readout. T2-weighting of the obtained water images is comparable to FSE STIR from the clinical protocols. The method has potential to replace at least two sequences in the current protocols in comparable time, but the scan time could be further reduced by acquiring less gradient echoes and doing more parallel imaging. Investigation of the R2prime modulation with DIET and its potential applications are in progress, as well as possible extension of the sequence to 3D.Acknowledgements
Research support from GE Healthcare. NIH R01-EB009055, NIH R01-CA249893. Karolinska Neuro MR Physics group for pulse programming assistance.References
- Noreña-Rengifo, B. D., Sanín-Ramírez, M. P., Adrada, B. E., Luengas, A. B., de Vega, V. M., Guirguis, M. S., & Saldarriaga-Uribe, C. (2022). MRI for Evaluation of Complications of Breast Augmentation. Radiographics, 42(4), 929–946. https://doi.org/10.1148/rg.210096
- Reeder, S. B., Wen, Z., Yu, H., Pineda, A. R., Gold, G. E., Markl, M., & Pelc, N. J. (2004). Multicoil Dixon Chemical Species Separation with an Iterative Least-Squares Estimation Method. Magnetic Resonance in Medicine, 51(1), 35–45. https://doi.org/10.1002/mrm.10675
- Stelter, J. K., Boehm, C., Ruschke, S., Weiss, K., Diefenbach, M. N., Wu, M., Borde, T., Schmidt, G. P., Makowski, M. R., Fallenberg, E. M., & Karampinos, D. C. (2022). Hierarchical Multi-Resolution Graph-Cuts for Water-Fat-Silicone Separation in Breast MRI. IEEE Transactions on Medical Imaging, 41(11), 3253–3265. https://doi.org/10.1109/TMI.2022.3180302
- Stables, L. A., Kennan, R. P., Anderson, A. W., Constable, R. T., & Gore, J. C. (1999). Analysis of J Coupling-Induced Fat Suppression in DIET Imaging. http://www.idealibrary.com Reeder, S. B., Pineda, A. R., Wen, Z., Shimakawa, A., Yu, H., Brittain, J. H., Gold, G. E., Beaulieu, C. H., & Pelc, N. T. (2005).
- Iterative decomposition of water and fat with echo asymmetry and least-squares estimation (IDEAL): Application with fast spin-echo imaging. Magnetic Resonance in Medicine, 54(3), 636–644. https://doi.org/10.1002/mrm.20624
- Pruessmann, K.P., Weiger, M., Scheidegger, M.B. and Boesiger, P. (1999), SENSE: Sensitivity encoding for fast MRI. Magn. Reson. Med., 42: 952-962. https://doi.org/10.1002/(SICI)1522-2594(199911)42:5<952::AID-MRM16>3.0.CO;2-S
- Uecker M, Lai P, Murphy MJ, Virtue P, Elad M, Pauly JM, Vasanawala SS, Lustig M. ESPIRiT--an eigenvalue approach to autocalibrating parallel MRI: where SENSE meets GRAPPA. Magn Reson Med. 2014 Mar;71(3):990-1001. doi: 10.1002/mrm.24751. PMID: 23649942; PMCID: PMC4142121.
- SigPy MRI signal processing package: https://github.com/mikgroup/sigpy hmrGC: Hierarchical multi-resolution graph-cuts for water–fat(–silicone) separation https://github.com/BMRRgroup/fieldmapping-hmrGC
- Hamilton G, Yokoo T, Bydder M, Cruite I, Schroeder ME, Sirlin CB, Middleton MS. In vivo characterization of the liver fat ¹H MR spectrum. NMR Biomed. 2011 Aug;24(7):784-90. doi: 10.1002/nbm.1622. Epub 2010 Dec 12. PMID: 21834002; PMCID: PMC3860876.
Figures