0850
Developing a body composition protocol on a commercial 0.55T MRI system1Biomedical Engineering Department, School of Biomedical Engineering & Imaging Sciences, King's College London, London, United Kingdom, 2Guy’s and St Thomas’ NHS Foundation Trust, London, United Kingdom, 3Centre for the Developing Brain, School of Biomedical Engineering and Imaging Sciences, King’s College London, London, United Kingdom, 4Research Centre for Optimal Health, School of Life Sciences, University of Westminster, London, United Kingdom, 5Department of Twin Research and Genetic Epidemiology, King's College London, London, United Kingdom
Synopsis
Keywords: Screening, Low-Field MRI, Body Composition
Motivation: Body composition MRI is well established at 1.5T. However there is limited work at low-field where there is growing interest, particularly with increased accessibility of ultra-wide bore systems.
Goal(s): Demonstrate the feasibility of body composition MRI on a 0.55T (80cm) system, and present optimised sequence parameters suitable for large-scale studies.
Approach: Dixon and liver T1 and T2*/PDFF scans were optimised iteratively by scanning subjects with a range of BMIs at 0.55T using ultra-flexible receive-array coils.
Results: Body composition MRI has been demonstrated on a commercial 0.55T system. Image quality was sufficient for utilisation of an analysis pipeline established for higher field.
Impact: Body composition MRI is feasible on a commercial 0.55T system, providing motivation for further protocol development. This generation of scanner presents an opportunity for more affordable and accessible MRI, with a wide bore suitable for imaging larger patients and participants.
Introduction
Body composition MRI allows for simultaneous measurement of fat distribution, alongside segmentation of tissue and organ volumes. The accuracy and reproducibility of this technique is well validated at 1.5T and 3T [1,2] through large scale longitudinal studies such as the UK Biobank [3]. However, there is limited data from modern low-field systems, that hold potential for more accessibility and benefit from recent advances in MRI technology [4].The MAGNETOM Free.Max (Siemens Healthcare, Erlangen, Germany) is a 0.55T, wide bore (80cm) system with a lower specification gradient system (45T/m/s) compared to the current clinical standard. The feasibility of body composition profiling has not yet been demonstrated on a commercially available 0.55T system; only on a ramped down higher performance 1.5T system [5]. In this work, we describe an optimised body composition protocol on the Free.Max and compare it with an established protocol at 1.5T.
Methods
Neck-to-knee two-point Dixon volumetric interpolated breath-hold examination (VIBE), multi-echo gradient echo (MEGE) and modified look-locker imaging (MOLLI) sequences were optimised at 0.55T. Six healthy volunteers (mean age 29.3 ± 6.3 [25-43] years and BMI 24.0 ± 4.1 [20.2-32.8] kg/m2) were scanned with two, six-element Contour-L coils. All volunteers provided informed written consent.Dixon images were acquired as a series of overlapping slabs at fixed table locations and two coil orientations were tested (Figure 1). Slab thickness, overlap and oversampling, alongside resolution, were optimised iteratively to achieve acquisition within a breath-hold, whilst maintaining sufficient SNR. With in- and out-of-phase echo times inherently longer at 0.55T, data was acquired at the minimum and out-of-phase echo times [6]. Flip angle was selected according to previous work at 0.55T [5]. GRAPPA and CAIPIRINHA acceleration methods were considered to reduce acquisition time. An established analysis pipeline was used to segment major tissues and organs [7].
MEGE echo times were adjusted to efficiently sample the signal decay. A graph cut algorithm was employed to generate water, fat, PDFF and T2* images [8]. Various MOLLI schemes were investigated in the T1MES phantom [9], for a range of simulated heart rates (40-100bpm). T1 maps were generated online at the scanner.
Data were also acquired using the UK Biobank protocol [3] imported onto a newer 1.5T system (MAGNETOM Sola, Siemens Healthcare, Erlangen, Germany). For one healthy volunteer tissue volumes as measured at 0.55T were compared to those at 1.5T [3].
Results and Discussion
Optimised sequence parameters are shown in Figure 2.The final Dixon protocol collected nine equally sized slabs. CAIPIRINHA allowed for higher acceleration with less noise enhancement, resulting in a shorter breath-hold (14s) than with GRAPPA (17s). This also allowed for increased slab oversampling to avoid signal wrap in the slab direction. The first and last slabs were also acquired without acceleration to avoid artefacts associated with reduced coil coverage at the end volumes. The overall field of view in the head-foot direction was constrained by the table range.
Whilst having one coil in portrait orientation offers extended head-foot coverage, the landscape orientation provided better lateral coverage and higher signal in the subcutaneous fat and abdomen, which is favourable in larger patients.
Tissue volumes measured from four different protocols at 0.55T and the UK Biobank protocol at 1.5T were all comparable, for example the percentage difference of visceral fat volume was within 5% of the mean (Figure 3-4). The largest differences were for abdominal organs, where respiratory and cardiac motion has most impact. SNR was sufficient in all scenarios to run the analysis pipeline without modification, though further improvement in regional segmentation may come from pre-processing.
The MEGE sequence was acquired with the maximum number of echoes available (12). Echo spacing was such that three time points were captured per in-phase cycle generating T2* and PDFF maps (Figure 5). Representative liver T2* at 0.55T and 1.5T was 40.0±7.3 ms and 33.5±5.8 ms respectively.
Of the five MOLLI schemes tested, 4(3)3(3)2 and 5(3)3 were found to be the most robust across the range of heart rates investigated and provided the most accurate measure of T1. The 5(3)3 scheme was chosen given the shorter acquisition time. Representative liver T1 at 0.55T and 1.5T was 387.5±95.0 ms and 625.0±109.1 ms respectively.
Conclusion
A body composition protocol was developed on a commercial 0.55T system, from which tissue volume measurements were shown to be comparable to those from 1.5T data using a well-known large-scale study protocol. A MEGE and MOLLI sequence was also used to successfully measure PDFF and T1 respectively in the liver.Acknowledgements
This work was supported by the Chronic Disease Foundation, the Wellcome/EPSRC Centre for Medical Engineering [WT203148/Z/16/Z] and the National Institute for Health Research (NIHR) Clinical Research Facility based at Guy’s and St Thomas’ NHS Foundation Trust and King’s College London. The views expressed are those of the author(s) and not necessarily those of the NHS, the NIHR or the Department of Health and Social Care.
References
[1] Borga M, Ahlgren A, Romu T et al. Reproducibility and repeatability of MRI-based body composition analysis. Magn Reson Med. 2020; 84(6): 3146-3156.
[2] Borga M, West J, Bell JD et al. Advanced body composition assessment: from body mass index to body composition profiling. J Investig Med. 2018; 66(5): 1-9.
[3] Linge J, Borga M, West J et al. Body composition profiling in the UK Biobank imaging study. Obesity (Silver Spring). 2018; 26(11): 1785-1795.
[4] Hori M, Hagiwara A, Goto M et al. Low-field magnetic resonance imaging: Its history and renaissance. Invest Radiol. 2021; 56(11): 669-679.
[5] Nayak KS, Cui SX, Tasdelen B et al. Body composition profiling at 0.55T: Feasibility and precision. Magn Reson Med. 2023; 90(3): 1114-1120.
[6] Chandarana H, Bagga B, Huang C et al. Diagnostic abdominal MR imaging on a prototype low-field 0.55T scanner at two different gradient strengths. Abdom Radiol (NY). 2021; 46(12): 5772-5780.
[7] Liu Y, Basty N, Whitcher B et al. Genetic architecture of 11 organ traits derived from abdominal MRI using deep learning. eLife. 2021; 15(10): e65554.
[8] Hernando D, Kellman P, Haldar JP et al. Robust water/fat separation in the presence of large field inhomogeneities using a graph cut algorithm. Magn Reson Med. 2010; 63(1): 79-90.
[9] Captur, G., Gatehouse, P., Keenan, K.E. et al. A medical device-grade T1 and ECV phantom for global T1 mapping quality assurance—the T1 Mapping and ECV Standardization in cardiovascular magnetic resonance (T1MES) program. J Cardiovasc Magn Reson. 2016; 18(58).
Figures
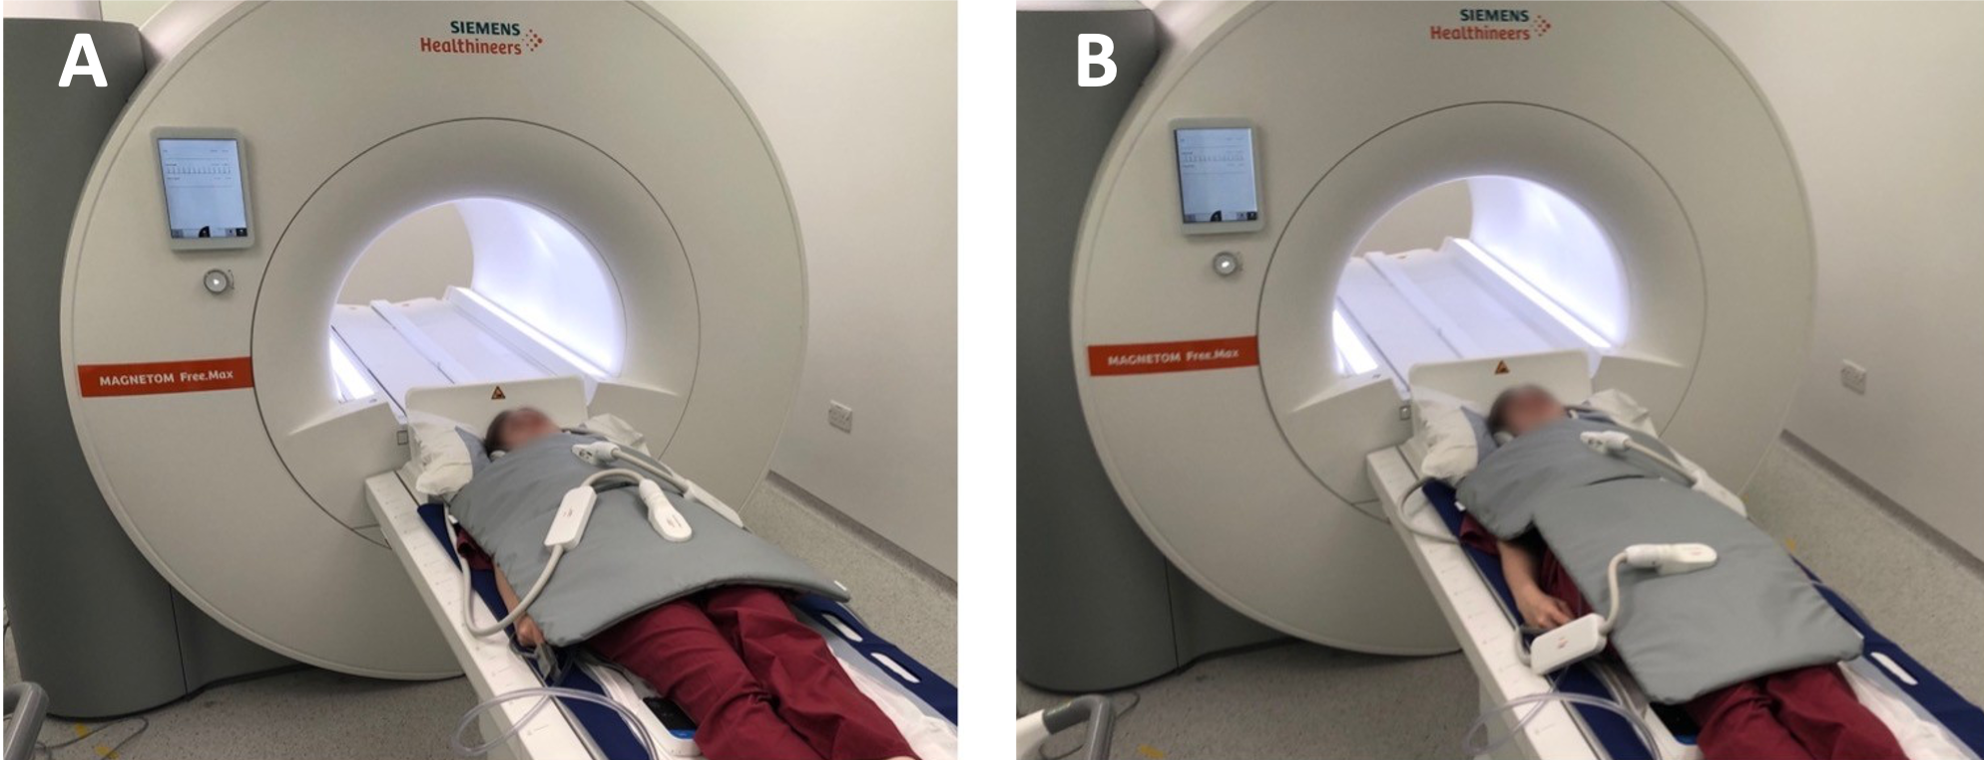
Figure 1: Two, six-element Contour L coils were used to acquire the two-point Dixon volumetric interpolated breath-hold examination (VIBE) sequence at 0.55T. The superior coil was positioned in landscape orientation. The inferior coil was positioned in both A) landscape and B) portrait orientation.
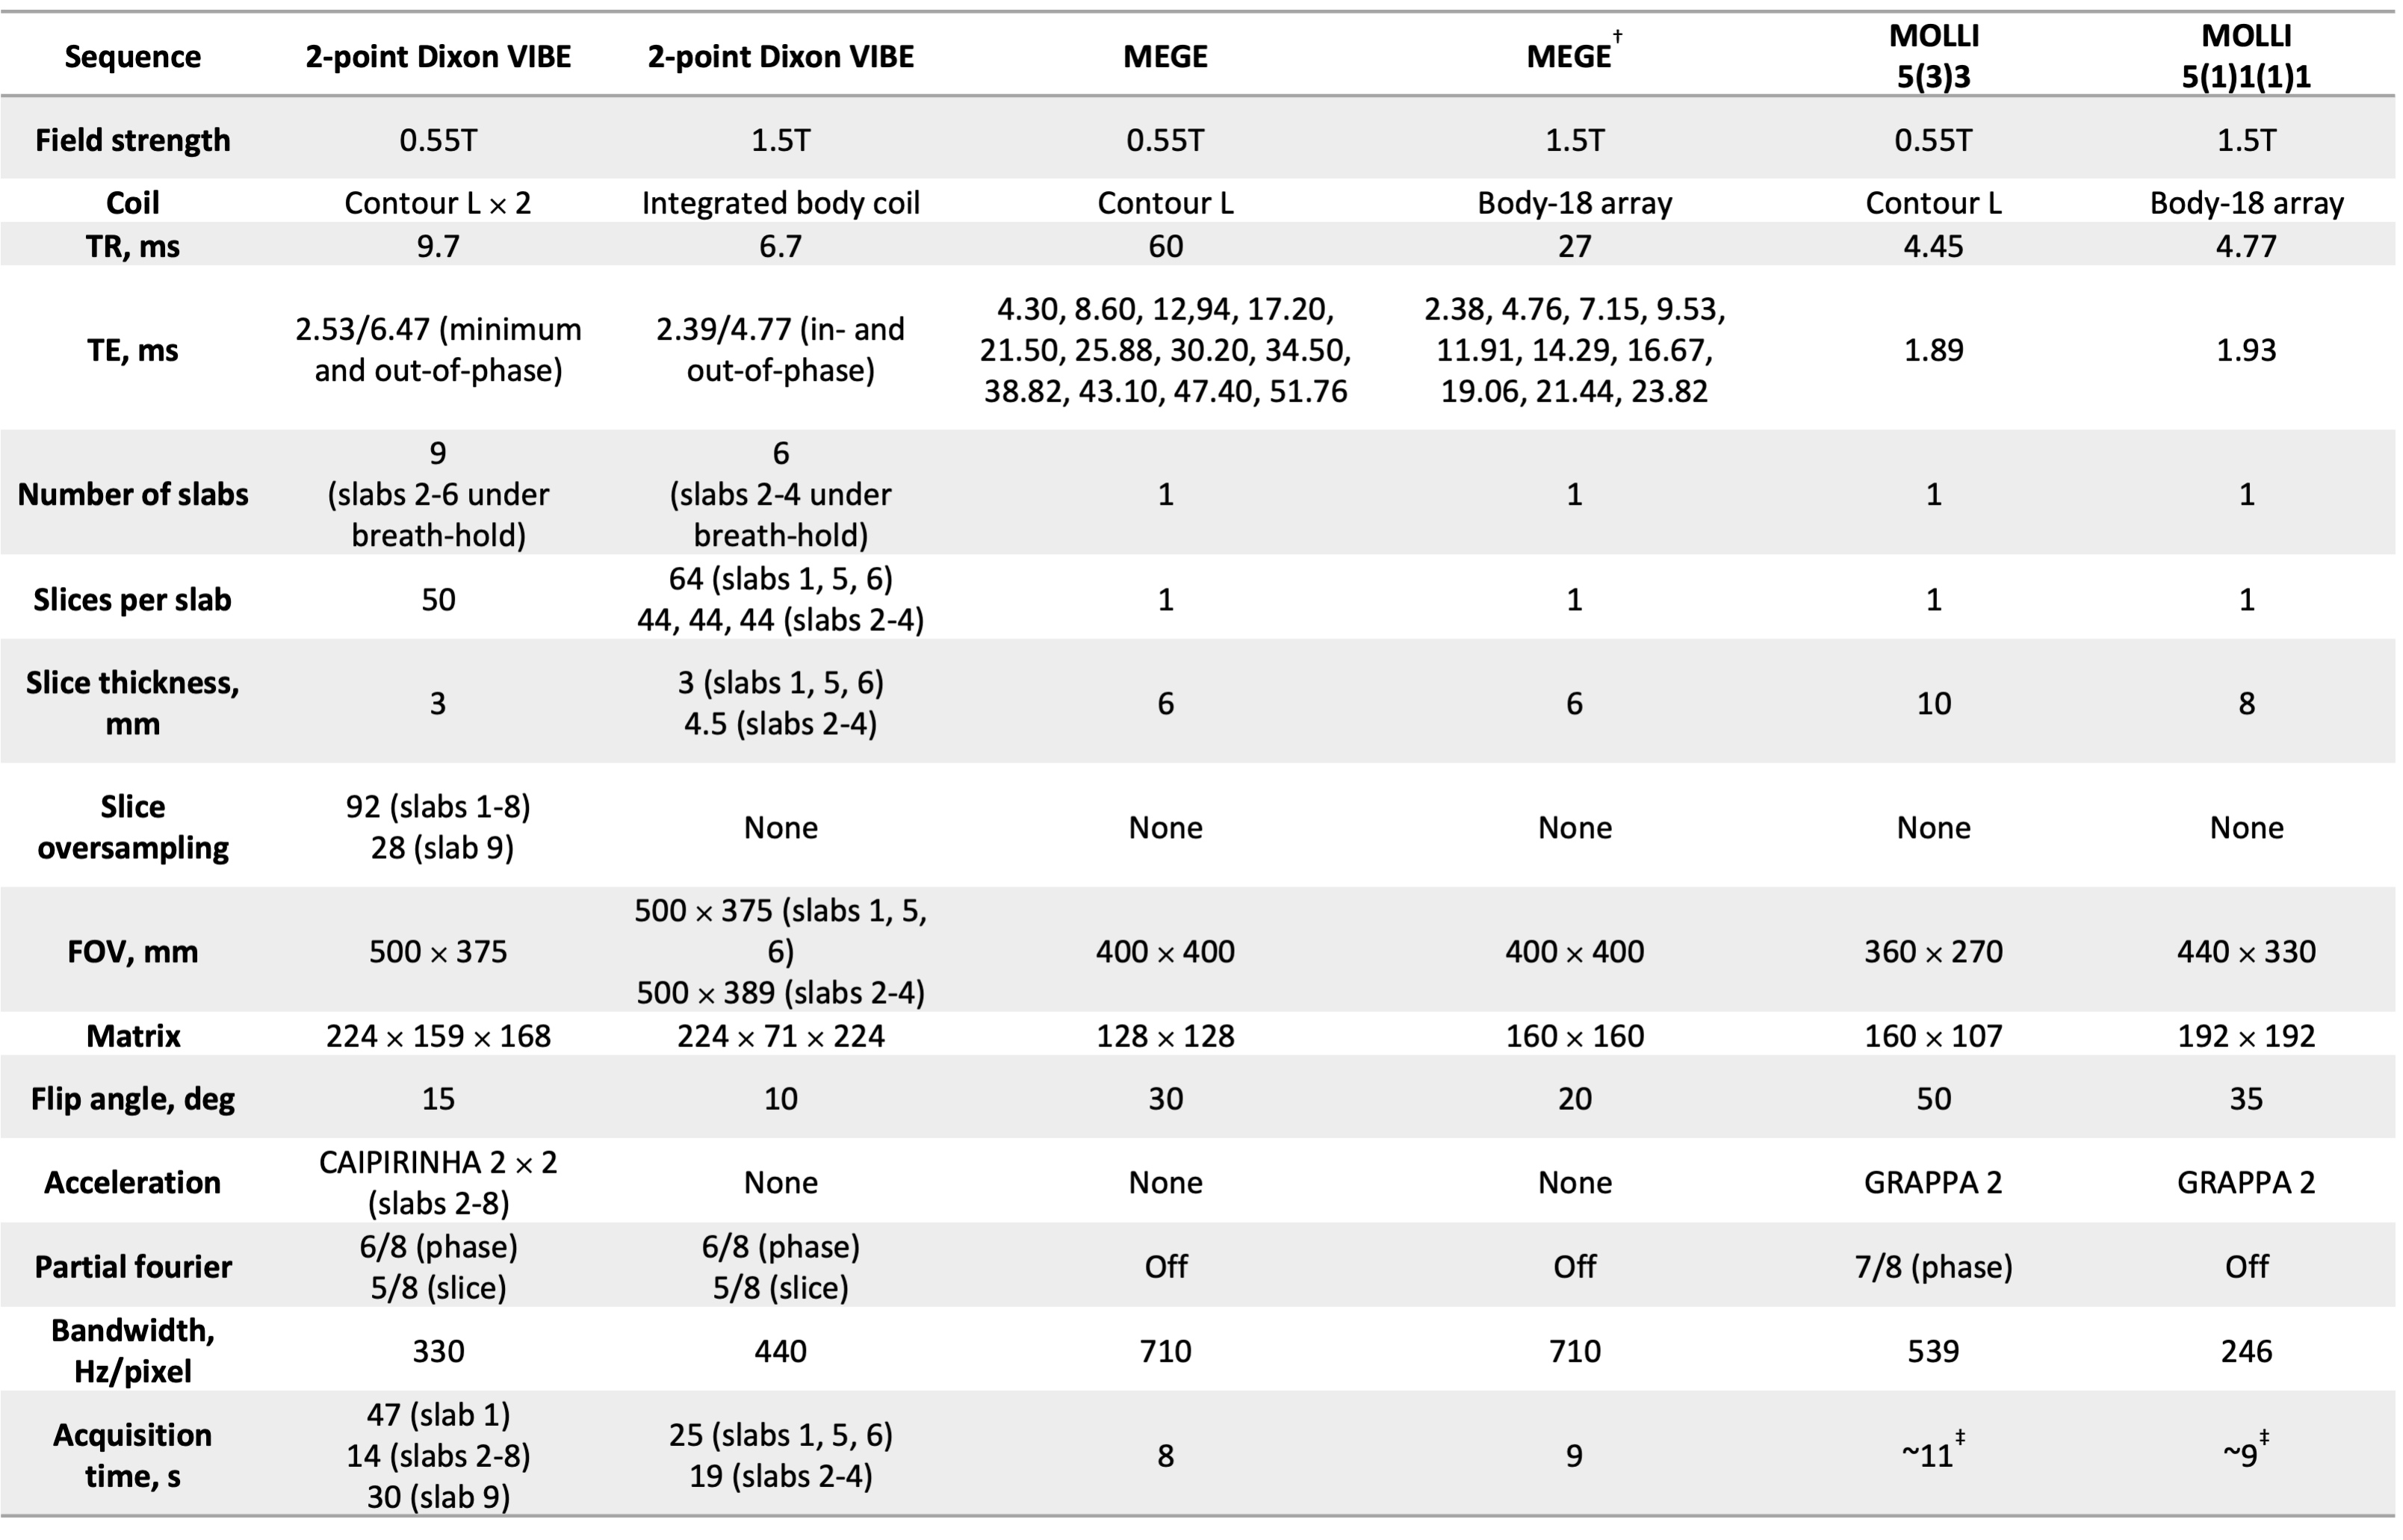
*two-fold GRAPPA was also investigated but four-fold CAIPIRINHA was considered to be optimal
†Historically acquired by UK Biobank
‡ assuming a typical heart rate of 60bpm
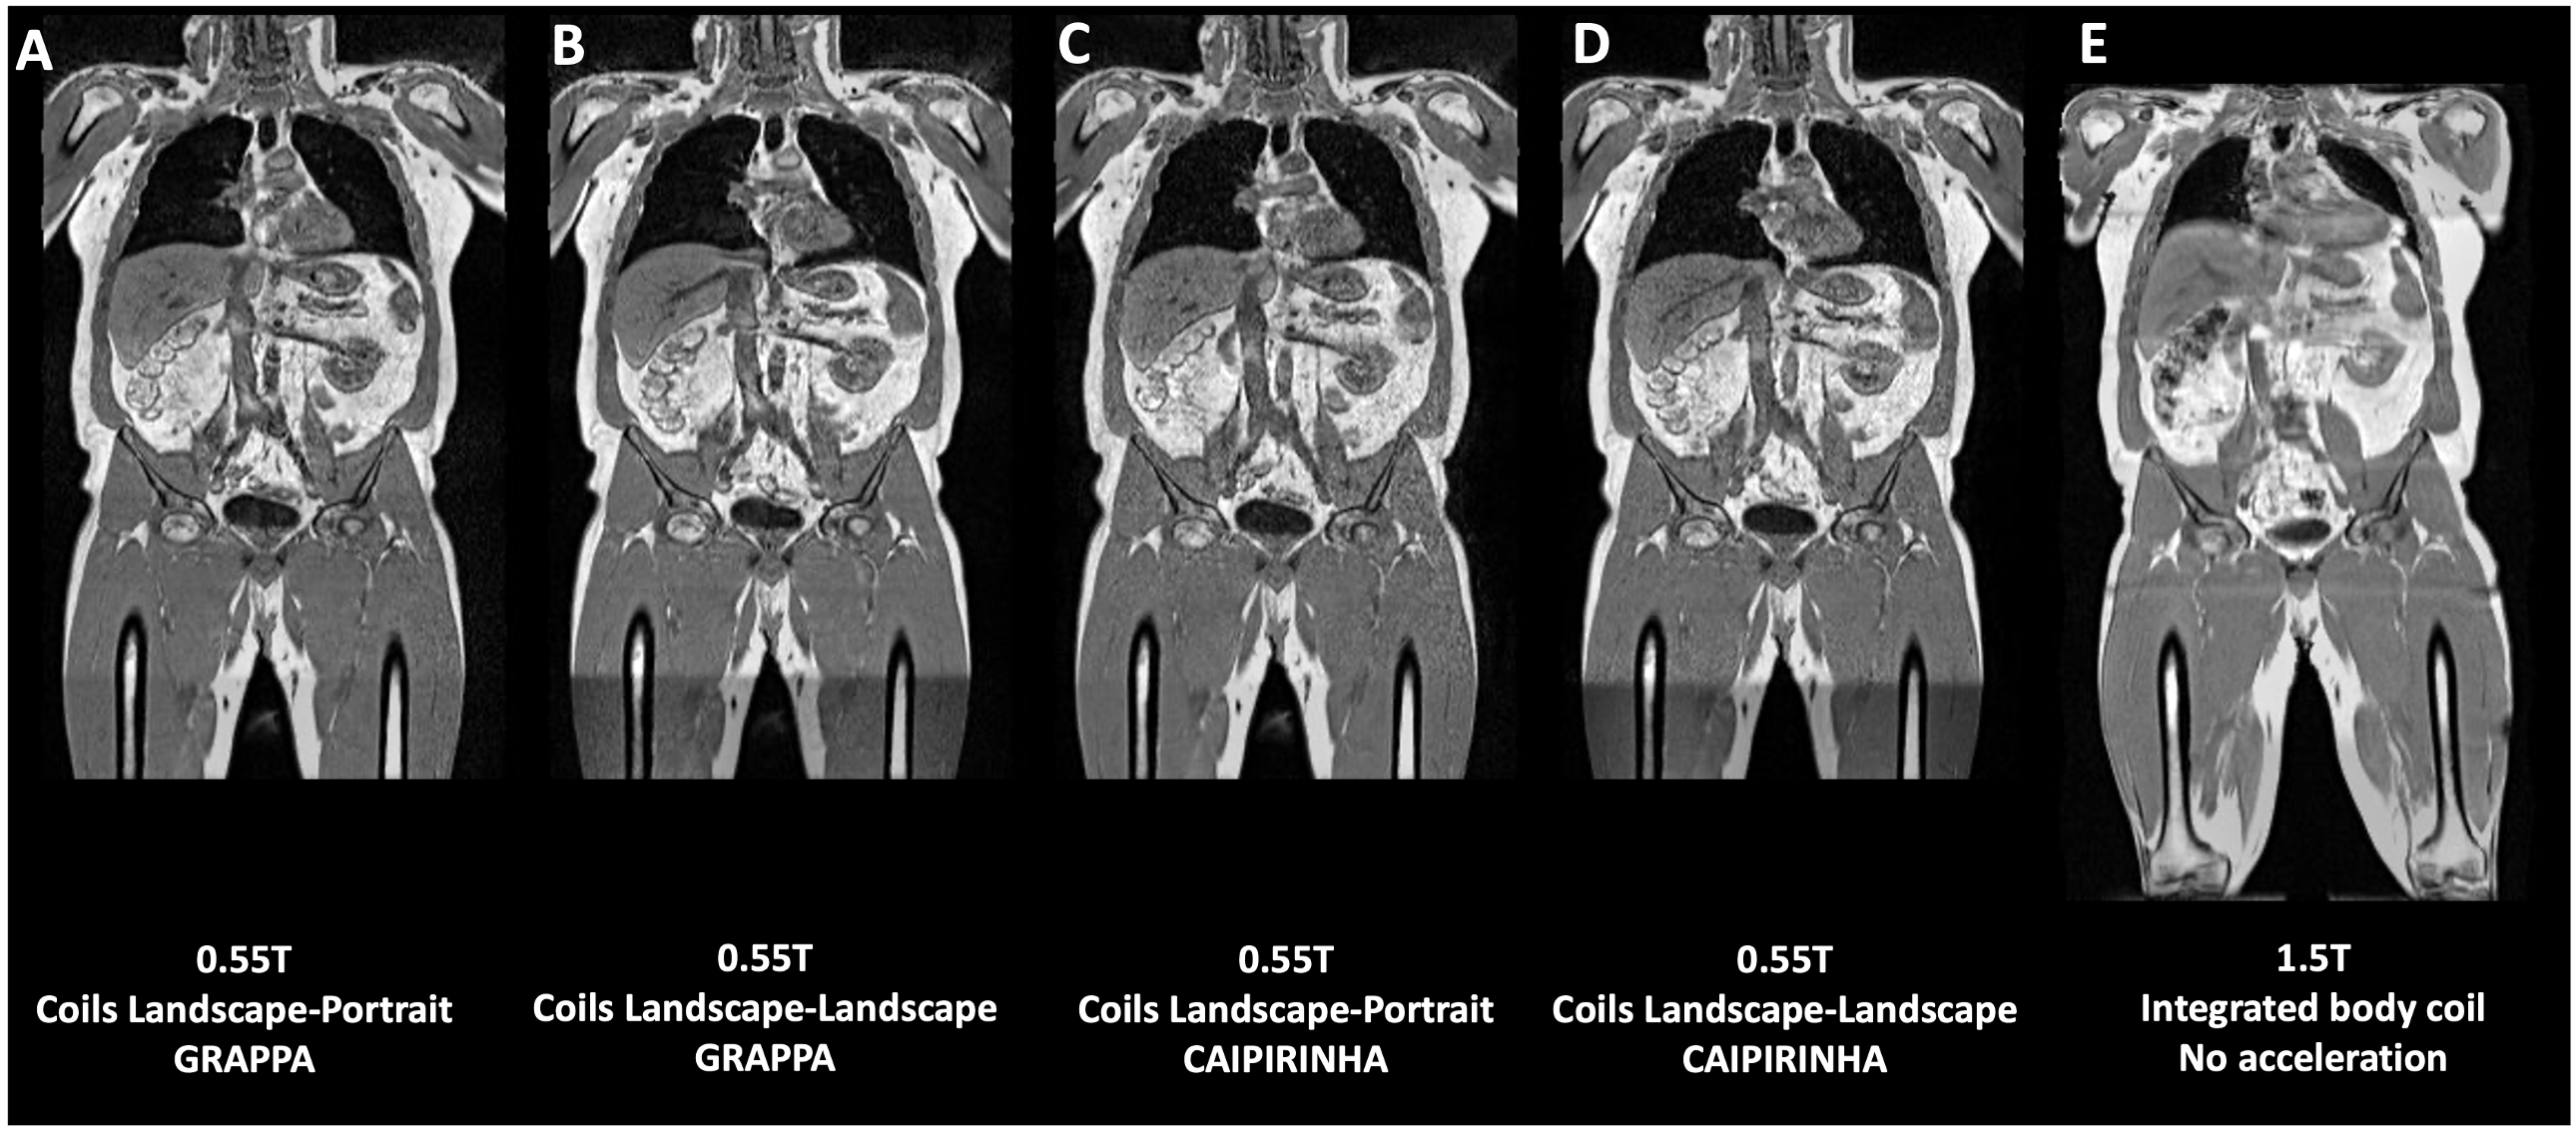
Figure 3: A-D) Two-point Dixon volume interpolated breath-hold examination (VIBE) data acquired at 0.55T with inferior coil in both landscape and portrait orientations and E) two-point Dixon VIBE data acquired at 1.5T.
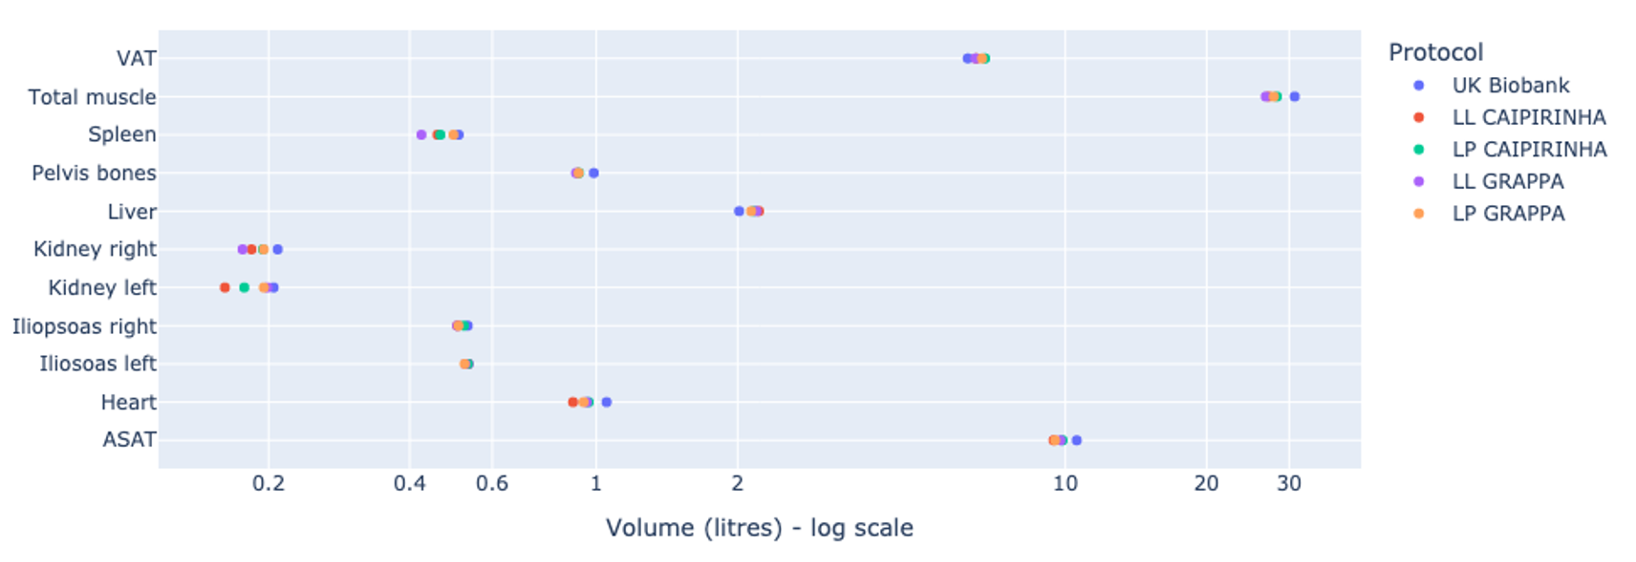
Figure 4: Volume of tissues and organs as measured from the two-point Dixon volumetric interpolated breath-hold examination (VIBE) data for four protocols tested at 0.55T and at 1.5T.
VAT = visceral adipose tissue, ASAT = abdominal subcutaneous adipose tissue, UK Biobank = 1.5T protocol, LL = inferior coil in landscape orientation, LP = inferior coil in portrait orientation.
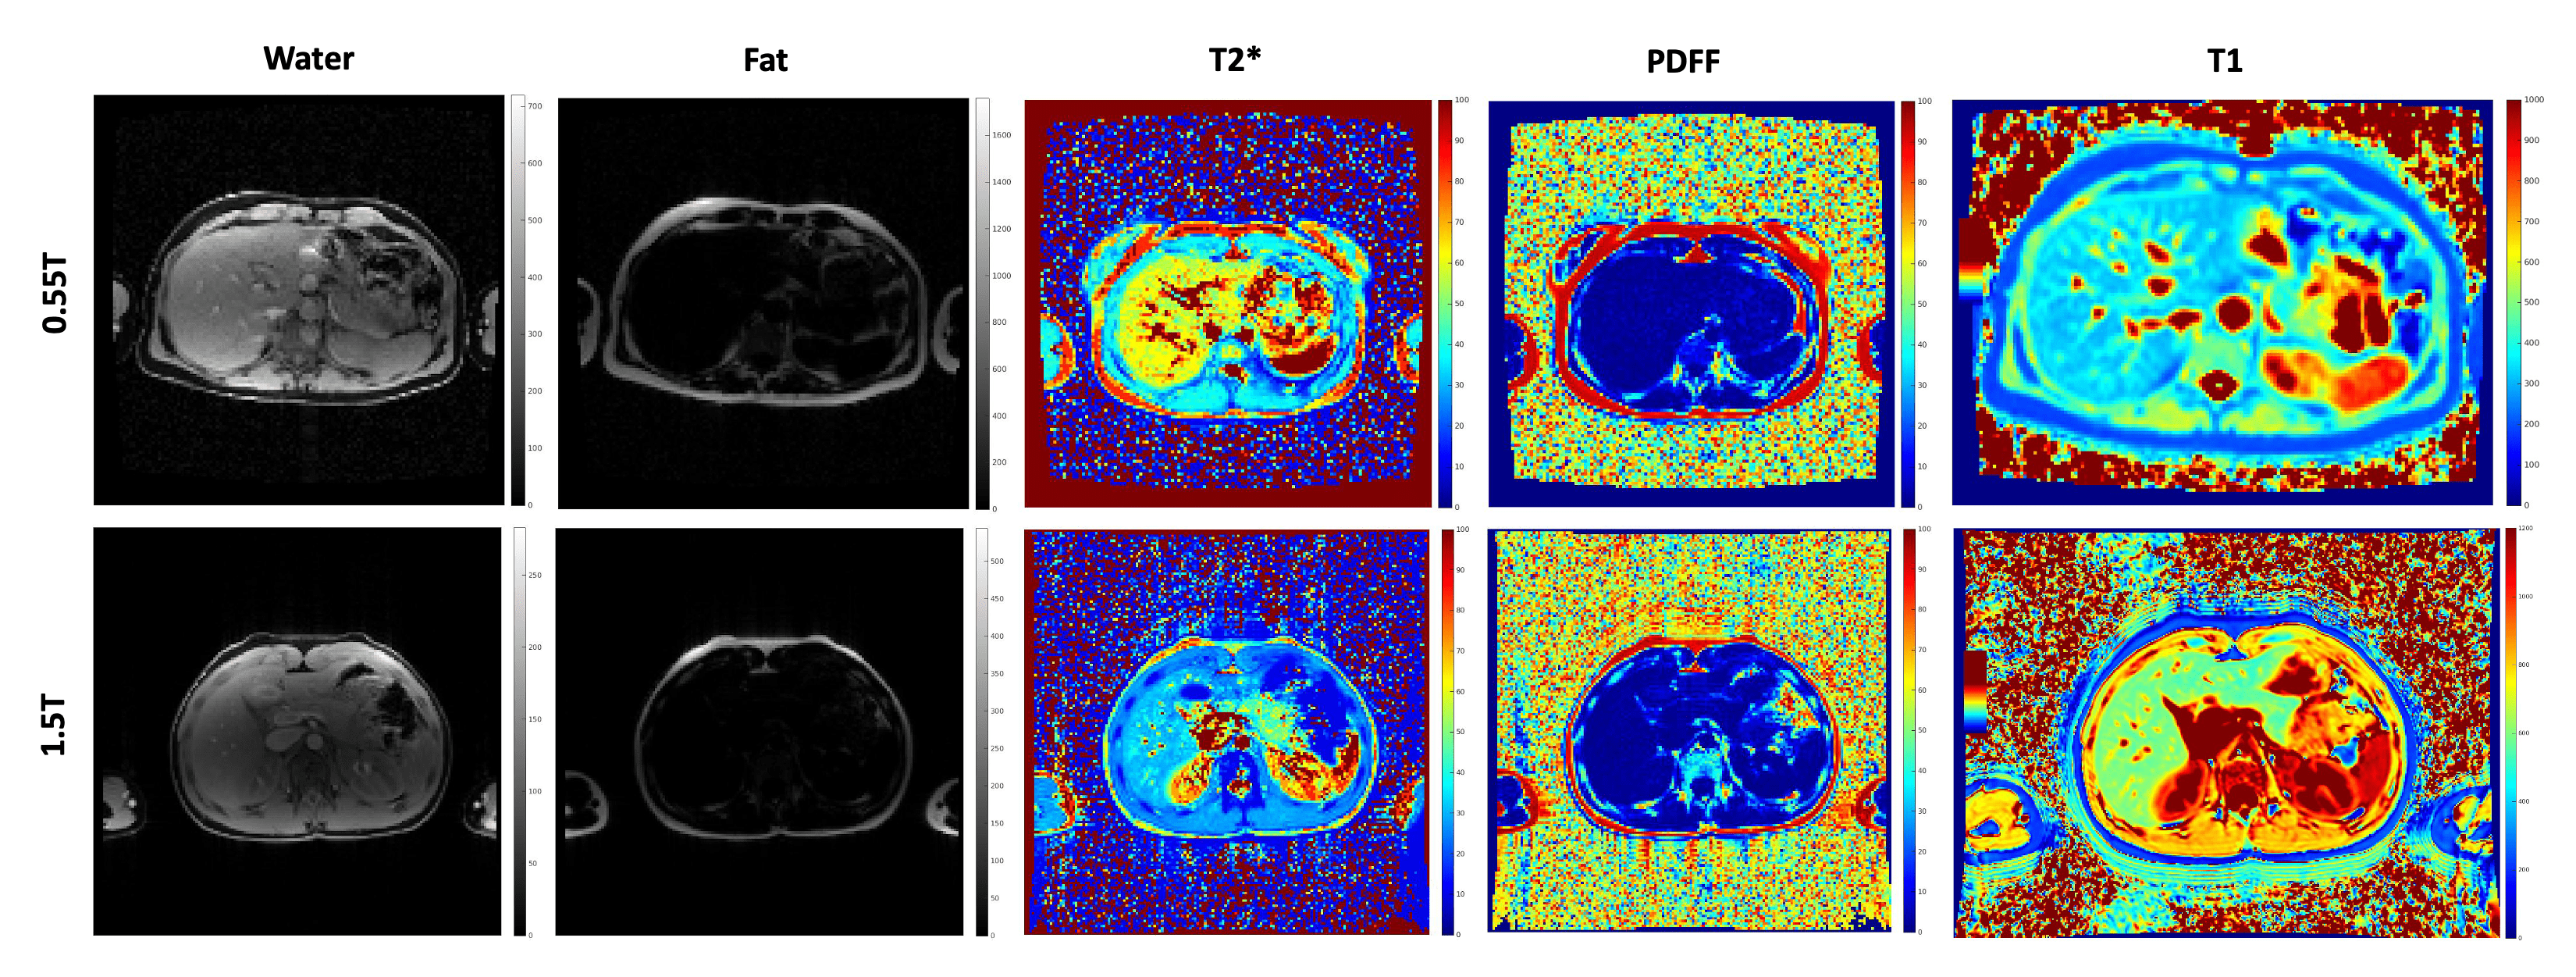
Figure 5: Images generated from multi-echo gradient echo (MEGE) and modified look-locker imaging (MOLLI) sequence data. Note that the 0.55T and 1.5T data were acquired on different participants. Mean T2* and PDFF as measured in the liver at 0.55T was 40.0±7.3 ms and 2.3±0.5% and at 1.5T was 33.5±5.8 ms and 2.7±0.8%. Mean T1 as measured in the liver was 387.5±95.0 ms and 625.0±109.1 ms at 0.55T and 1.5T respectively.