0849
In-vivo measurement of hepatic lipid composition with J-difference-editing-MRS1College of Biomedical Engineering & Instrument Science, Zhejiang University, Hangzhou, China, 2Department of Endocrinology, School of Medicine, Sir Run Run Shaw Hospital, Zhejiang University, Hangzhou, China, 3Hangzhou Institute of Medicine, Chinese Academy of Sciences, Hangzhou, China, 4MR Collaboration, Siemens Healthcare Ltd, Shanghai, China
Synopsis
Keywords: Liver, Metabolism, Lipid composition; J-difference-edited-MRS
Motivation: Hepatic lipid composition is important for diagnosis and prognosis of many hepatic diseases and for studying lipid metabolism.
Goal(s): This study aimed to apply J-difference-edited-MRS (JDE-MRS) for better measurement of hepatic lipid composition and evaluated its effectiveness in detecting lipid profile changes among metabolic disorders.
Approach: Hepatic lipid composition was measured and compared among healthy, NAFLD and T2DM human subjects using JDE-MRS under 3T, as well as among normal, obese and T2DM rat models using conventional MRS under 7T.
Results: The JDE-MRS application in human liver is reliable and the results shows differences between different groups, with similar results in rats.
Impact: This study demonstrates the feasibility of applying JDE-MRS in human liver, which can be used to quantify hepatic unsaturated lipid profile and can provide a reliable biomarker for clinical investigations of lipid metabolism in hepatic diseases.
Introduction
Hepatic fat accumulation is strongly linked to insulin resistance, diabetes mellitus type 2 (T2DM) and cardiovascular disease1,2. Compared with total fat content, lipid composition in liver seems to reveal the progression of hepatic steatosis3,4. In vivo hepatic lipid measurements have been widely performed using 1H-MRS5, but the spectrum quantification is not accurate enough due to the low signals of unsaturated fat and overlapping with other neighboring peaks6. J-difference-edited-MRS (JDE-MRS) helps eliminate interference from overlapping peaks, but is more demanding on measurement conditions7,8. This study aims to validate the feasibility of applying JDE-MRS in human hepatic lipid composition measurements and comparing hepatic fat unsaturation degree between healthy, NAFLD and T2DM groups.Methods
In vivo Experiment: In vivo experiments were conducted on Siemens MAGNETOM Prisma 3T MRI scanners. A total of 37 recruited adults underwent NAFLD and T2DM screening to be classified into three groups: healthy controls (HC), NAFLD, and T2DM with NAFLD. JDE-MRS were performed using MEGA-PRESS sequence with parameters: TR = 2000 ms; TE = 45 ms; spectral width = 2 kHz; voxel size = 25 × 40 × 40 mm3; 128 transients and 2048 datapoints; edited-pulse bandwidth: 115 Hz; edited frequency: 5.31 ppm (editing off: 7.5 ppm).Animal Experiment: Animal Experiments were conducted on Bruker 7T MRI scanners, involving 6 healthy diet and 17 high fat diet (HFD) male SD rats. All HFD rats were diagnosed with NAFLD. After week 11, eight of HFD rats underwent streptozotocin (STZ) injection and were diagnosed with T2DM before week 13. All rats were scanned using PRESS sequence with parameters: TR = 2000 ms; TE = 15 ms; spectral width = 5 kHz; voxel size = 6 × 8 × 8 mm3; 64 transients and 2048 datapoints.
Data Processing: Automatic spectral align was performed with the FID-A toolbox. The transients corrupted by motion artifacts were discarded. AMARES (jMRUI-v6) algorithm was used to quantify peak signals. Allylic and diallylic amplitudes were corrected by correction factors based on the average concentration of fatty acid protons in human livers from gas chromatography9.
The PDFF value was derived from:
$$PDFF=\frac{Methylene}{Methylene+Water}$$
Three indices, UI, UIS and PUI, were calculated to evaluate fat unsaturation degree10,11:
$$UI=\frac{Vinyl}{Methylene+Methyl+Vinyl+Allylic}$$
$$UI_{S}=\frac{Allylic+Diallylic}{Methylene+Methyl+Allylic+Diallylic}$$
$$PUI=\frac{Diallylic}{Methylene+Methyl+Allylic+Diallylic}$$
Statistical Analysis: The independent two-sample Student t-test was used to compare the measurement results between groups.
Results
Table 1 shows the demographic of in-vivo experiments. Figure 1 shows the application of JDE-MRS in human liver. The allylic and diallylic peaks could be clearly resolved in DIFF spectra at 2.03ppm and 2.77ppm. Figure 2 shows hepatic lipid unsaturated indices in different groups. For UI, there was no significant difference among three groups, with relatively large standard deviations. UIS and PUI in HC were significantly higher than those in NAFLD and T2DM. No significant difference was observed between NAFLD and T2DM. However, an upward trend of UIS and PUI could be observed in T2DM relative to the NAFLD.Figure 3 shows voxel position and spectra of animal experiments. Figure 4 shows the rats hepatic PDFF and unsaturated indices. UI, UIS and PUI in HC were significantly higher than those in NAFLD. After STZ injection, UIS and PUI in T2DM were also significantly higher than those in NAFLD, and the differences between T2DM and HC disappeared. Longitudinal comparisons also showed increasing unsaturation indices in T2DM after STZ injection.
Discussion
In this study, unsaturated lipid on edited spectra were clearly measured with suitable scanning settings. The respiration motion and dense blood vessels makes it challenging to apply JDE-MRS in liver. To our knowledge, this is the first study to apply JDE-MRS to measure lipid composition in human liver. In vivo measurements showed higher hepatic unsaturated fat ratio in NAFLD patients compared with healthy people, consistent with the results obtained from previous capillary gas chromatography12. With the progression of hepatic steatosis, liver fat tends to be stored in saturated form rather than unsaturated. In addition, compared with NAFLD alone, patients with both NAFLD and T2DM showed upward trends in unsaturated indices. Validated by the results of rat models, these trends turned into significant difference. These results together suggest that diabetes may further affect hepatic fat metabolism with different pathways, above the obese process, even though its underlying mechanism is currently unclear.Conclusion
The JDE-MRS technique was successfully applied in human liver with allylic and diallylic signals reliably measured. The technique reveals differences between NAFLD patients and healthy people, suggesting potential differences of lipid metabolism between NAFLD patients and T2DM patients, which need to be further confirmed with JDE-MRS studies in larger sample sizes.Acknowledgements
No acknowledgement found.References
1. Ertunc ME, Hotamisligil GS. Lipid signaling and lipotoxicity in metaflammation: indications for metabolic disease pathogenesis and treatment. J Lipid Res. 2016 Dec;57(12):2099–114.
2. Bacon BR, Farahvash MJ, Janney CG, Neuschwander-Tetri BA. Nonalcoholic steatohepatitis: an expanded clinical entity. Gastroenterology. 1994 Oct;107(4):1103–9.
3. Clarke SD. Polyunsaturated fatty acid regulation of gene transcription: a molecular mechanism to improve the metabolic syndrome. J Nutr. 2001 Apr;131(4):1129–32.
4. Meex RCR, Blaak EE. Mitochondrial Dysfunction is a Key Pathway that Links Saturated Fat Intake to the Development and Progression of NAFLD. Mol Nutr Food Res. 2021 Jan;65(1):e1900942.
5. Szczepaniak LS, Babcock EE, Schick F, Dobbins RL, Garg A, Burns DK, et al. Measurement of intracellular triglyceride stores by H spectroscopy: validation in vivo. Am J Physiol. 1999 May;276(5):E977-989.
6. Tkáč I, Öz G, Adriany G, Uğurbil K, Gruetter R. In vivo 1 H NMR spectroscopy of the human brain at high magnetic fields: Metabolite quantification at 4T vs. 7T: Metabolite Quantification at 4T vs. 7T. Magn Reson Med. 2009 Oct;62(4):868–79.
7. Choi IY, Andronesi OC, Barker P, Bogner W, Edden RAE, Kaiser LG, et al. Spectral editing in 1 H magnetic resonance spectroscopy: Experts’ consensus recommendations. NMR Biomed. 2021 May;34(5):e4411.
8. Bhattacharyya PK, Lowe MJ, Phillips MD. Spectral quality control in motion-corrupted single-voxel J-difference editing scans: an interleaved navigator approach. Magn Reson Med. 2007 Oct;58(4):808–12.
9. Yamada K, Mizukoshi E, Sunagozaka H, Arai K, Yamashita T, Takeshita Y, et al. Characteristics of hepatic fatty acid compositions in patients with nonalcoholic steatohepatitis. Liver Int Off J Int Assoc Study Liver. 2015 Feb;35(2):582–90.
10. Yeung DKW, Griffith JF, Antonio GE, Lee FKH, Woo J, Leung PC. Osteoporosis is associated with increased marrow fat content and decreased marrow fat unsaturation: a proton MR spectroscopy study. J Magn Reson Imaging JMRI. 2005 Aug;22(2):279–85.
11. Johnson NA, Walton DW, Sachinwalla T, Thompson CH, Smith K, Ruell PA, et al. Noninvasive assessment of hepatic lipid composition: Advancing understanding and management of fatty liver disorders. Hepatology. 2008 May;47(5):1513–23.
12. Puri P, Baillie RA, Wiest MM, Mirshahi F, Choudhury J, Cheung O, et al. A lipidomic analysis of nonalcoholic fatty liver disease. Hepatol Baltim Md. 2007 Oct;46(4):1081–90.
Figures
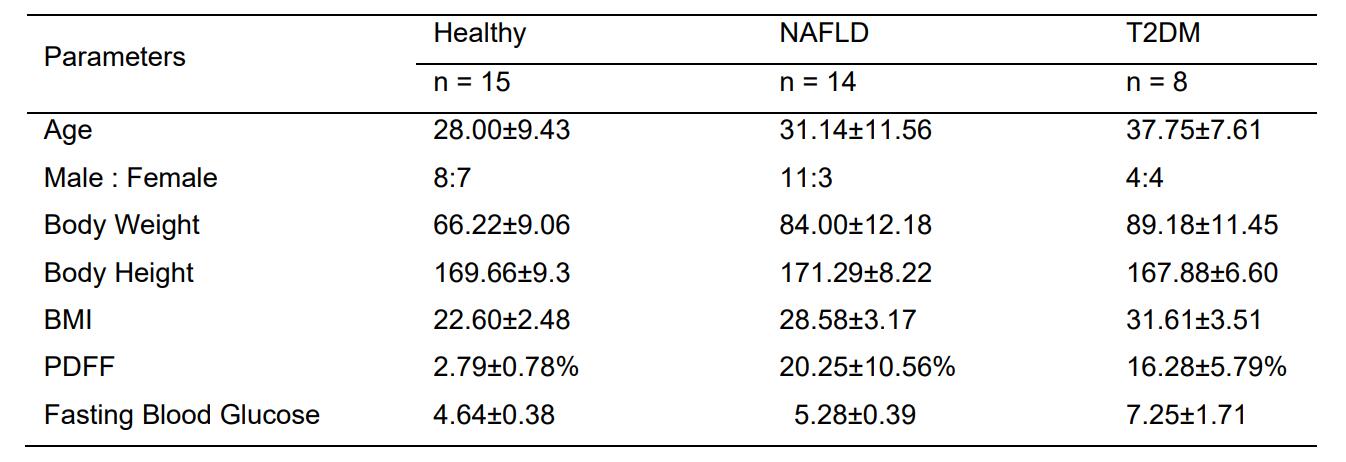
Table 1: Demographic data. BMI: body mass index. PDFF: proton density fat fraction. No significant differences in BMI and PDFF values between NAFLD and T2DM groups. No significant difference among the age ranges of all groups.
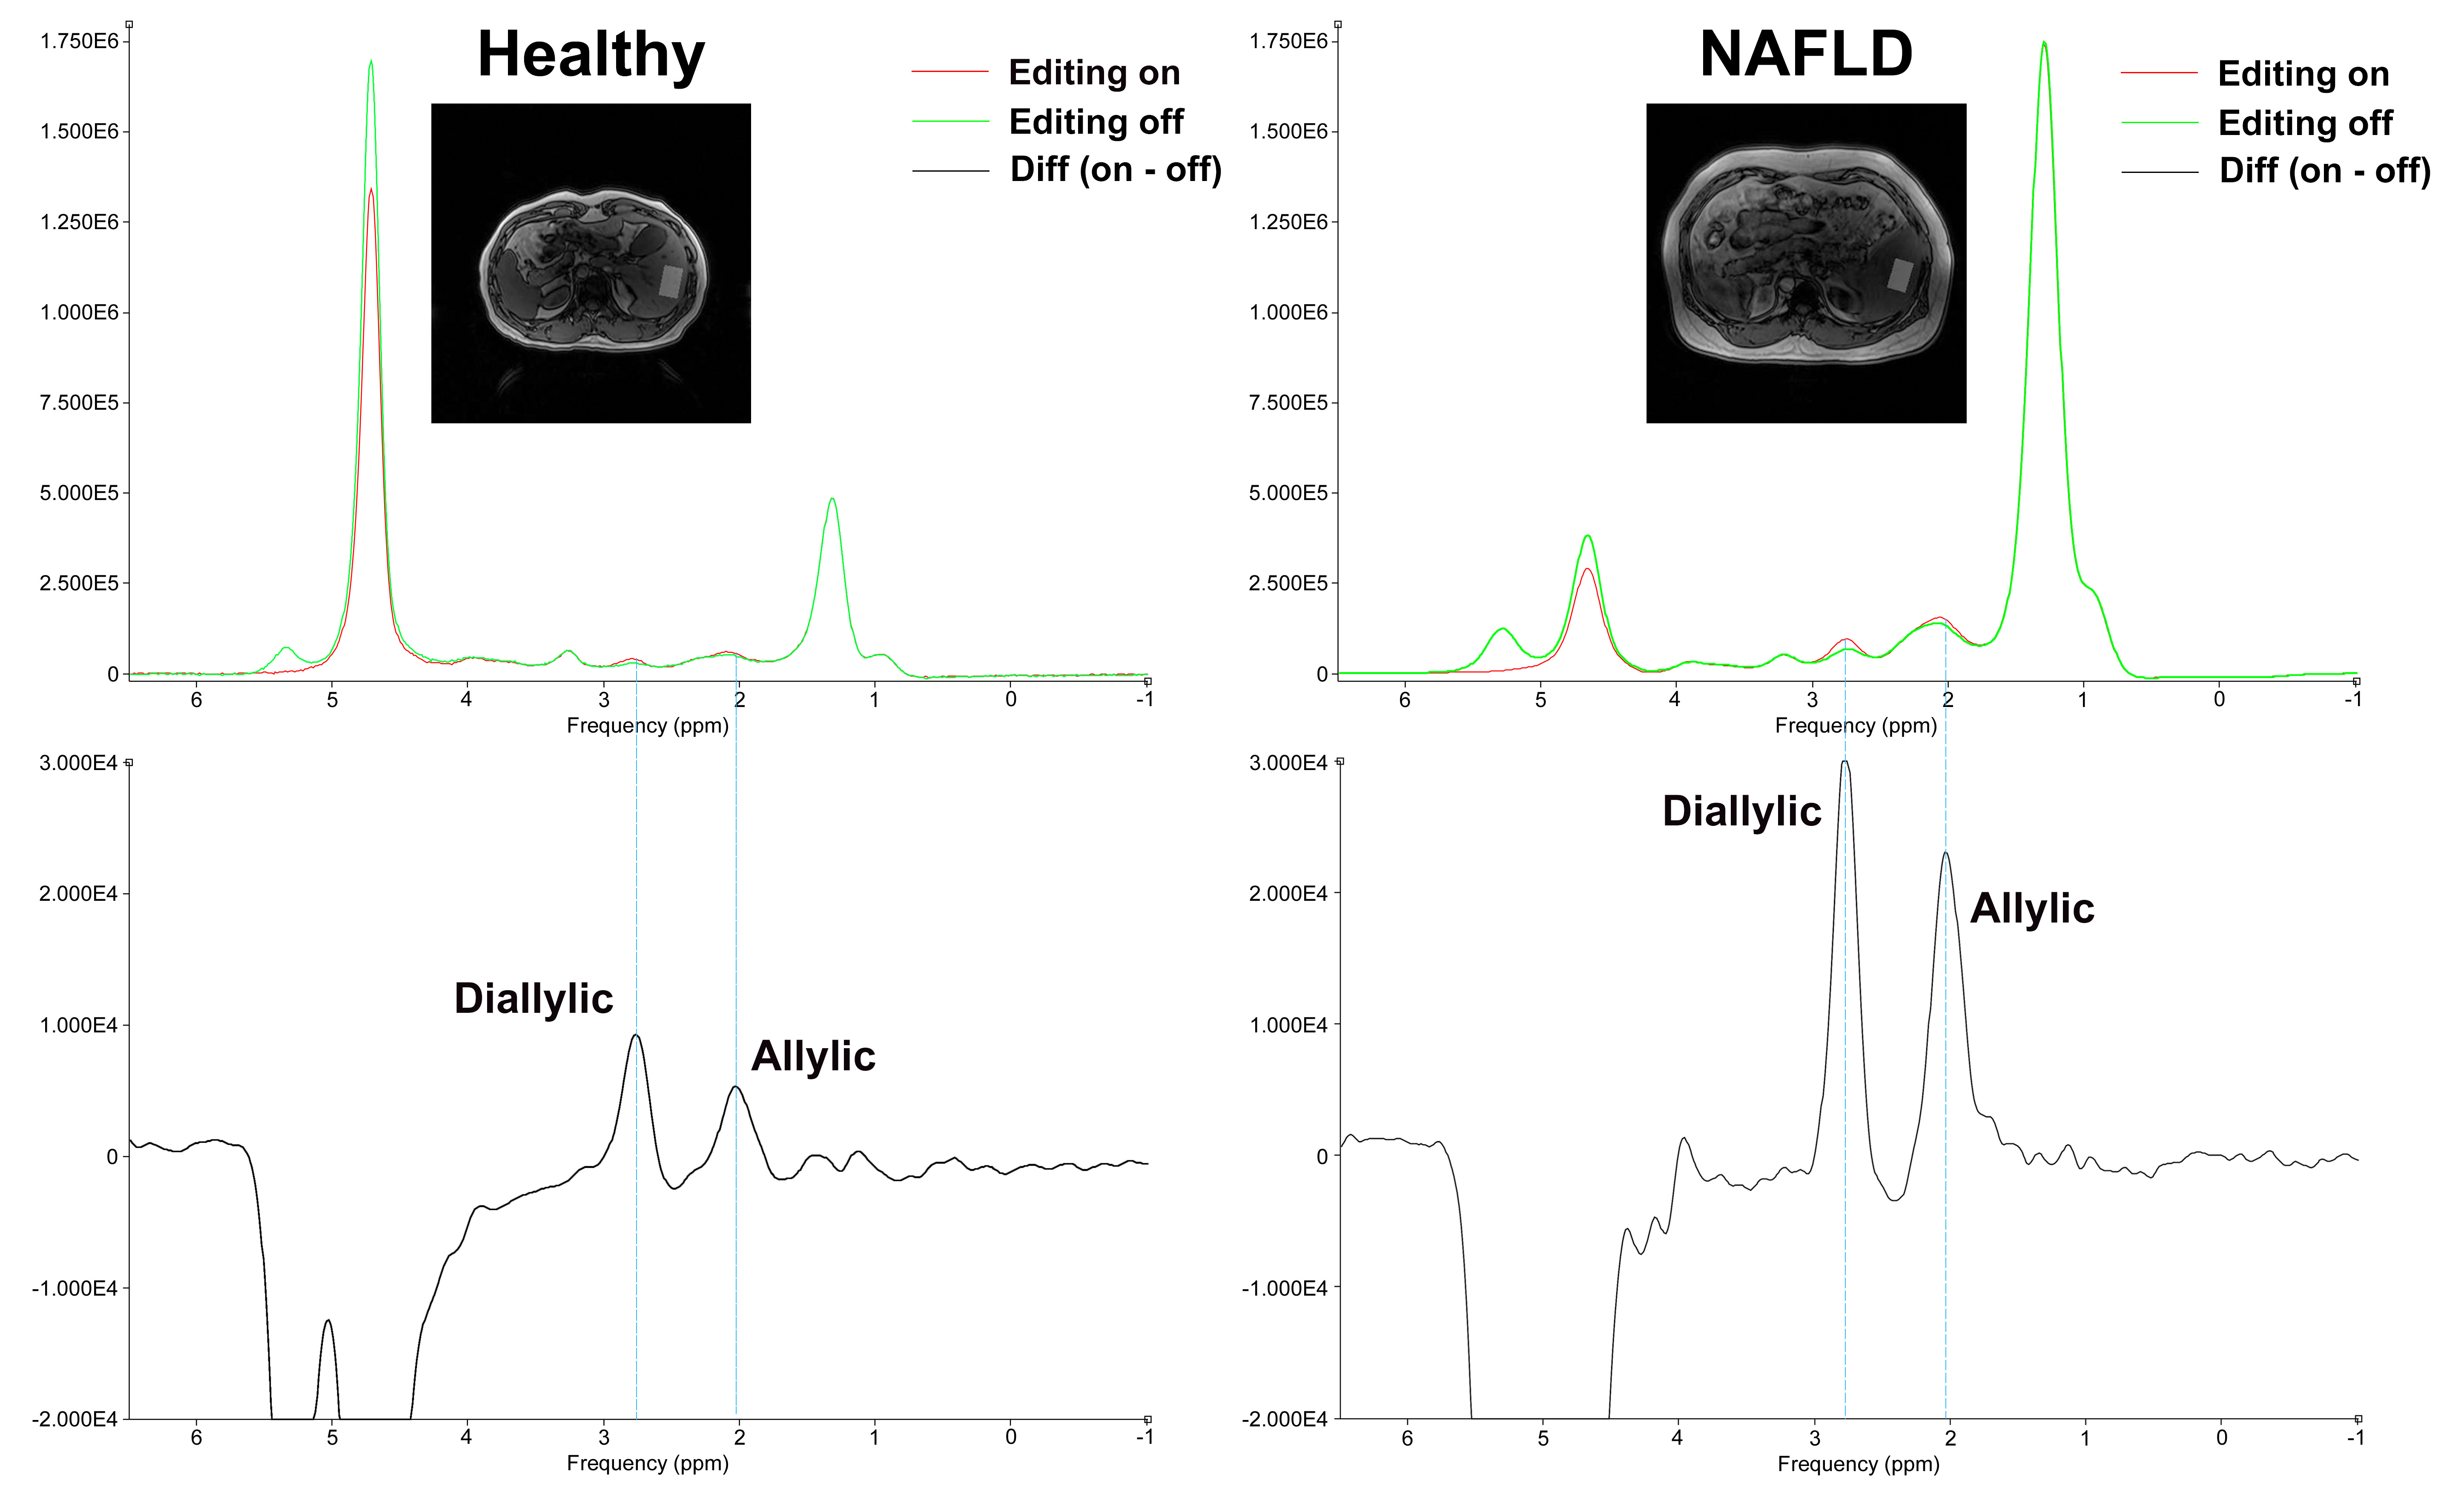
Figure 1: Application of JDE-MRS in human livers. The left shows the spectra of a healthy subject, and the right belongs to a NAFLD subject. The green line was the spectrum with no editing pulse applied. When the editing pulse is applied at 5.31 ppm, the edited peak disappears, shown in red. The two spectra are subtracted to obtain the difference spectrum containing the elevated scalar-coupled peaks (allylic at 2.03 ppm and diallylic at 2.77 ppm), shown in black.
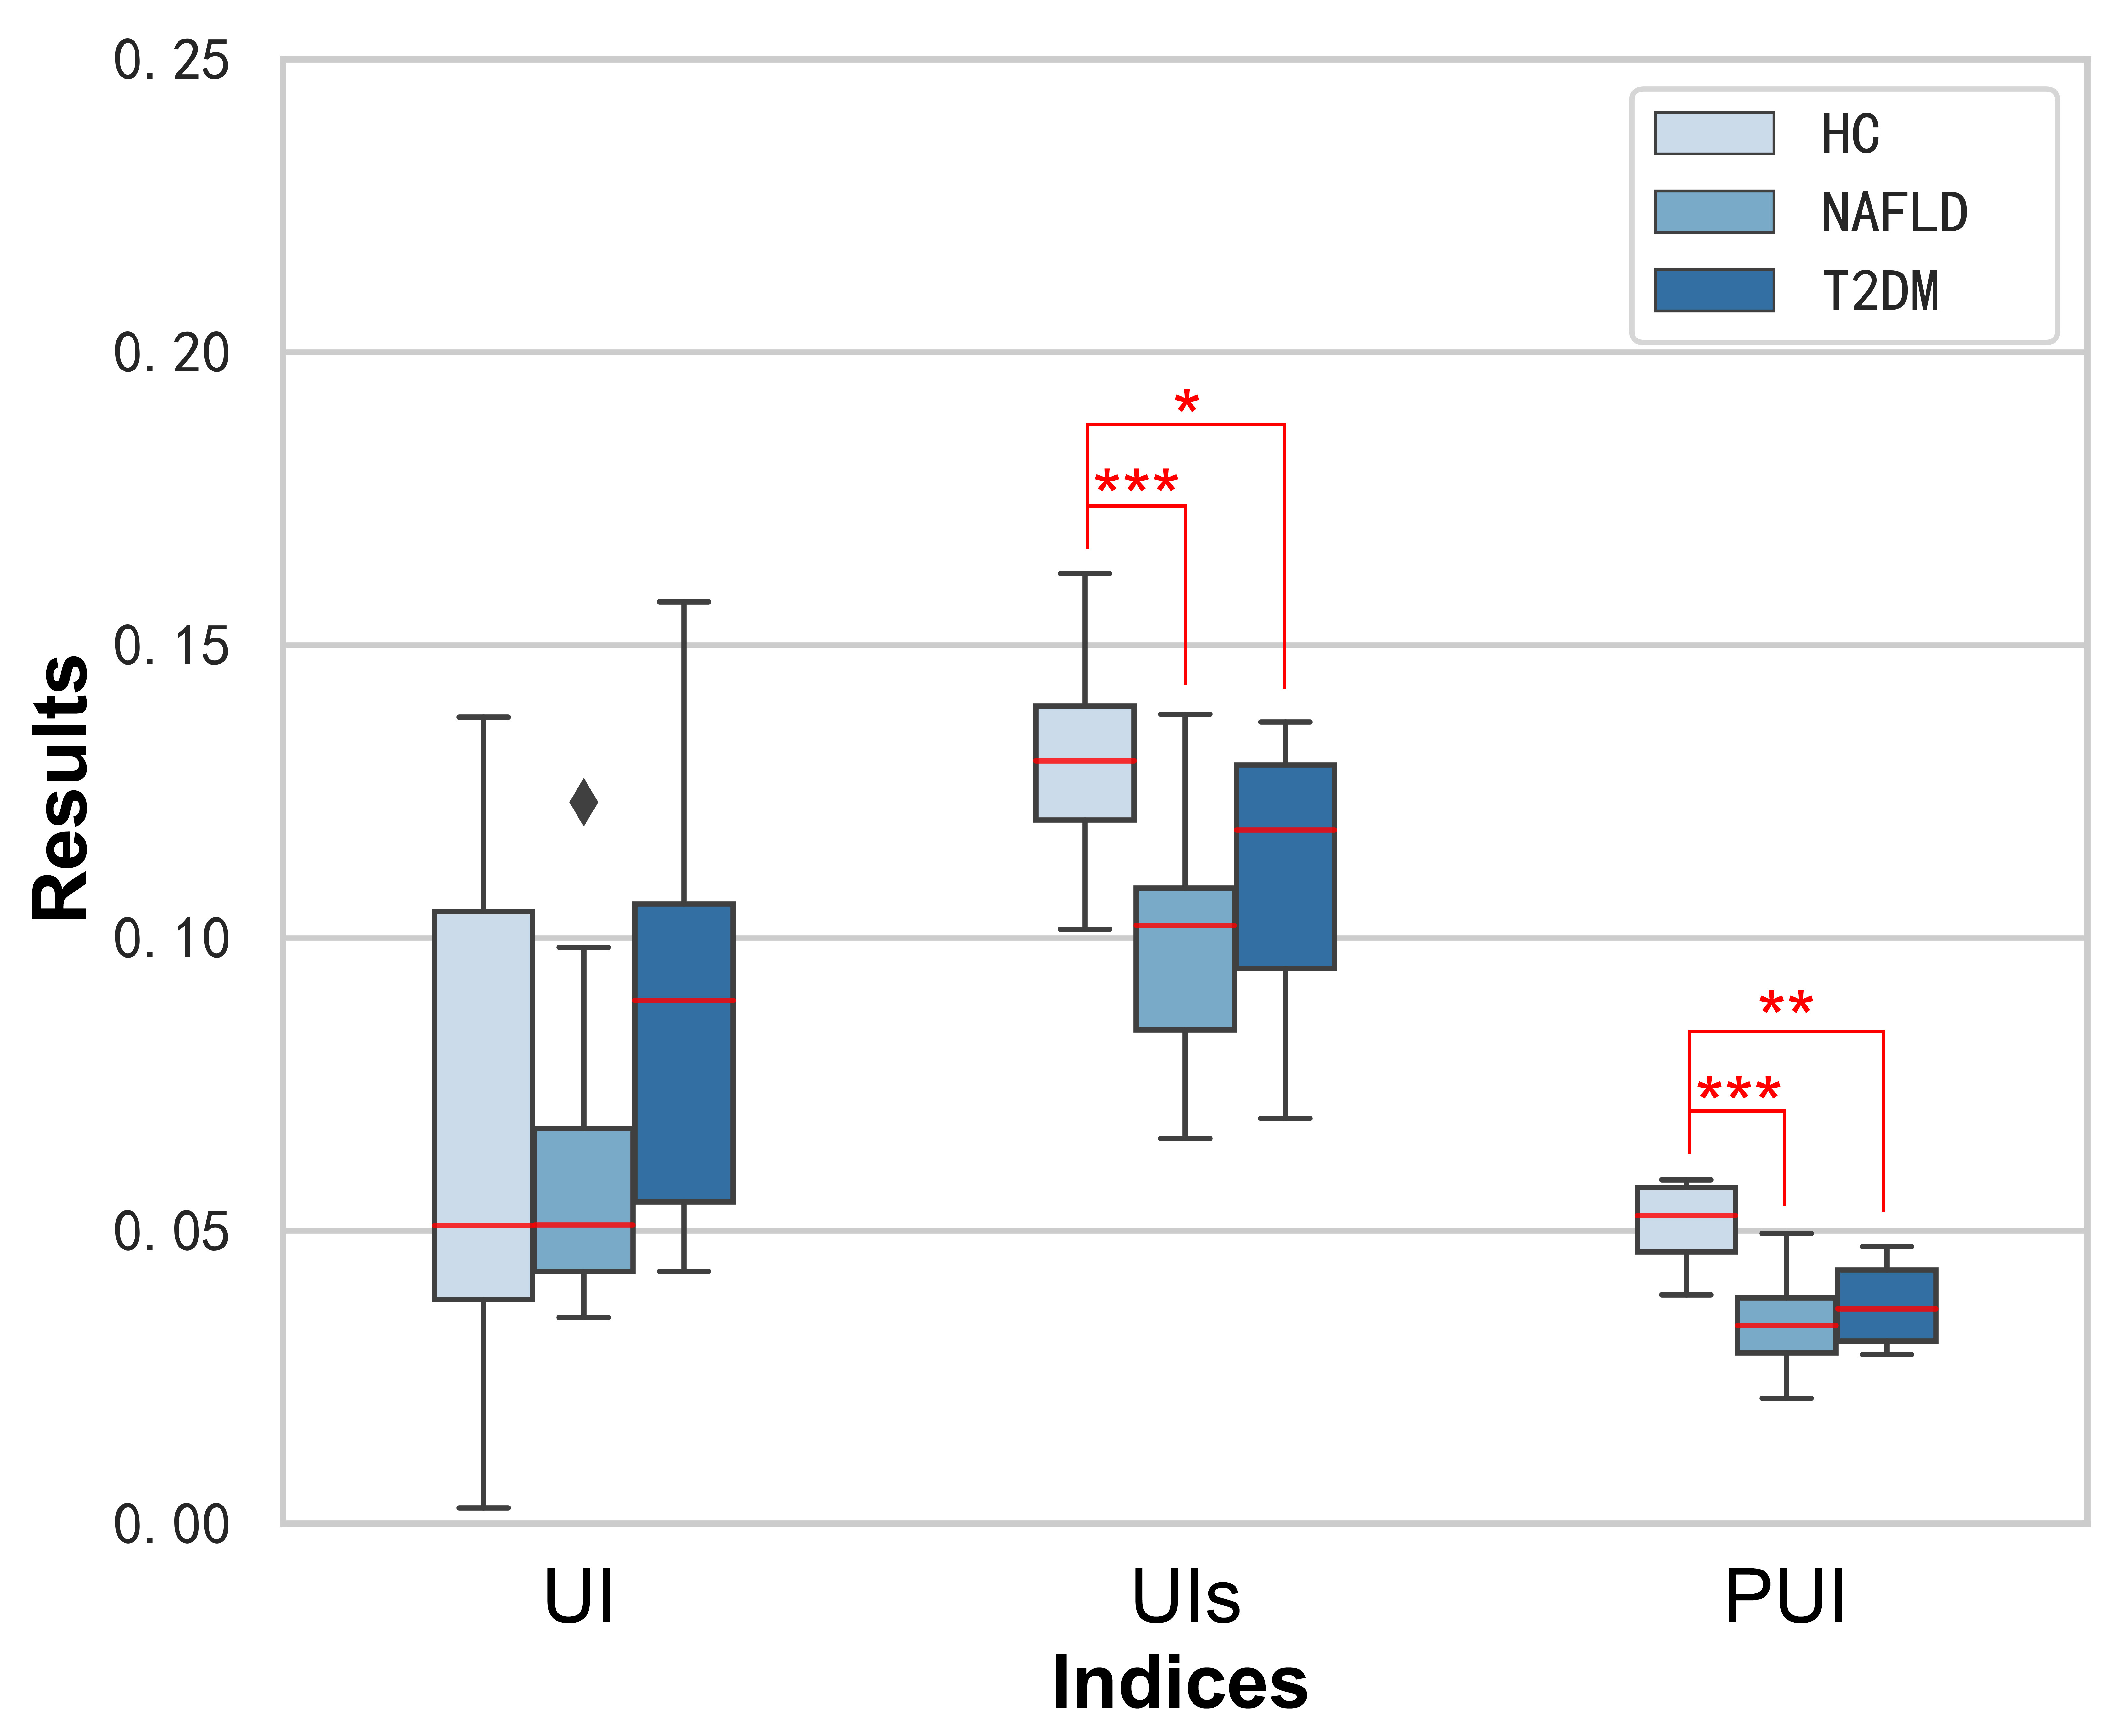
Figure 2: Comparison of UI, UIS and PUI in healthy, NAFLD and T2DM subjects. The * represents p < 0.05 examined with independent two-sample Student t-test, ** represents p < 0.01 and *** represents p < 0.001. The red horizontal line indicates the median, while the bottom and top edges of the box indicate the 25th and 75th percentiles. Points not connected to the box represent outliers.
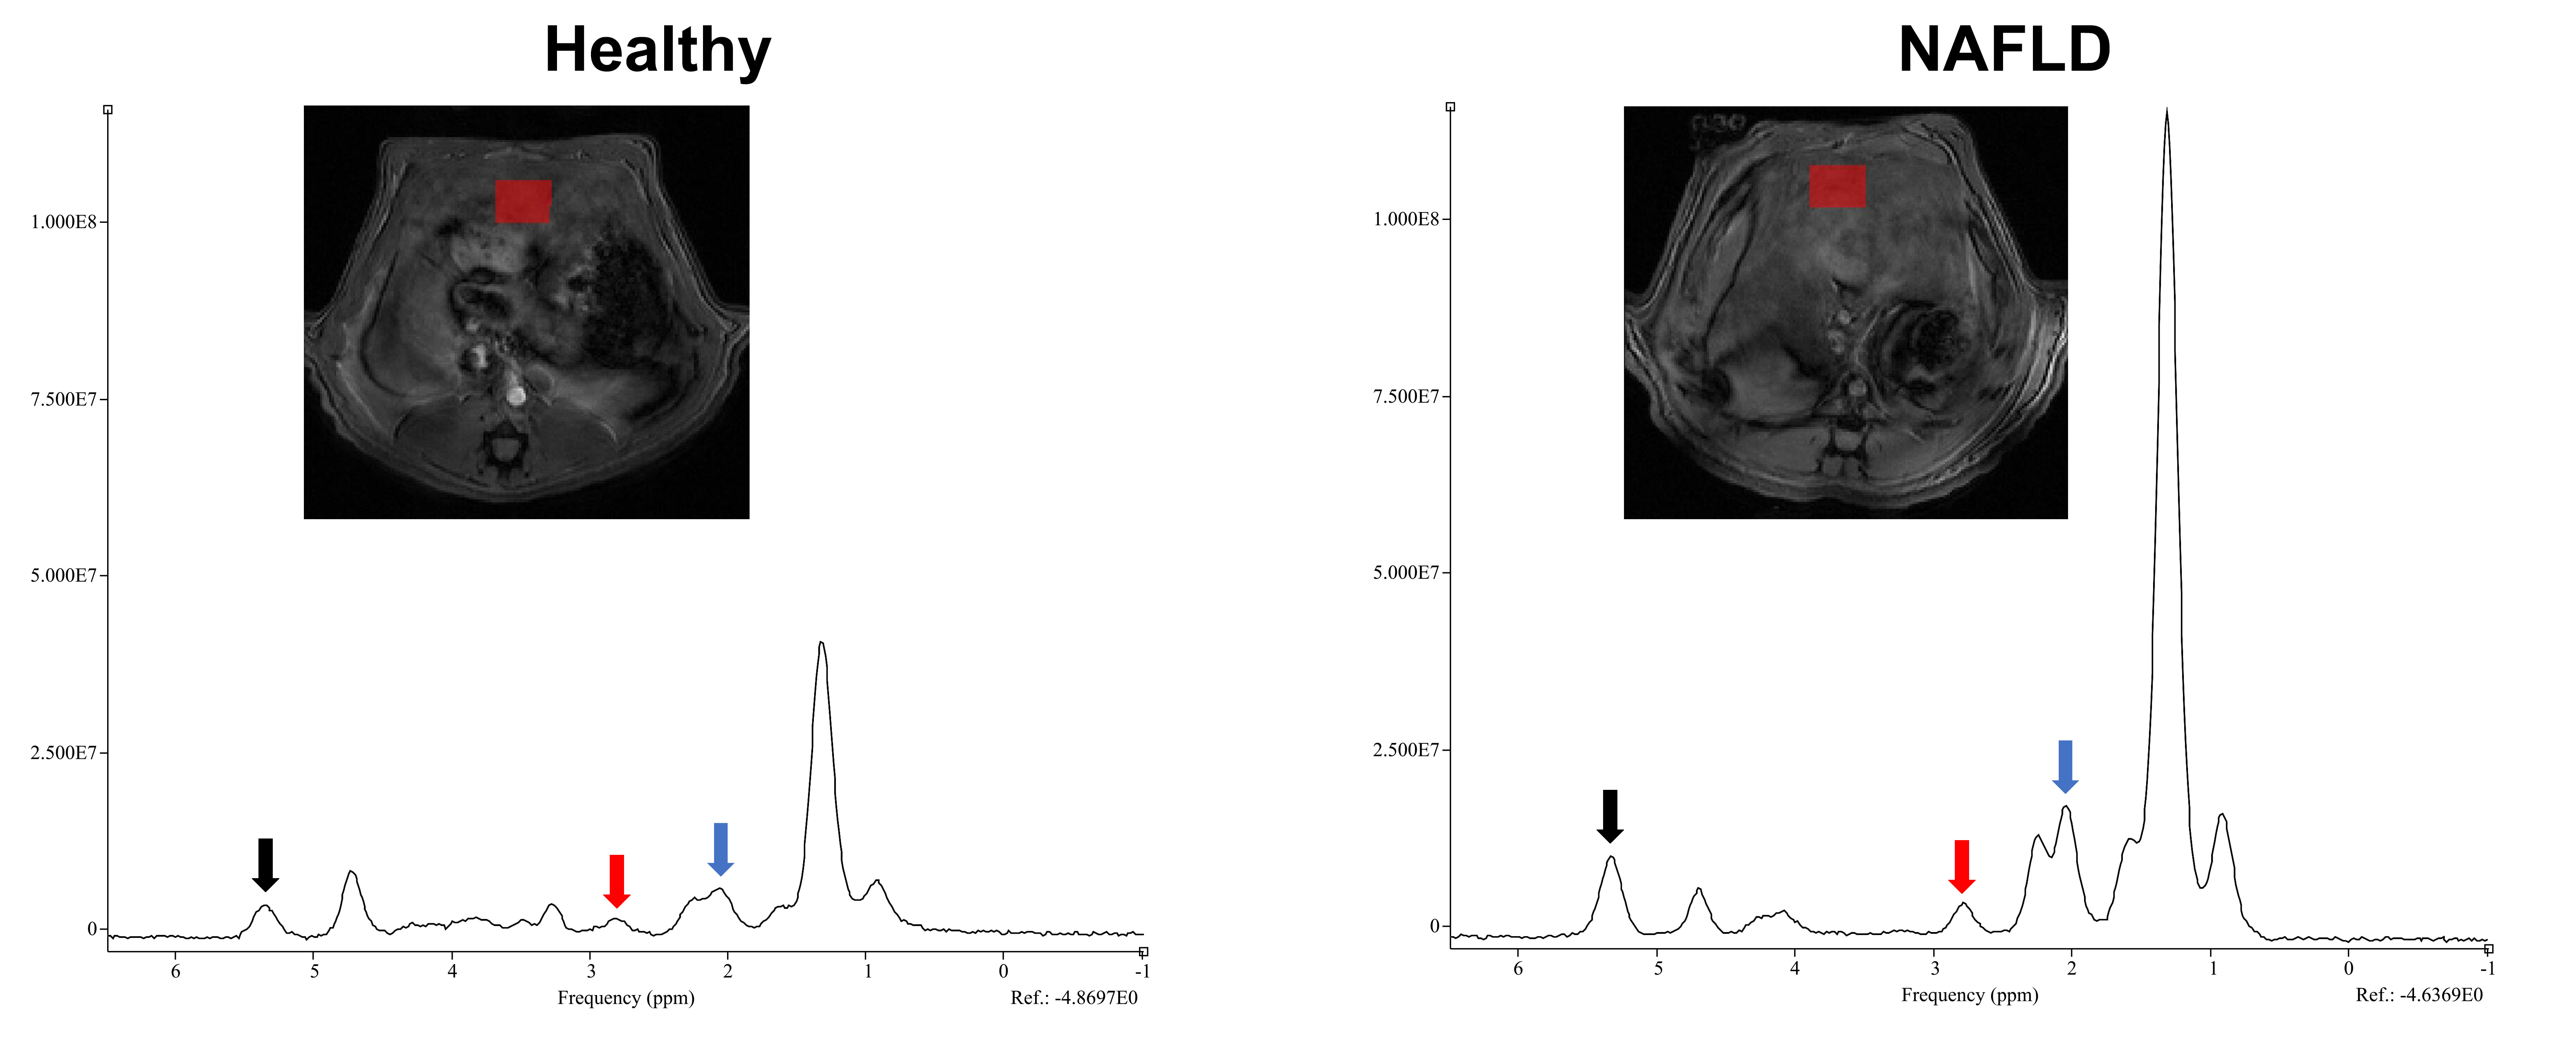
Figure 3: Measurement of hepatic lipid composition in rats. The left shows the MRI and spectrum of a healthy rat, and the right belongs to a NAFLD rat. The axes of the two spectra have been normalized to the same scale. The red rectangles in figures represent the voxels selected in MRS scanning. The blue arrows on the spectrum represent allylic (2.03 ppm), the red arrows represent diallylic (2.77 ppm), and the black arrows represent vinyl (5.31 ppm).
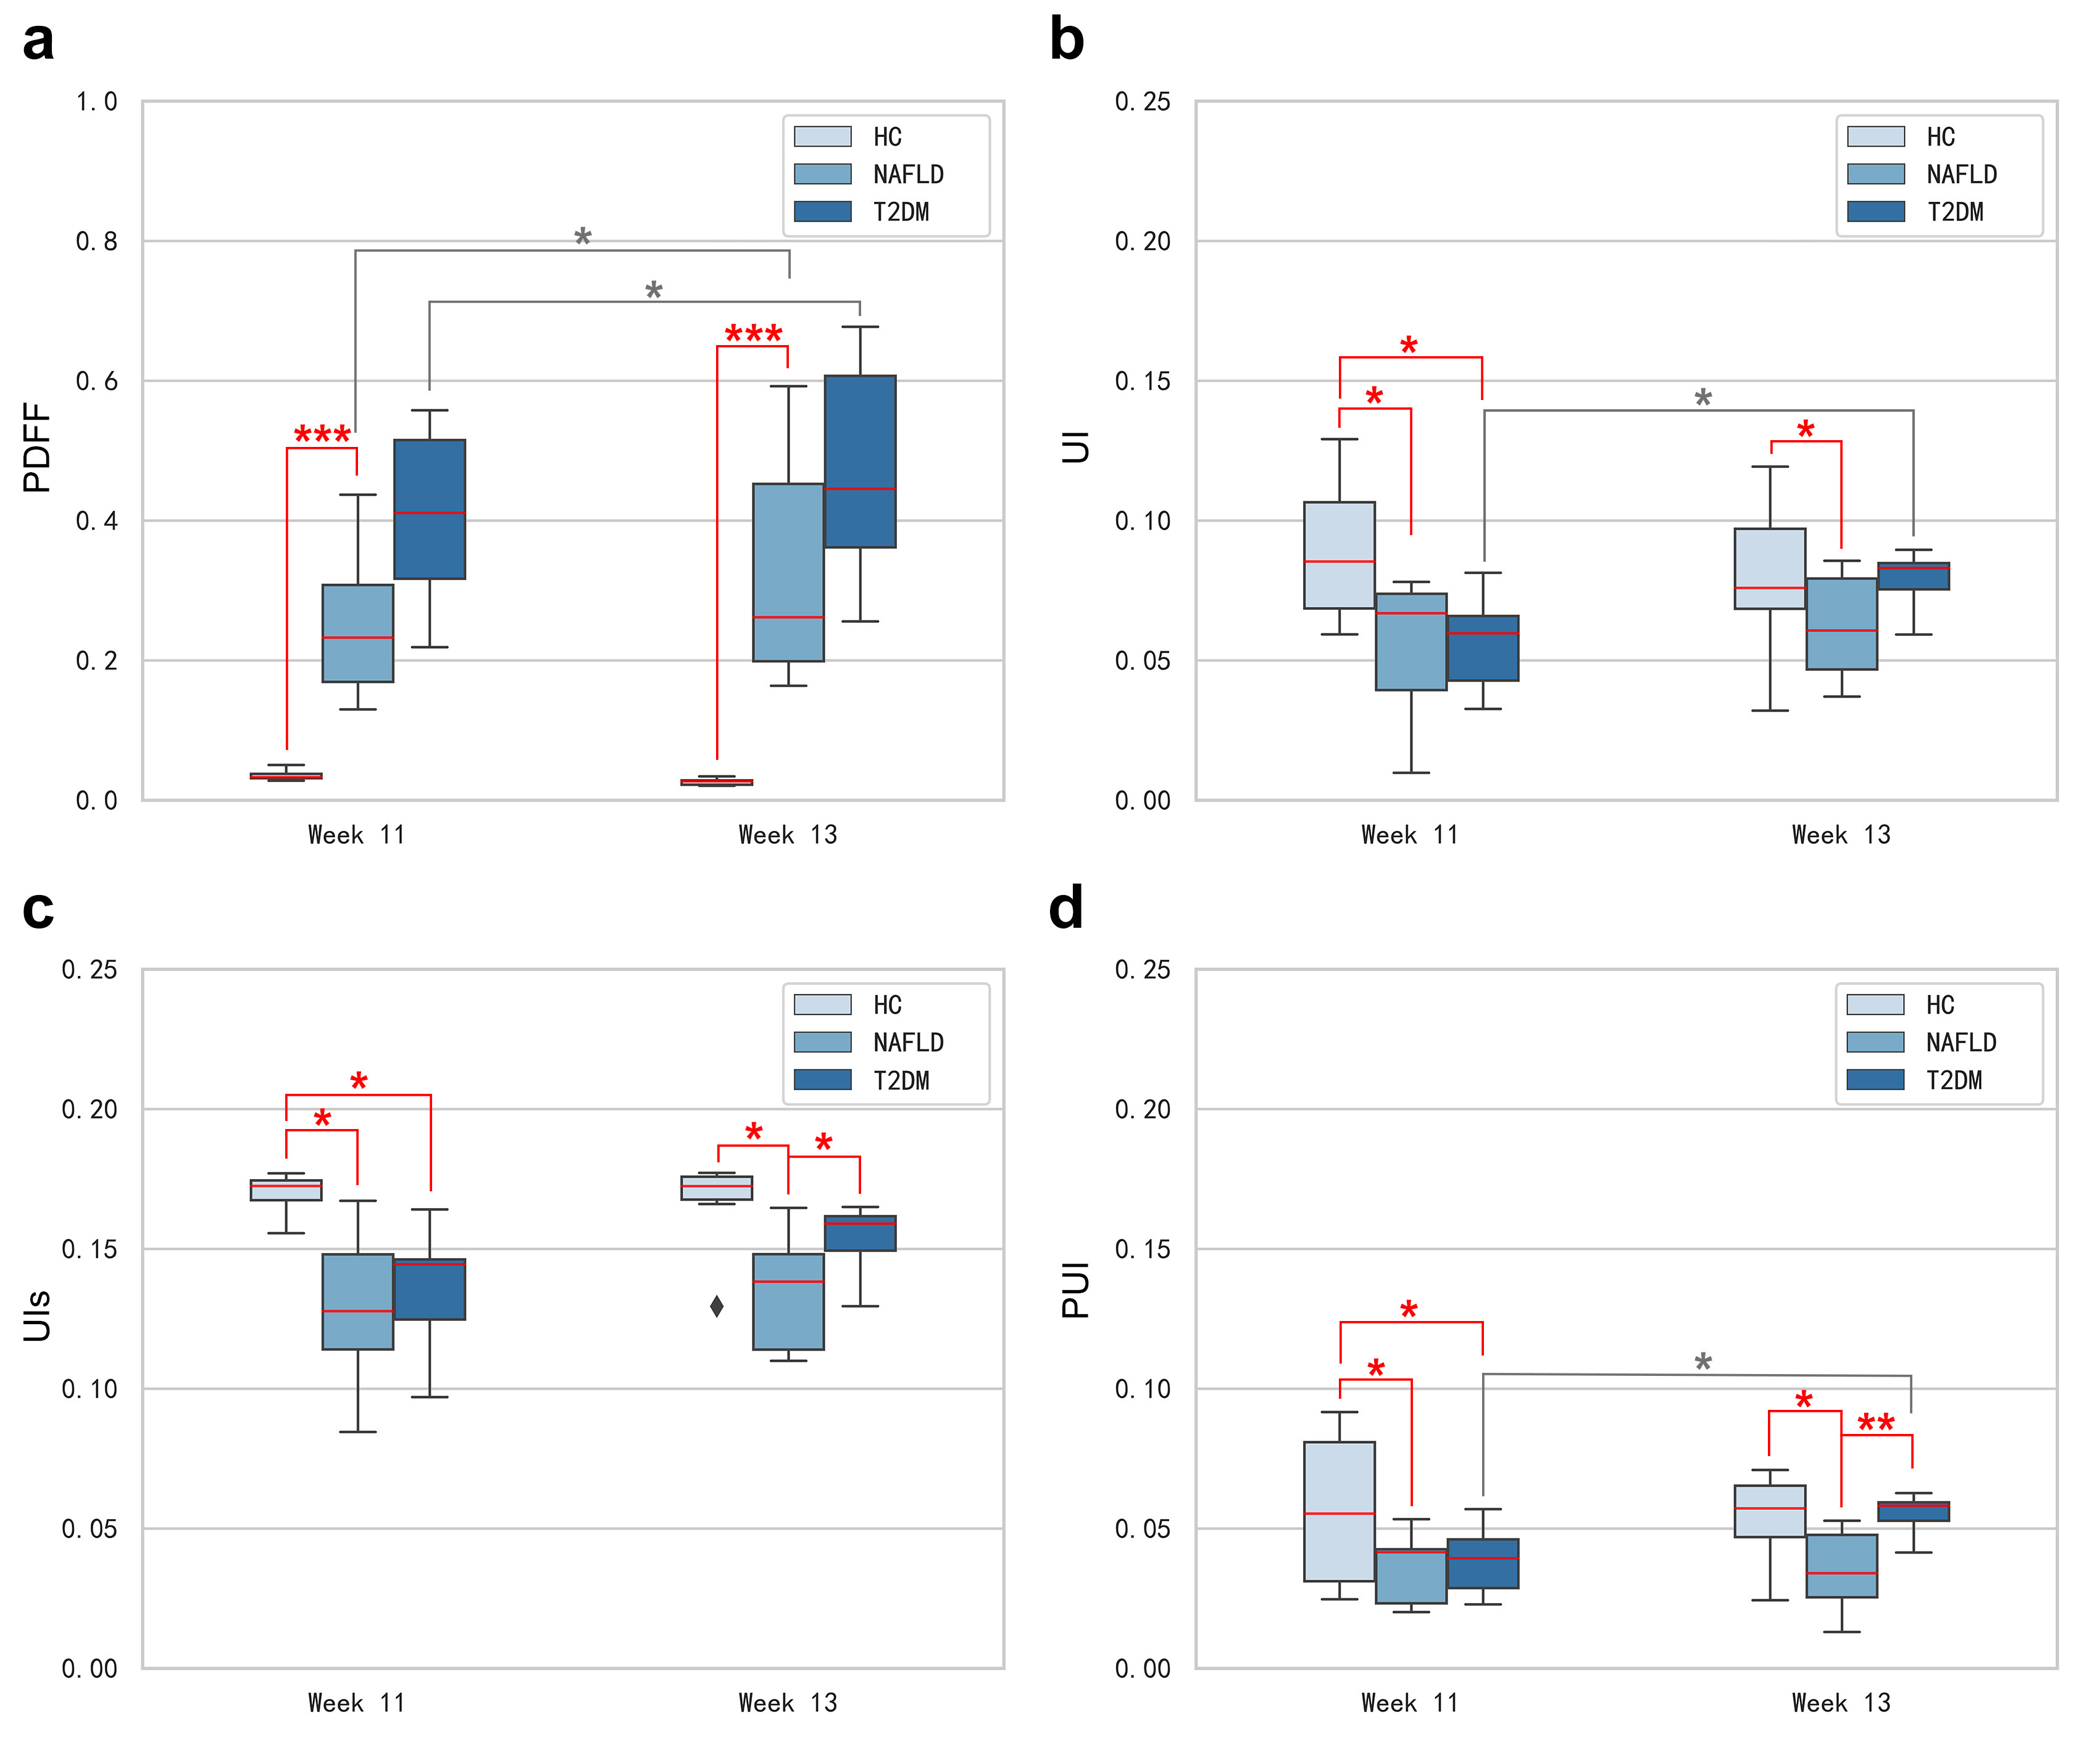
Figure 4: Hepatic fat content (a) and unsaturation indices (b-d) of animal experiments. The horizontal axis represents two measurement time-points. The red line represents a significant difference in t-test, and the gray line represents a significant difference in pair t-test. After STZ injection, unsaturation indices of T2DM rats increased, while that of HC and NAFLD hardly changed. Significant differences between T2DM and NAFLD at week 13 could be observed.