0848
Application of Intratumoral and Peritumoral Multimodal MRI in Predicting HER-2 Expression in Breast Cancer1Radiology, The First Hospital of Lanzhou University, Lanzhou, China, 2GE HealthCare MR Research, Beijing, China, 3Breast Disease, The First Hospital of Lanzhou University, Lanzhou, China
Synopsis
Keywords: Breast, Breast, multimodal; MUSE; MAGIC; IDEAL-IQ; HER-2
Motivation: Human epidermal growth factor receptor-2(HER-2) was a proto-oncogene, and its overexpression was closely associated with the development and prognosis of breast cancer.
Goal(s): To investigate predictive value of intratumoral and peritumoral multimodal magnetic resonance imaging (MRI) before surgery for the expression level of HER-2 in breast cancer.
Approach: The parameters, including apparent diffusion coefficient (ADC), tissue-diffusivity (Dt), pseudo-diffusivity (Dp), perfusion fraction(f), relaxation rate(R2*), fat-fraction (FF), the relaxation value longitudinal relaxation time(T1), transverse relaxation time(T2) and proton density(PD) were used to predict the expression level of HER-2 in breast cancer.
Results: MUSE-Dt-peritumoral predicted HER-2 with the highest AUC(0.724, P=0.017).
Impact: There were few studies involving intratumoral and peritumoral multimodal MRI to predict HER-2 in breast cancer. The result was that peritumoral parameters had a momentous part in predictive performance beyond expectation, especially non-invasive techniques which were easy to implement clinically.
Introduction
Breast cancer was characterized by spatial ecosystems within the intratumoral and peritumoral regions, where dynamic interactions occurred between tumor cells and immune environments1-2. The peritumoral region, a distinctive microenvironment with controversial biological expression, necessitates exploration of prognostic factors using multimodal MRI within both intratumoral and peritumoral. Human epidermal growth factor receptor 2 (HER-2) status serves as a guiding prerequisite for targeted therapy in breast cancer. Immunohistochemistry(IHC) for protein overexpression and fluorescence in situ hybridization (FISH) for gene amplification are the two primary clinical methods used to determine HER-2 status3. Current research on breast cancer predominantly focus on conventional techniques, with limited attention given to multimodal MRI for predicting the HER-2 status4-5. Therefore, this study aimed to investigate the predictive value of quantitative metrics derived from multimodal MRI techniques, including multiplexed sensitivity encoding (MUSE)-based intravoxel incoherent motion (IVIM), iterative decomposition of water and fat with echo asymmetry and least squares estimation quantification sequence (IDEAL-IQ), and magnetic resonance image complication (MAGIC), for the accurate prediction of HER-2 status in breast cancer.Methods
Participants and data acquisition:This study was approved by the Institutional Ethics Committee and all participants were scanned after obtaining written informed consent. From September 2022 to August 2023, a total of 45 cases of breast cancer patients confirmed by pathology were recruited. All MR examinations were performed on a 3.0T MR scanner (SIGNATM Architect, GE Healthcare, Milwaukee WI, USA) equipped with a 8-channel breast coil. The scan protocol included conventional anatomic structural imaging and multiple quantitative sequences such as MAGIC, IDEAL-IQ and MUSE-IVIM.
Pathological criteria:
A HER-2 staining intensity score of not lower than 3 or a HER-2 staining intensity score of 2 with gene amplification confirmed by fluorescence in situ hybridization(FISH), was considered to be positive (HER-2 positive group, 14 cases), while otherwise was considered to be low (HER-2 negative group, 31 cases)6.
Image analysis:
The images were further processed using the iQuant workstation (Magtron, Jiangyin, Jiangsu Province, China) and AW 4.7 workstation (GE Healthcare, Milwaukee WI, USA), and multiple quantitative metrics were obtained: T1, T2 and proton density (PD) map derived from MAGiC; R2* and fat-fraction (FF) map derived from IDEAL-IQ; apparent diffusion coefficient (ADC), fast diffusion coefficient (Dp), slow diffusion coefficient (Dt) and perfusion fraction (f) derived from MUSE-IVIM. Subsequently, ITK-SNAP (version 3.8, http://www.itksnap.org) was used for image registration(the maximum enhanced image was taken as the benchmark to which all quantitative parameter maps were registered) and ROI drawing( the square ROIs were placed on the enhanced image at the solid area of maximum intratumoral enhancement and the area within 2mm periatumoral area respectively) .
Statistical analysis:
Statistical analysis was conducted using SPSS software (version 25.0, IBM Corporation, Armonk, NY, USA) at a two-sided significance level of 5% (P<0.05 indicates statistical significance). The differences of the multimodal MRI quantitative metrics (the intratumoral and peritumoral metrics were represented by -In and -per suffix, respectively) between the positive HER-2 group and the negative HER-2 group were analyzed by Shapiro Wilk-test, Chi Square-test, student’s T-test and Mann Whitney U-test of two independent samples. The metrics that showed statistical significance were further utilized in the multi-factor logistic regression analysis. Independent metrics were identified and their receiver operating characteristic (ROC) curves were plotted. All drawings were done on MedCalc statistical software(version 20.02, Belgium) and GraphPad Prism software(version 9.51, Boston).
Results
The values of MUSE-ADC-per, MUSE-Dt-per and MAGIC-T1-per in the HER-2 positive group were higher than those in the negative group, with statistical significance(P<0.05) in table 1 and figure 2, among which the AUC of MUSE-Dt-per was the largest (AUC=0.724, P=0.017), and the results showed that MUSE-Dt-per predicted HER-2 with the highest AUC (0.724, P=0.017, 95%CI: 0.572, 0.875). In predicting the level of HER-2 expression in breast cancer, MUSE model had higher diagnostic efficiency than MAGIC model (AUC=0.719, P=0.020, vs AUC=0.717, P=0.021) in table 2 and figure 3.Discussion
Similar to our results, a study showed that the intra-tumoral and peritumoral radiomics signatures for prediction of HER-2 status achieved areas under the ROC of 0.683 and 0.690 in the validation cohort, respectively4. The study which echoes our research that only the T1-per value in the MAGIC model was meaningful7. The MUSE model get unexpected results because MUSE-diffusion-weighted (MUSE-DWI) MRI can provide DWI with less noise, fewer distortions, improved signal-to-noise ratio, and better lesion detectability8.Conclusion
The parameters of MUSE-IVIM and MAGIC can predict the expression level of HER-2, especially the peritumoral parameters, which may be beneficial to individualized treatment of patients in the future, and more new technologies around peritumoral tissue need to gain widespread attention.Acknowledgements
The authors would like to thank Dr. Yuhui Xiong for his contribution.References
- Fan L, Strasser-Weippl K, Li J J, et al. Breast cancer in China[J]. The lancet oncology, 2014, 15(7): e279-e289.
- Sofopoulos M, Fortis S P, Vaxevanis C K, et al. The prognostic significance of peritumoral tertiary lymphoid structures in breast cancer[J]. Cancer Immunology, Immunotherapy, 2019, 68: 1733-1745.
- Bitencourt A G V, Gibbs P, Saccarelli C R, et al. MRI-based machine learning radiomics can predict HER2 expression level and pathologic response after neoadjuvant therapy in HER2 overexpressing breast cancer[J]. EBioMedicine, 2020, 61.
- Li C, Song L, Yin J. Intratumoral and peritumoral radiomics based on functional parametric maps from breast DCE‐MRI for prediction of HER‐2 and Ki‐67 status[J]. Journal of Magnetic Resonance Imaging, 2021, 54(3): 703-714.
- Okuma H, Sudah M, Kettunen T, et al. Peritumor to tumor apparent diffusion coefficient ratio is associated with biologically more aggressive breast cancer features and correlates with the prognostication tools[J]. Plos one, 2020, 15(6): e0235278.
- Wolff A C, Hammond M E H, Hicks D G, et al. Recommendations for human epidermal growth factor receptor 2 testing in breast cancer: American Society of Clinical Oncology/College of American Pathologists clinical practice guideline update[J]. Archives of Pathology and Laboratory Medicine, 2014, 138(2): 241-256.
- Du S, Gao S, Zhang L, et al. Improved discrimination of molecular subtypes in invasive breast cancer: Comparison of multiple quantitative parameters from breast MRI[J]. Magnetic Resonance Imaging, 2021, 77: 148-158.
- Kim Y Y, Kim M J, Gho S M, et al. Comparison of multiplexed sensitivity encoding and single-shot echo-planar imaging for diffusion-weighted imaging of the liver[J]. European Journal of Radiology, 2020, 132: 109292.
Figures
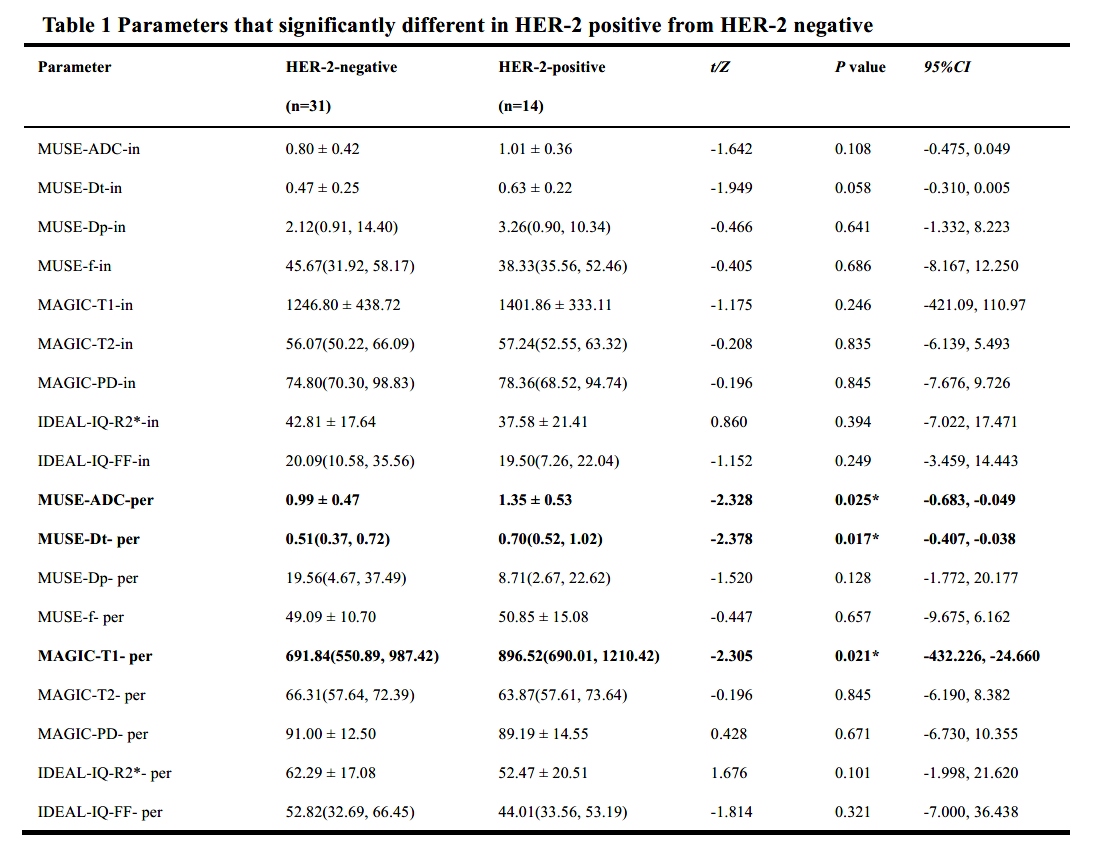
Table 1 Parameters that significantly different in HER-2 positive from HER-2 negative
*indicates statistical significance at P < 0.05. ADC (×10-3 mm2/s), apparent diffusion coefficient; Dt (×10-3 mm2/s), slow diffusion coefficient; Dp (×10-3 mm2/s), fast diffusion coefficient; f (%), perfusion fraction; T1(ms), longitudinal relaxation time; T2(ms), transverse relaxation time; PD (pu), proton density; (ms); R2*(Hz) and FF (%), fat-fraction.
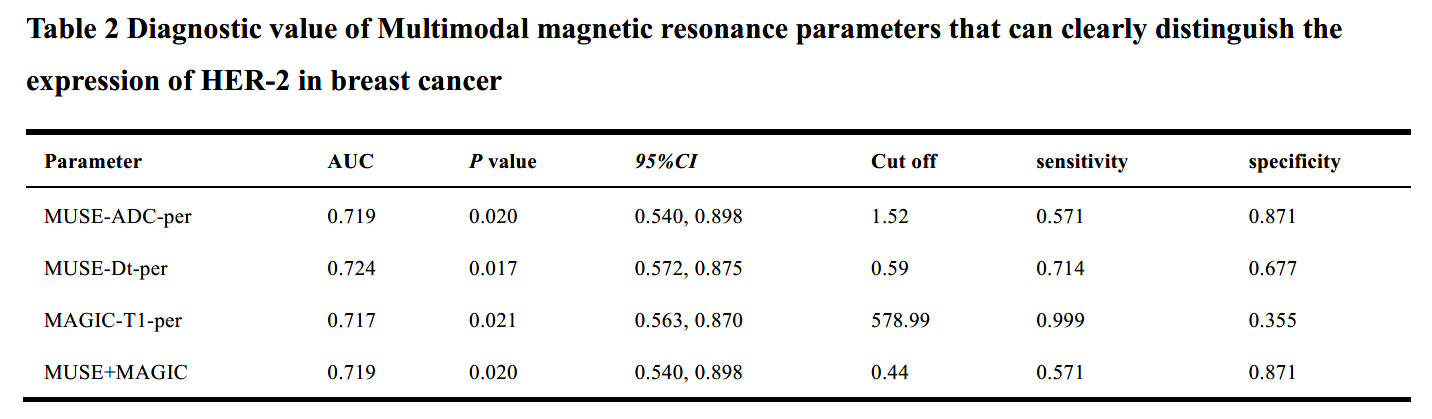
Table 2 Diagnostic value of Multimodal magnetic resonance parameters that can clearly distinguish the expression of HER-2 in breast cancer
AUC, The area under the receiver operating characteristic curve; ADC (×10-3 mm2/s), apparent diffusion coefficient; Dt (×10-3 mm2/s), slow diffusion coefficient; T1(ms), longitudinal relaxation time.
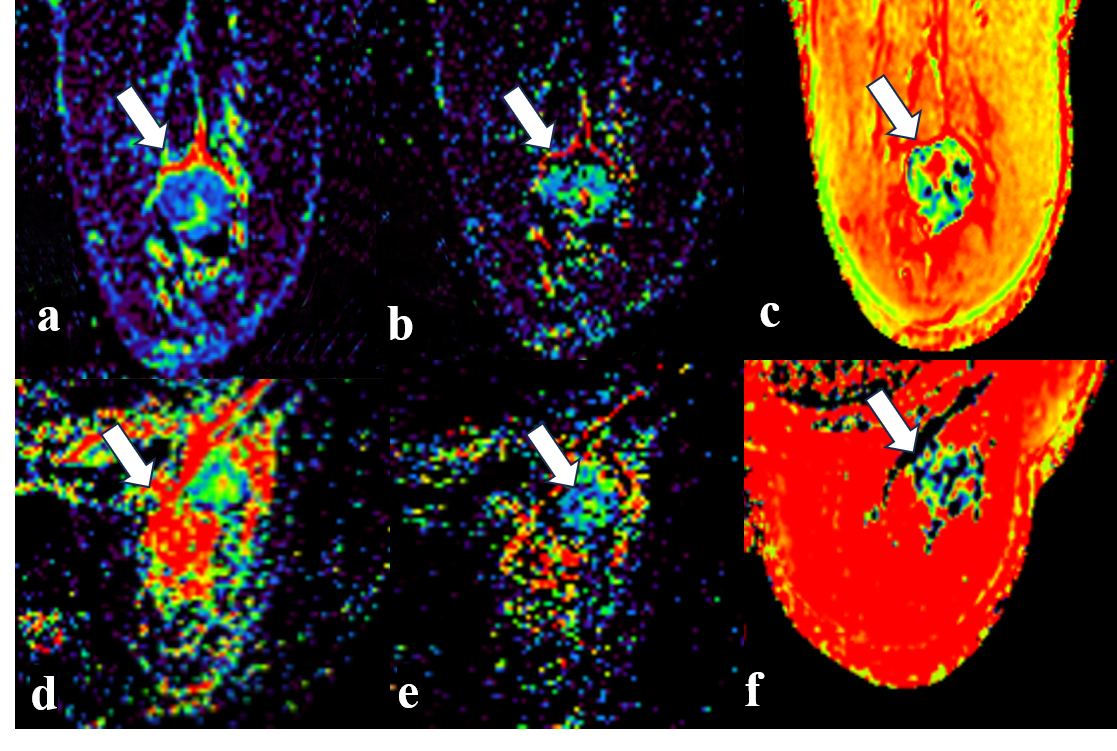
Figure 1. Examples of infiltrating carcinoma of the right breast
A 58-year-old woman was diagnosed with right-sided invasive breast cancer with HER-2(negative) :(a) MUSE-IVIM-ADC, (b) MUSE-IVIM-Dt, (c) MAGIC-T1; a 53-year-old woman was diagnosed with right-sided invasive breast cancer with HER-2 (positive): (d) MUSE-IVIM-ADC, (e) MUSE-IVIM-Dt, (f) MAGIC-T1. The white arrow points to the tumor.
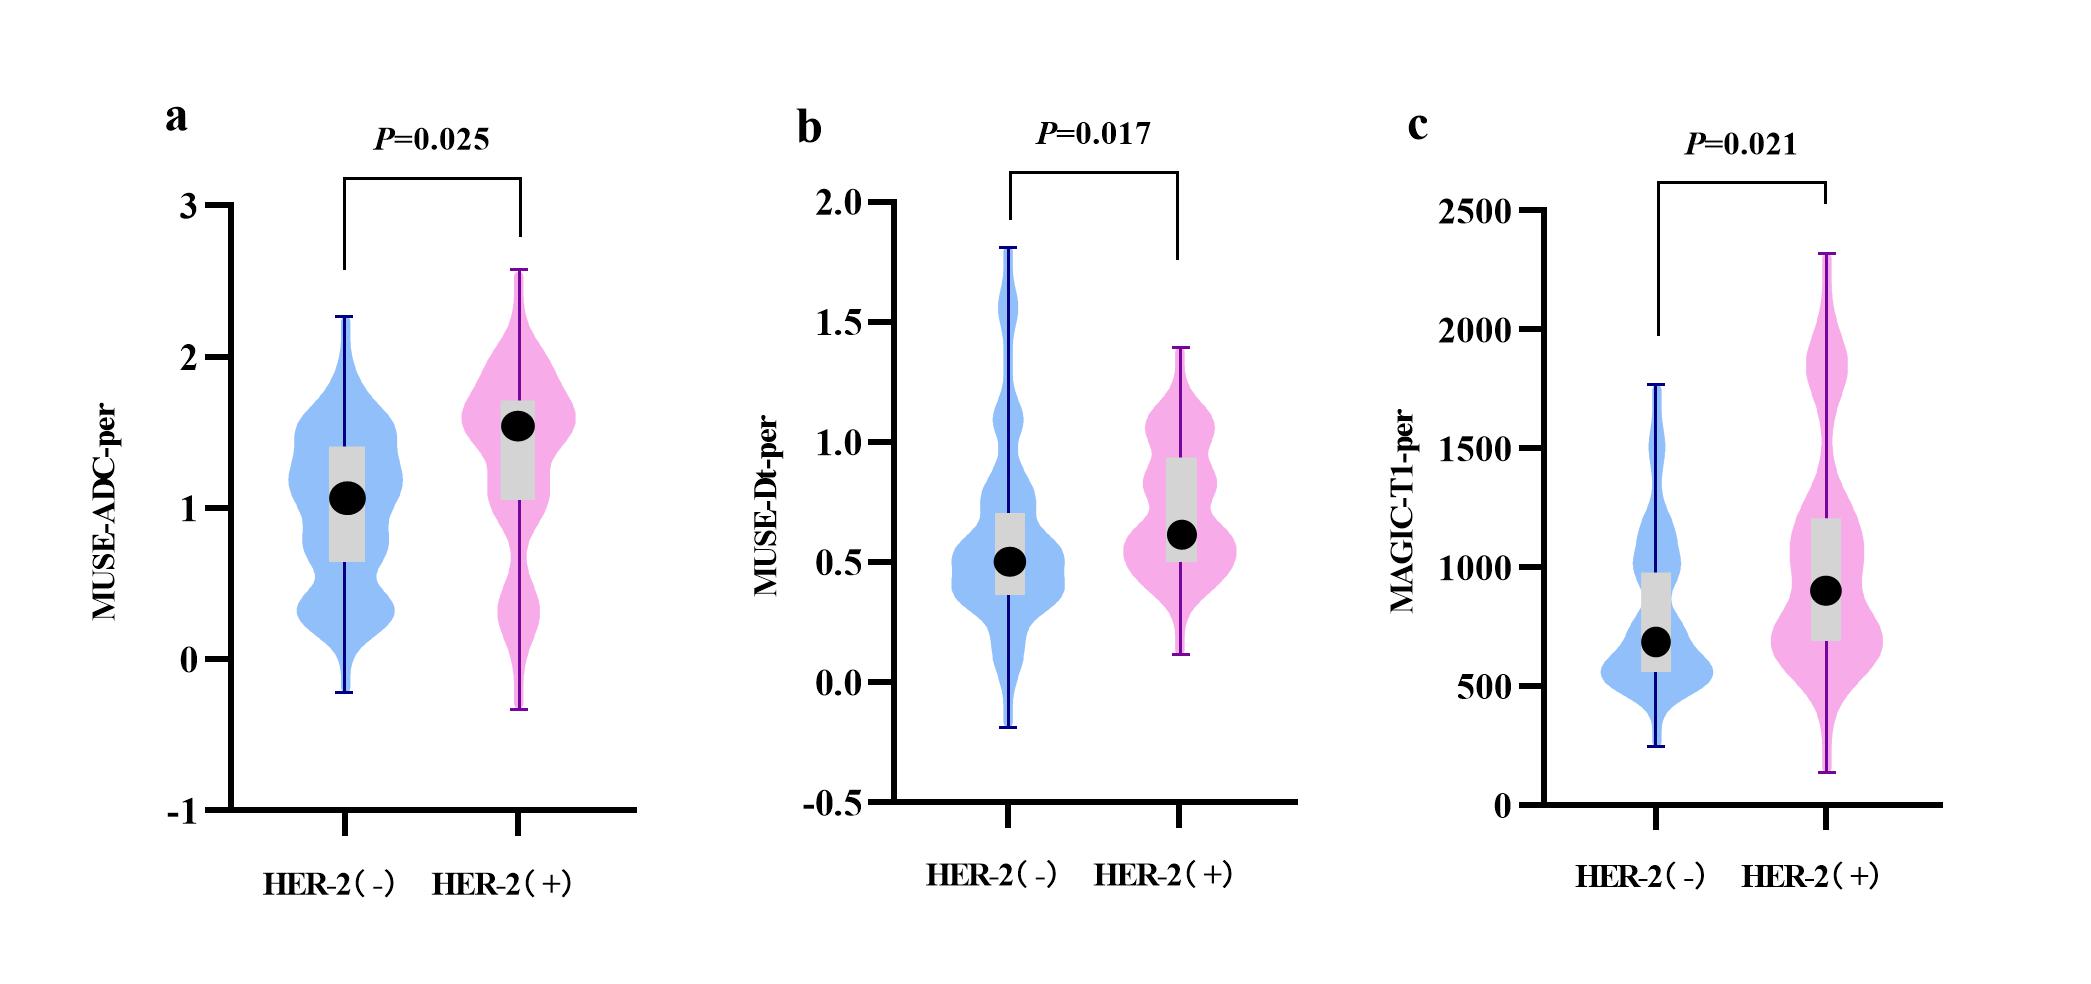
Figure 2. Violin plot of the comparison of parameters
(a) MUSE-ADC-Per, (b) MUSE-Dt-Per and (c) MAGIC-T1-per.There were significant differences in these features between HER(-) and HER(+) in the breast cancer (P < 0.05). The width of the violin plot represents the probability density. The box plots represent the Q3, median, Q1 (the top line, black dot, and bottom line of the box, respectively), maximum and minimum values(the highest and lowest points of a line segment).
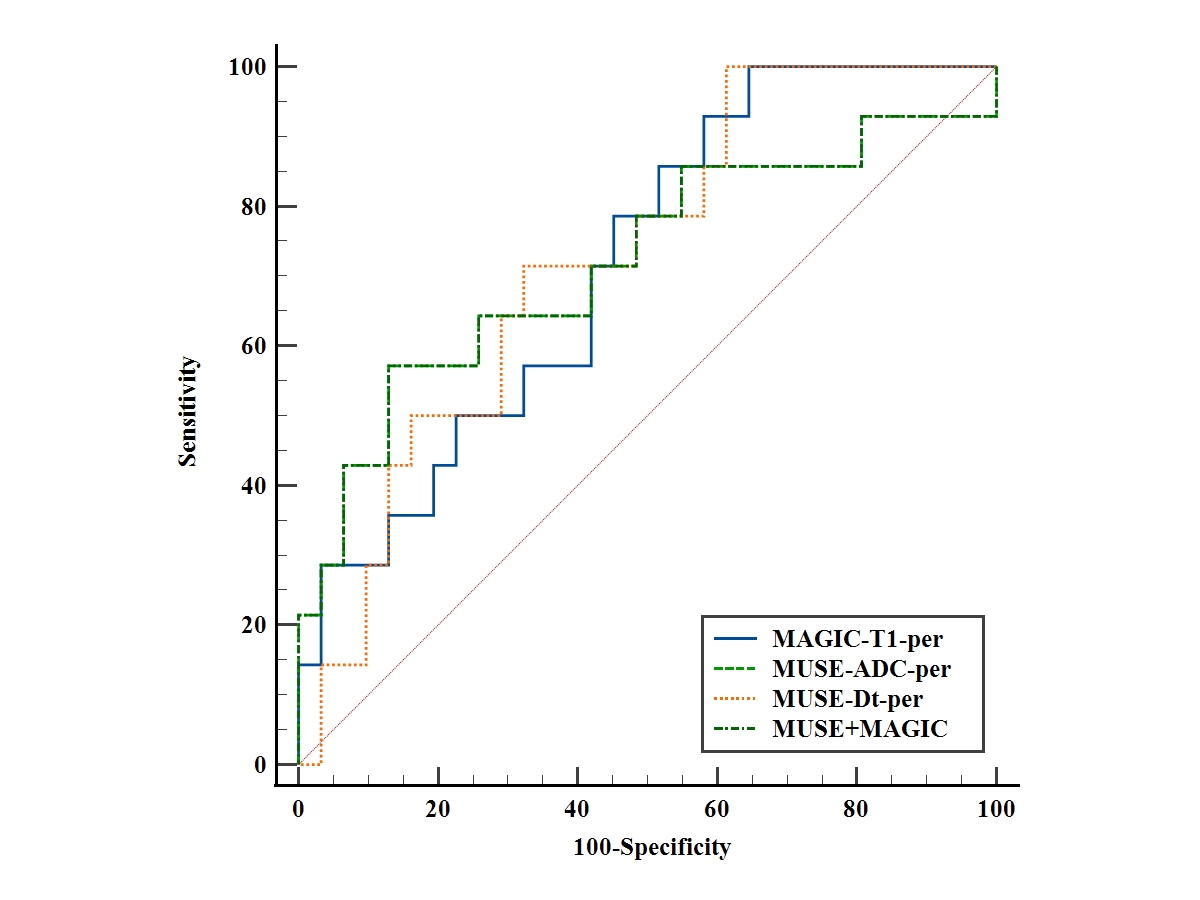
Figure 3. The ROC curves of the MUSE-ADC-Per, MUSE-Dt-Per, MAGIC-T1-per and MUSE+MAGIC model.
ROC curve of a multiparametric prediction model for HER-2(positive) that combined MUSE-ADC-Per, MUSE-Dt-Per, MAGIC-T1-per. The area under the ROC curve was 0.719 (95% CI, 0.540, 0.898).