0847
Identifying Subvoxel Diamagnetic and Paramagnetic Components in Liver and Spleen Using DECOMPOSE-QSM1Electrical Engineering and Computer Sciences, University of California, Berkeley, Berkeley, CA, United States, 2Bernard and Irene Schwartz Center for Biomedical Imaging, Department of Radiology, New York University Grossman School of Medicine, New York, NY, United States, 3Center for Advanced Imaging Innovation and Research (CAI2R), Department of Radiology, New York University Grossman School of Medicine, New York, NY, United States, 4School of Biomedical Engineering, Shanghai Jiao Tong University, Shanghai, China, 5The National Engineering Research Center of Advanced Magnetic Resonance Technologies for Diagnosis and Therapy (NERC-AMRT), Shanghai Jiao Tong University, Shanghai, China, 6Helen Wills Neuroscience Institute, University of California, Berkeley, Berkeley, CA, United States
Synopsis
Keywords: Liver, Quantitative Susceptibility mapping
Motivation: Fibrotic liver, a condition that may cause cirrhosis if untreated, often contains both paramagnetic iron and diamagnetic collagen. While quantitative susceptibility mapping (QSM) calculates the voxel-wise tissue susceptibility, it cannot distinguish the competing effect of iron and collagen within a voxel.
Goal(s): The purpose of this work is to identify sub-voxel paramagnetic and diamagnetic susceptibility sources within the liver and spleen.
Approach: For this purpose, we applied the DECOMPOSE-QSM method to abdominal 1.5T MR images of patients with various levels of iron overload.
Results: The resulting paramagnetic and diamagnetic susceptibility maps demonstrated improved contrast compared to bulk susceptibility maps provided by QSM.
Impact: Identifying sub-voxel paramagnetic and diamagnetic sources within the liver through DECOMPOSE-QSM can facilitate the diagnosis of conditions such as liver fibrosis and hepatic iron overload.
Introduction
Quantitative susceptibility mapping (QSM) is a noninvasive magnetic resonance imaging (MRI) technique that calculates the voxel-wise tissue susceptibility. However, a single imaging voxel can have nearly zero susceptibility due to the coexistence of both paramagnetic and diamagnetic sources within one voxel. Identification of sub-voxel paramagnetic and diamagnetic sources in the liver has the potential to improve MRI’s capability in the diagnosis of conditions such as liver fibrosis, where paramagnetic iron and diamagnetic collagen can coexist1, and hepatic iron overload. In this work, we have computed sub-voxel paramagnetic and diamagnetic sources using DECOMPOSE-QSM2 for abdominal MR images of a group of patients.Methods
Abdominal MRI images from 19 subjects were acquired at a 1.5 T Siemens Aera scanner, employing a multi-echo GRE sequence with the following specifications: TE1/spacing/TE6= 1.44/1.36/8.24 ms, TR = 10 ms, and a spatial resolution of 1.78 × 1.78 × 5 mm3. First, acquired images were separated into fat-only and water-only images using a graph-cut algorithm with a multipeak signal model3. Then, 6 subjects were excluded from the analysis due to the incorrect fat-water separation, resulting in fat-water swaps. The residual images, obtained by subtracting fat-only images from acquired images, were used in the following steps to prevent the confounding effect of fat chemical shifts. Next, the resulting phases were unwrapped using a Laplacian-based method4. Tissue masks were generated with amplitude thresholding applied to magnitude images. Lastly, the tissue phase was extracted with background phase removal using V-SHARP5.The resulting phase images at 6 different echoes were fed to the STAR-QSM algorithm6. Calculated susceptibility maps for each echo, combined with the multi-echo magnitude image, were input into the DECOMPOSE-QSM algorithm, yielding paramagnetic component susceptibility (PCS) and diamagnetic component susceptibility (DCS) maps for quantitative analysis2. Thresholded susceptibility maps with only positive and negative QSM values were constructed for comparison. R2* maps were estimated with the fat-water separation algorithm. The correlations between R2*, PCS, DCS, and susceptibility were investigated within two defined regions of interest (ROI) in the liver and spleen. Additionally, the correlation between the liver and spleen was examined by evaluating the same metrics within the liver and spleen ROI of the same subject.
Results
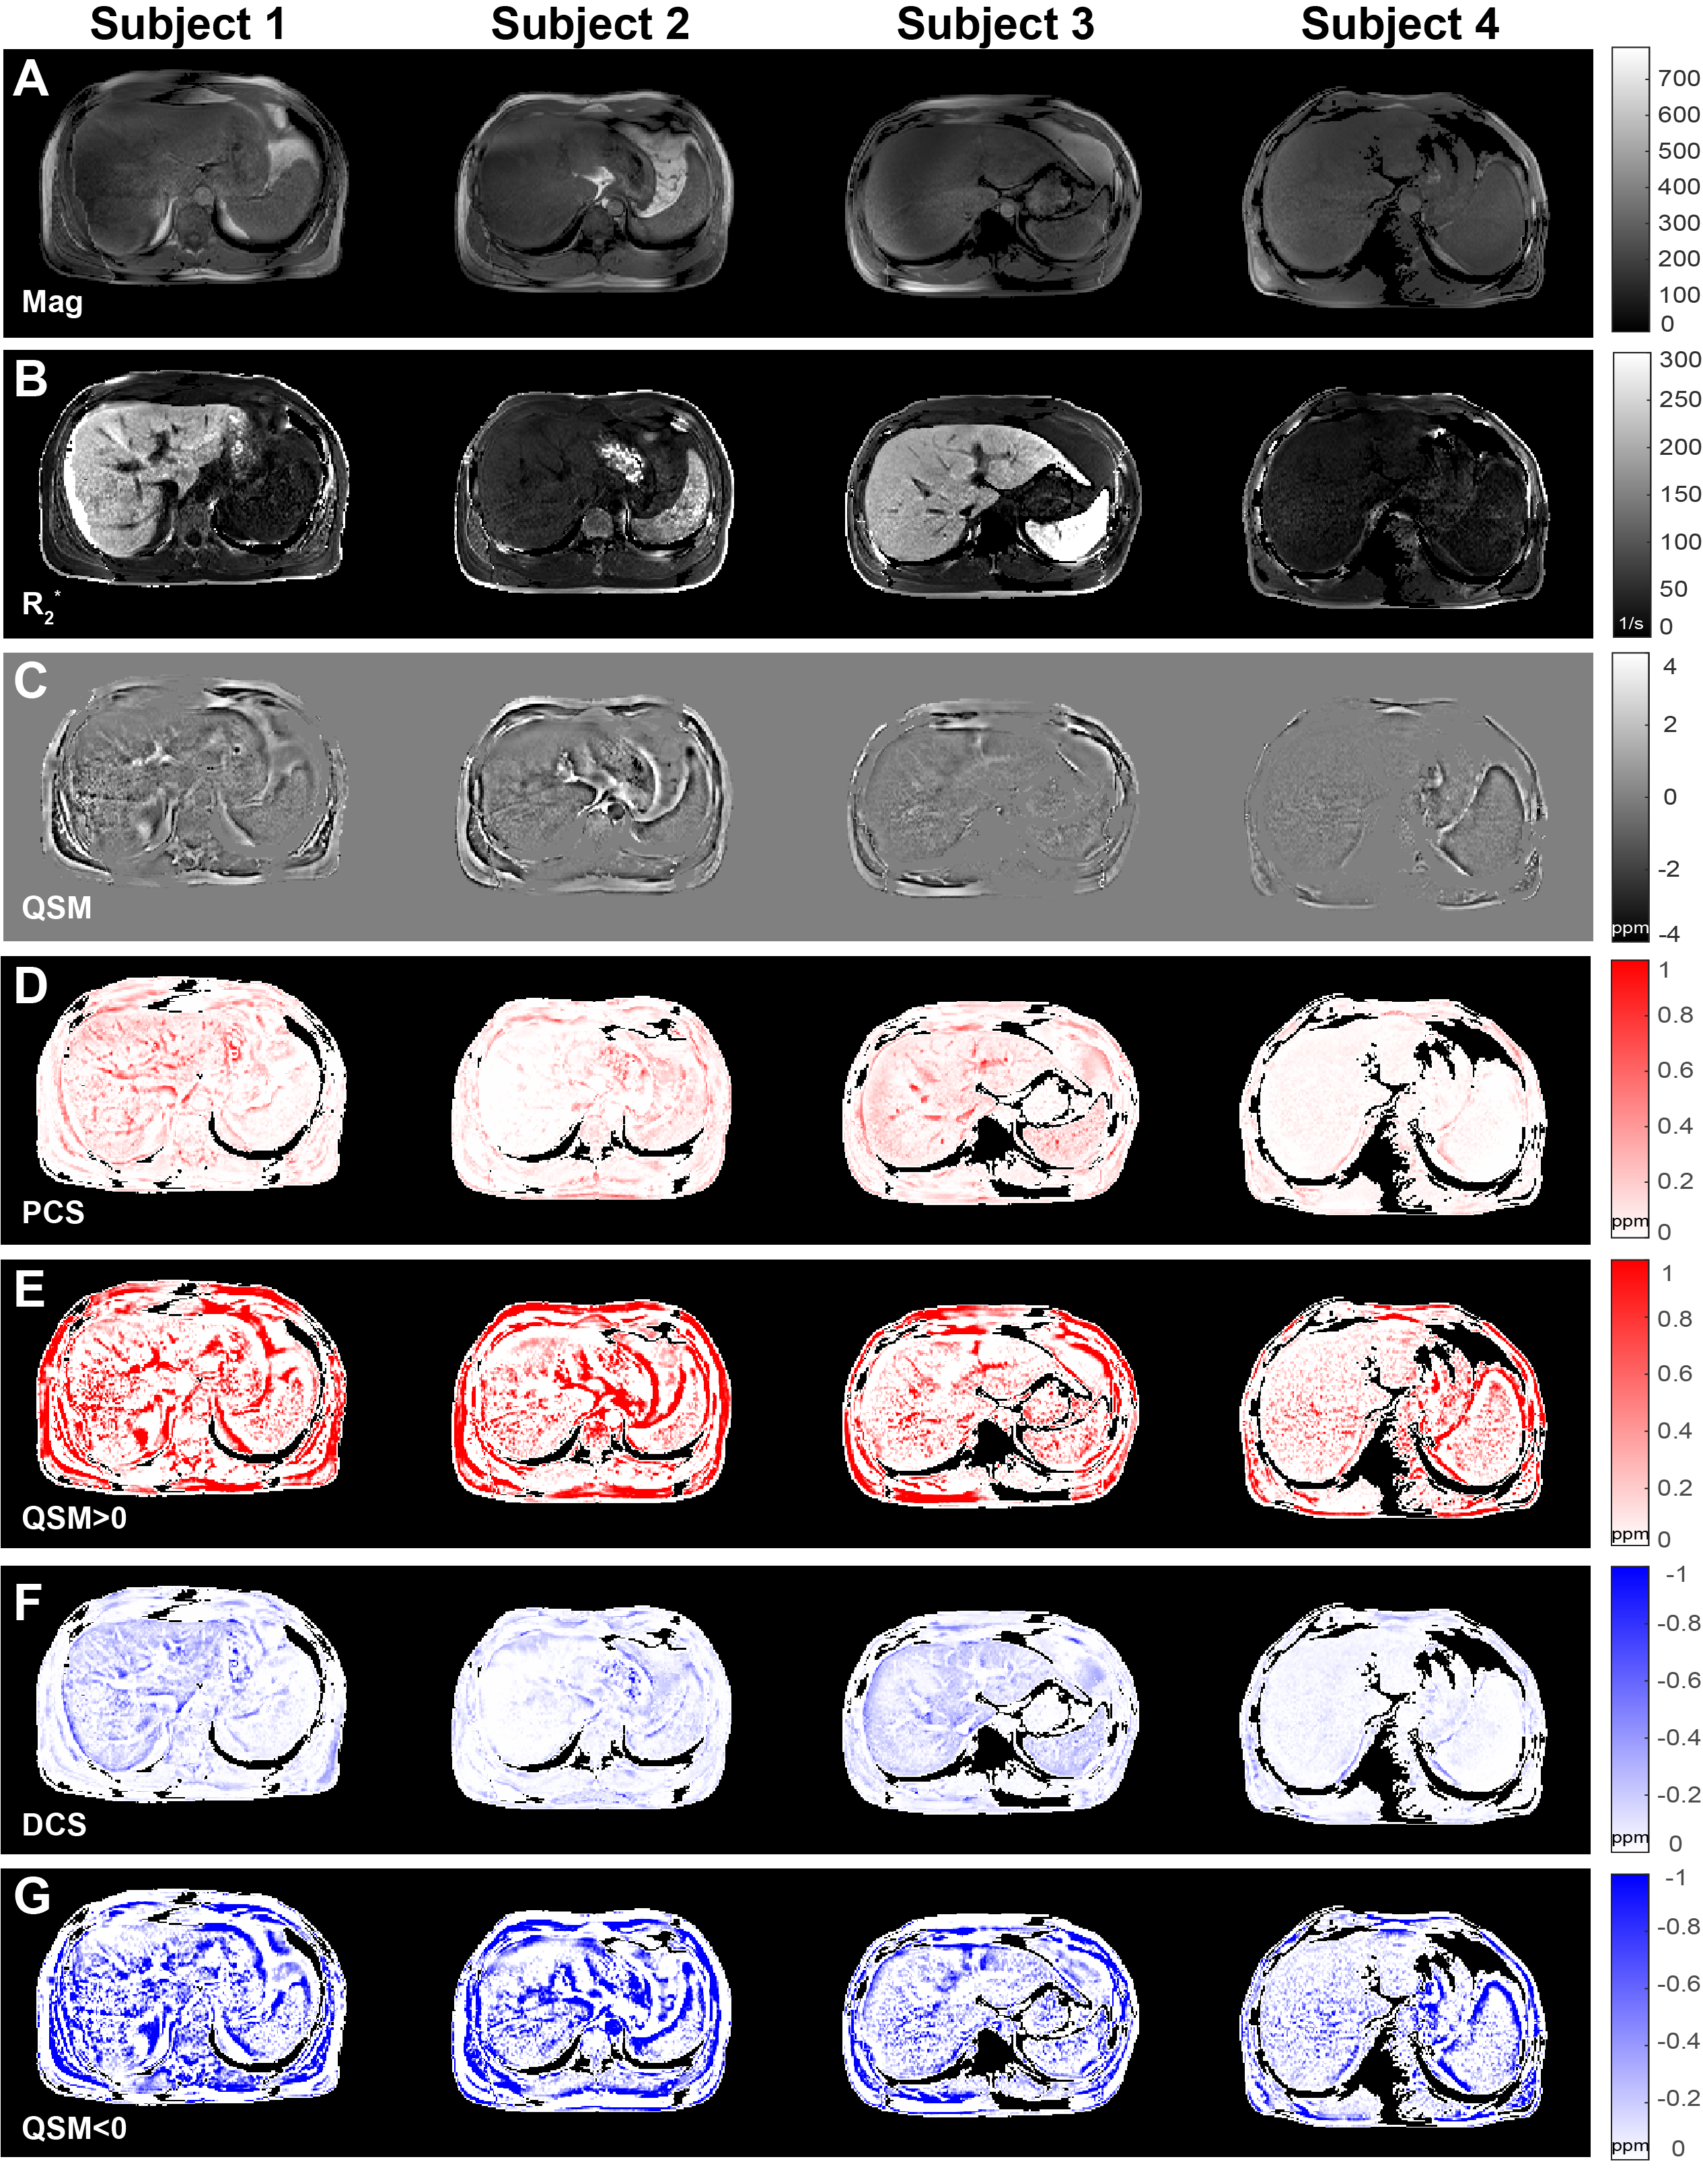
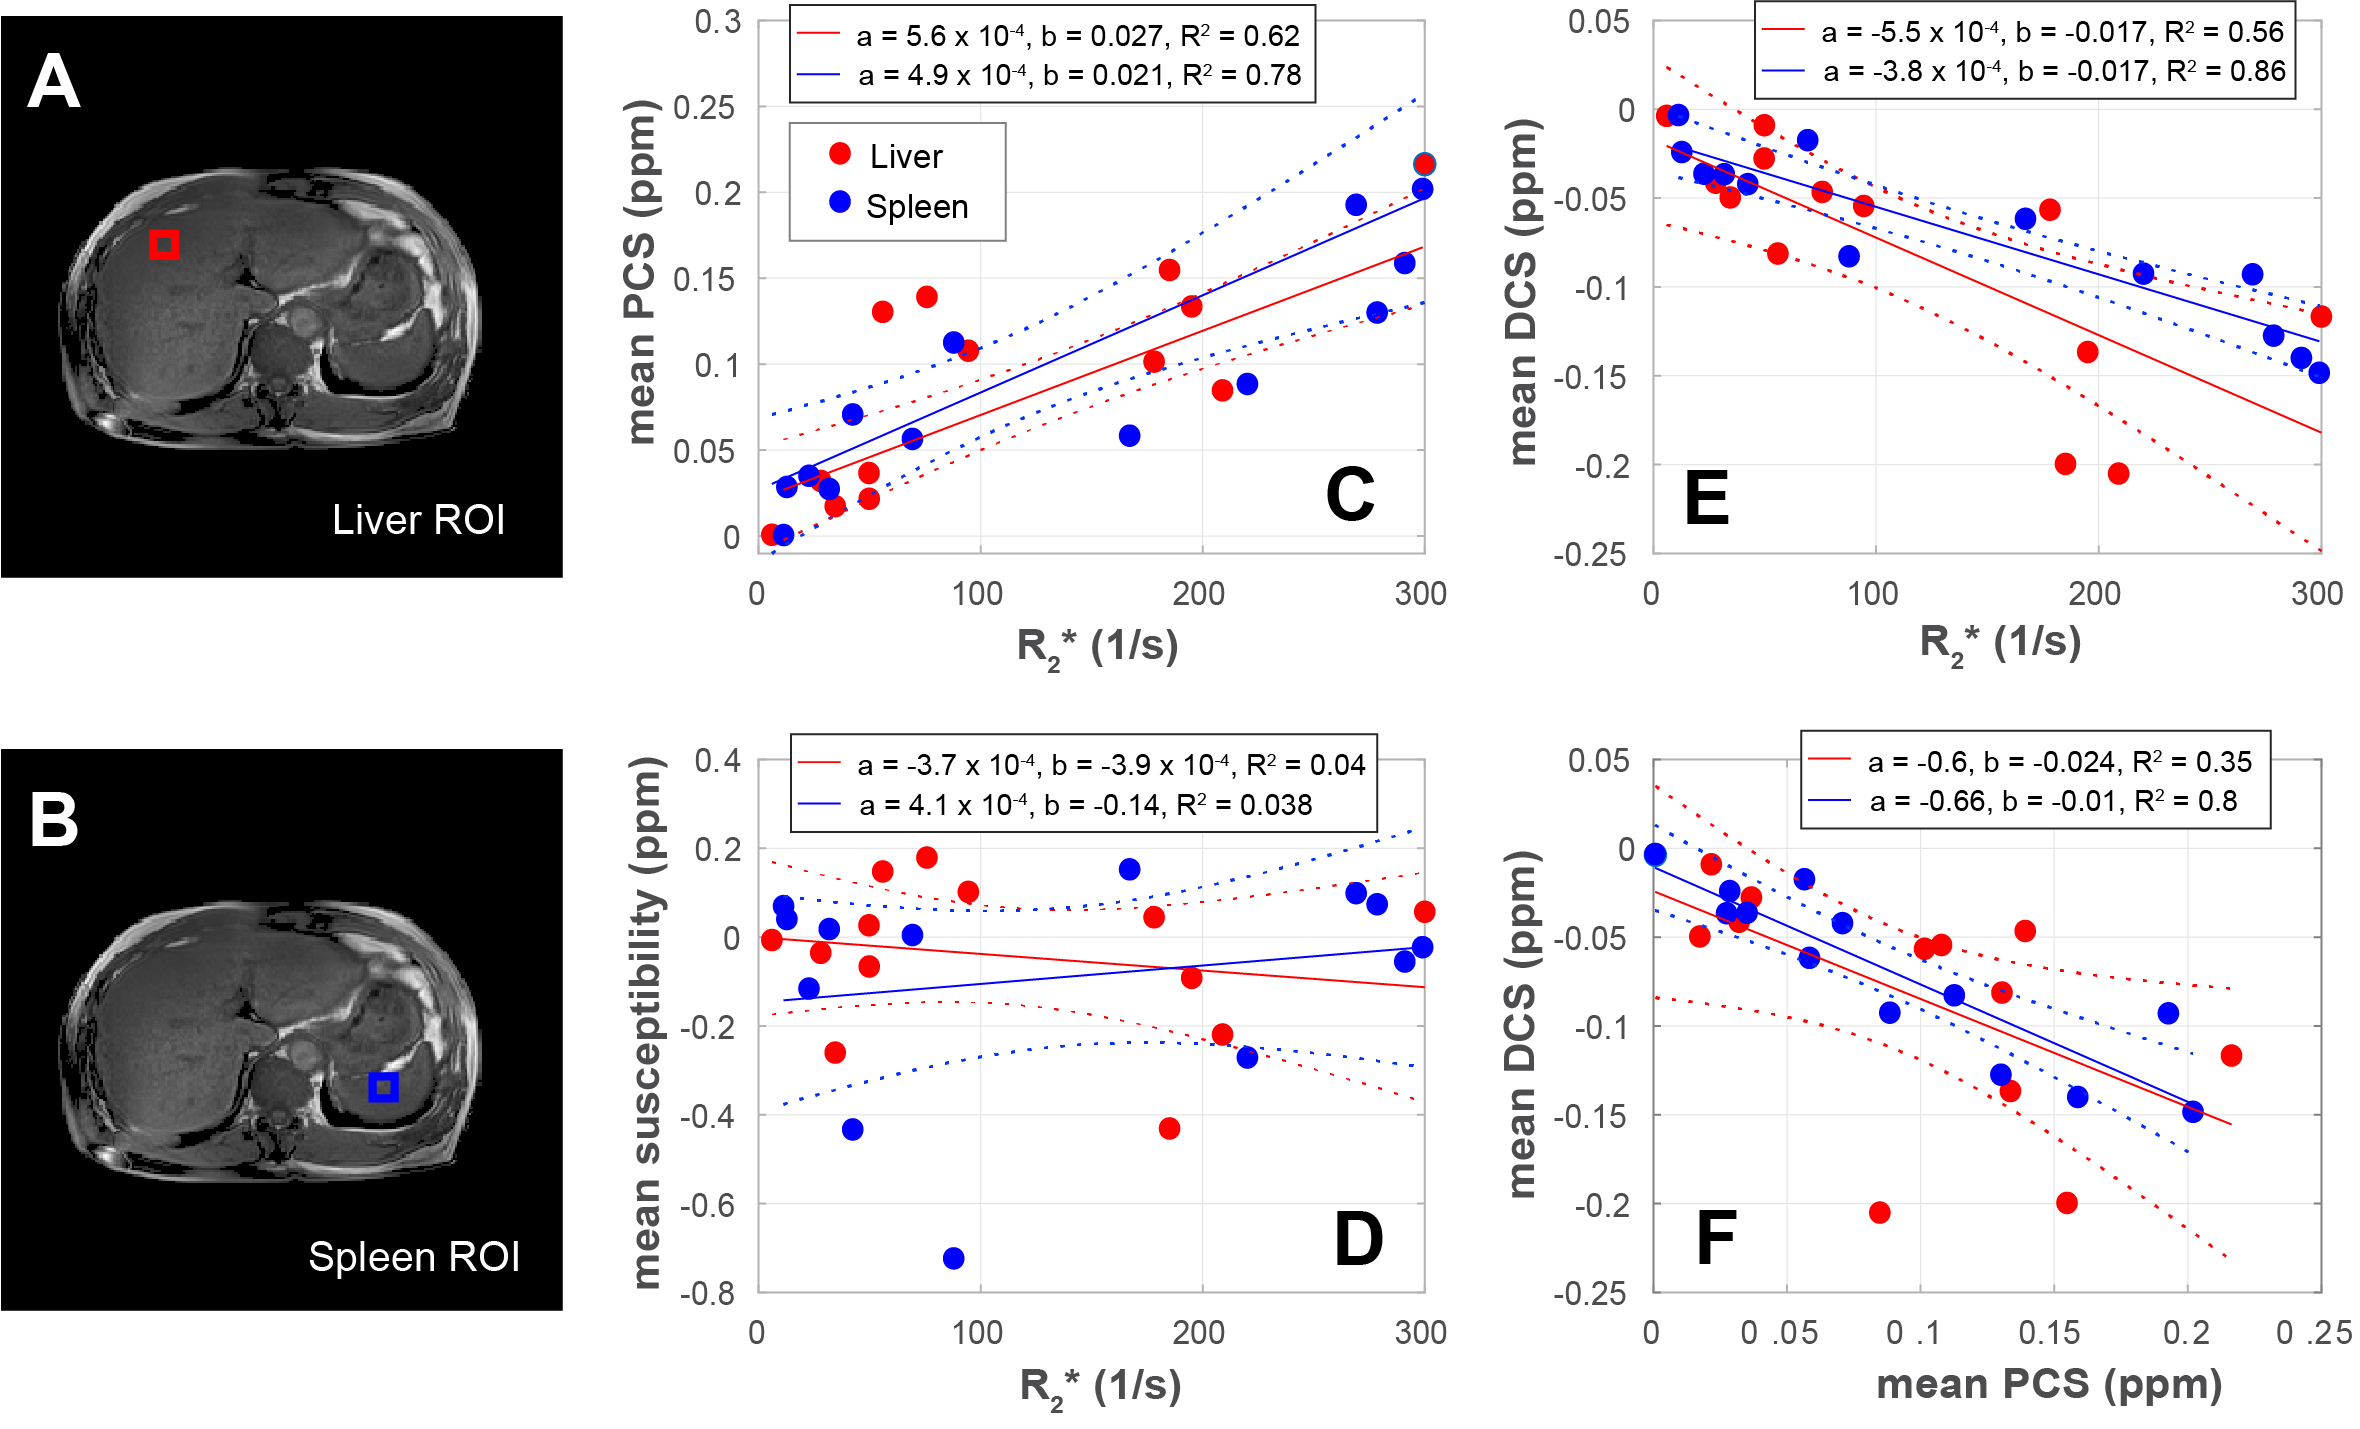
Figure 1 shows magnitude images, R2*, susceptibility, PCS, DCS, and thresholded susceptibility maps for 4 subjects. The vessels reflected in PCS maps may be attributed to the venous blood, which is known to be paramagnetic due to deoxygenated hemoglobin7. Additionally, subjects exhibiting a substantial presence of paramagnetic and diamagnetic sources in their liver, suggesting the possible presence of iron and collagen, may warrant further investigation for potential liver fibrosis.Figure 2 shows the chosen ROIs for the liver and spleen, along with the correlation between mean values calculated for PCS, DCS, bulk susceptibility, and R2* within those ROIs. Although bulk susceptibility values do not exhibit a significant correlation with R2*, a linear relation is evident between PCS and R2* as well as DCS and R2*. This strong correlation suggests that PCS can serve as a more robust iron content indicator than bulk susceptibility, as higher R2* values have previously been linked to higher iron levels in the liver8.
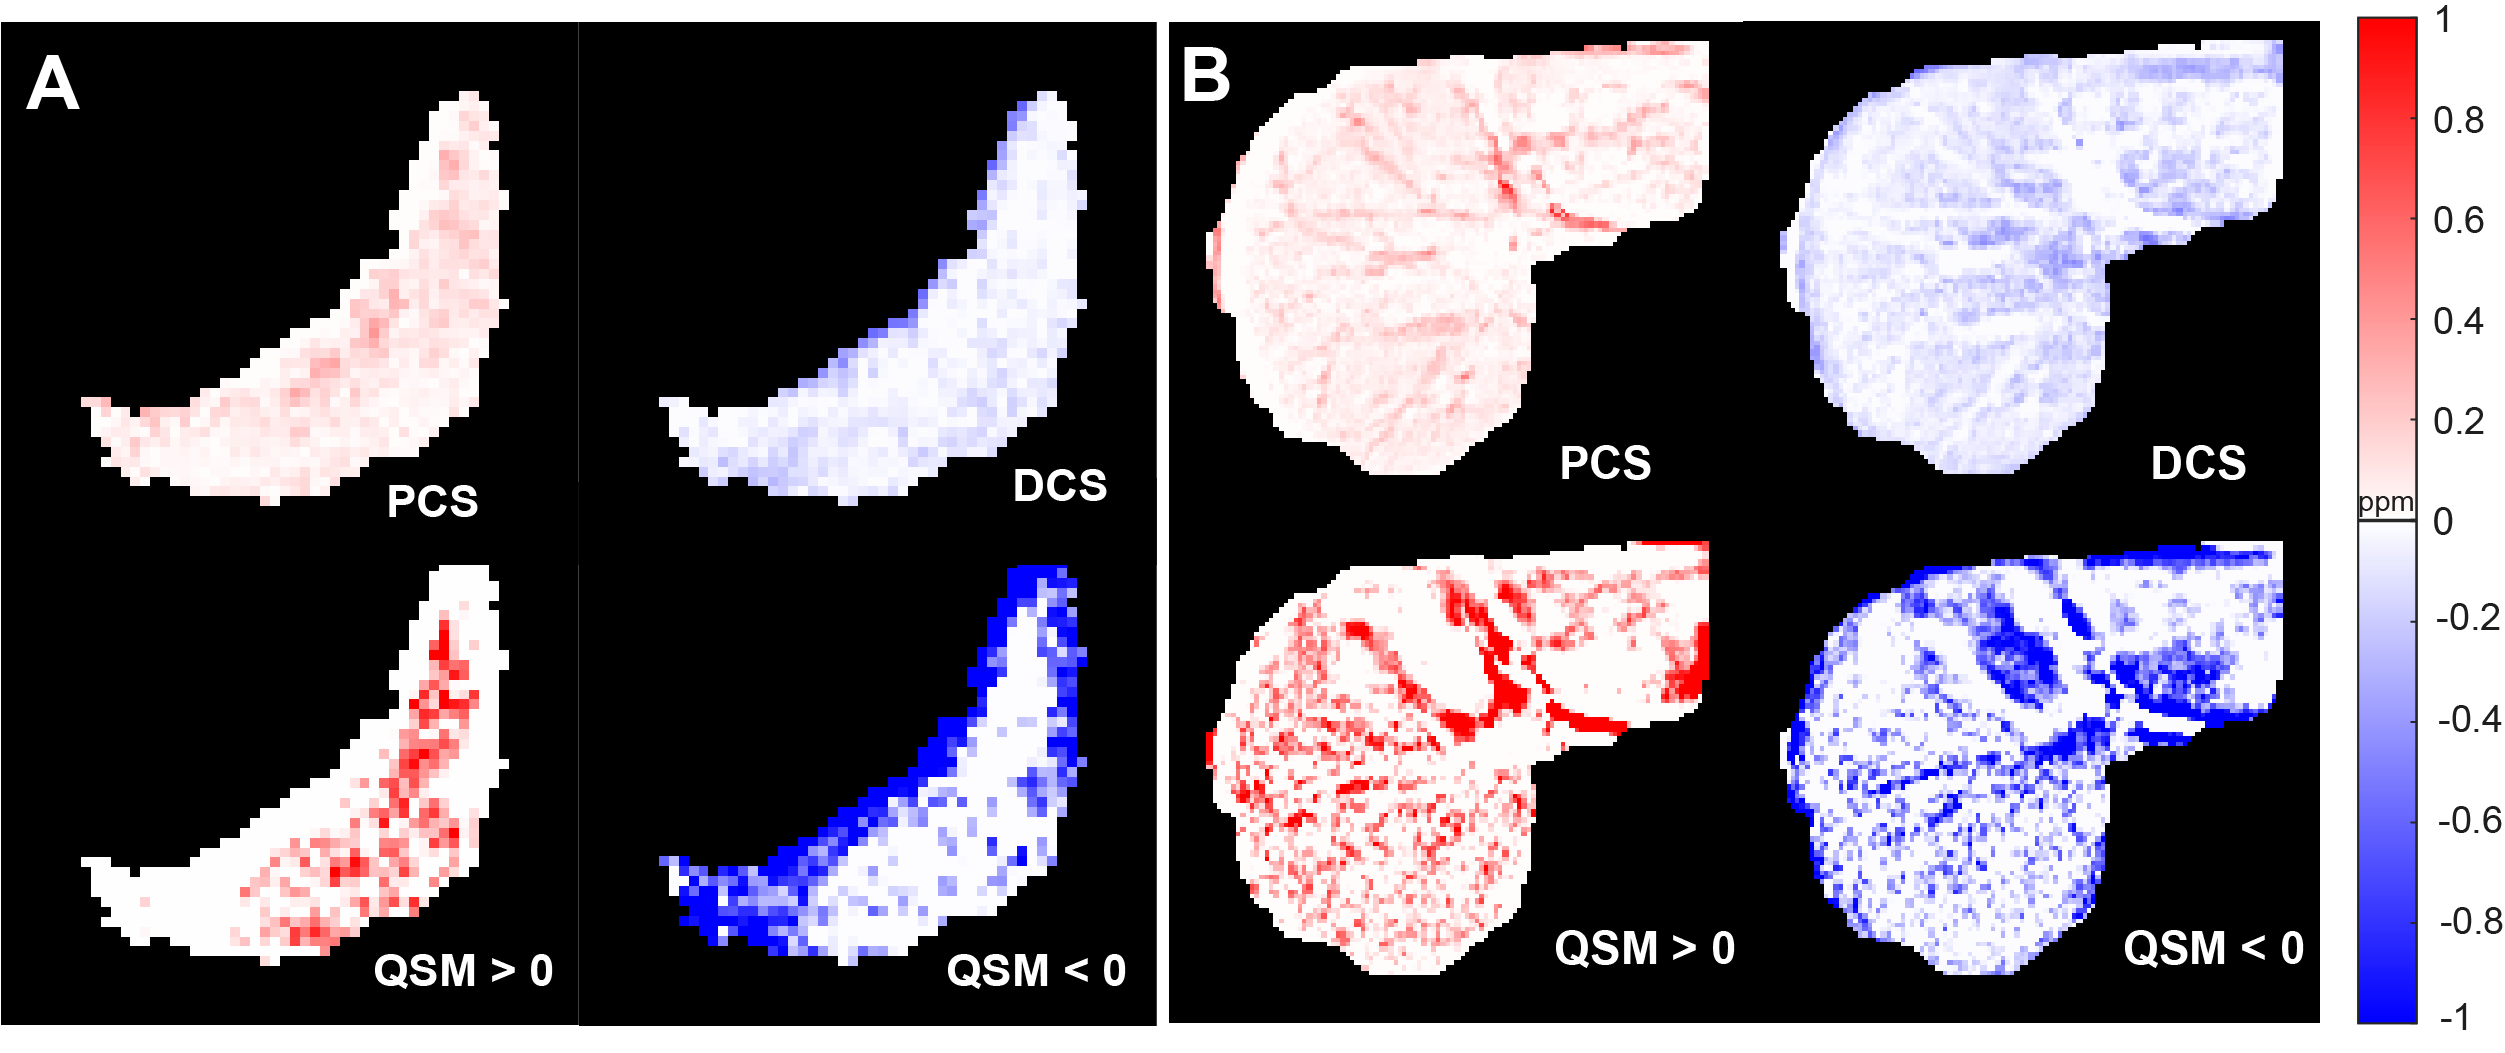
Figure 3 displays the calculated PCS, DCS, and thresholded susceptibility maps for masked liver and spleen. The visual assessment suggests that PCS and DCS also suffer from tissue-air interfaces as QSM but offer improved contrast, e.g., for vessels, compared to QSM. Although calculated PCS and DCS are found to be strongly correlated in general, these results suggest their occurrence is not mutually exclusive.
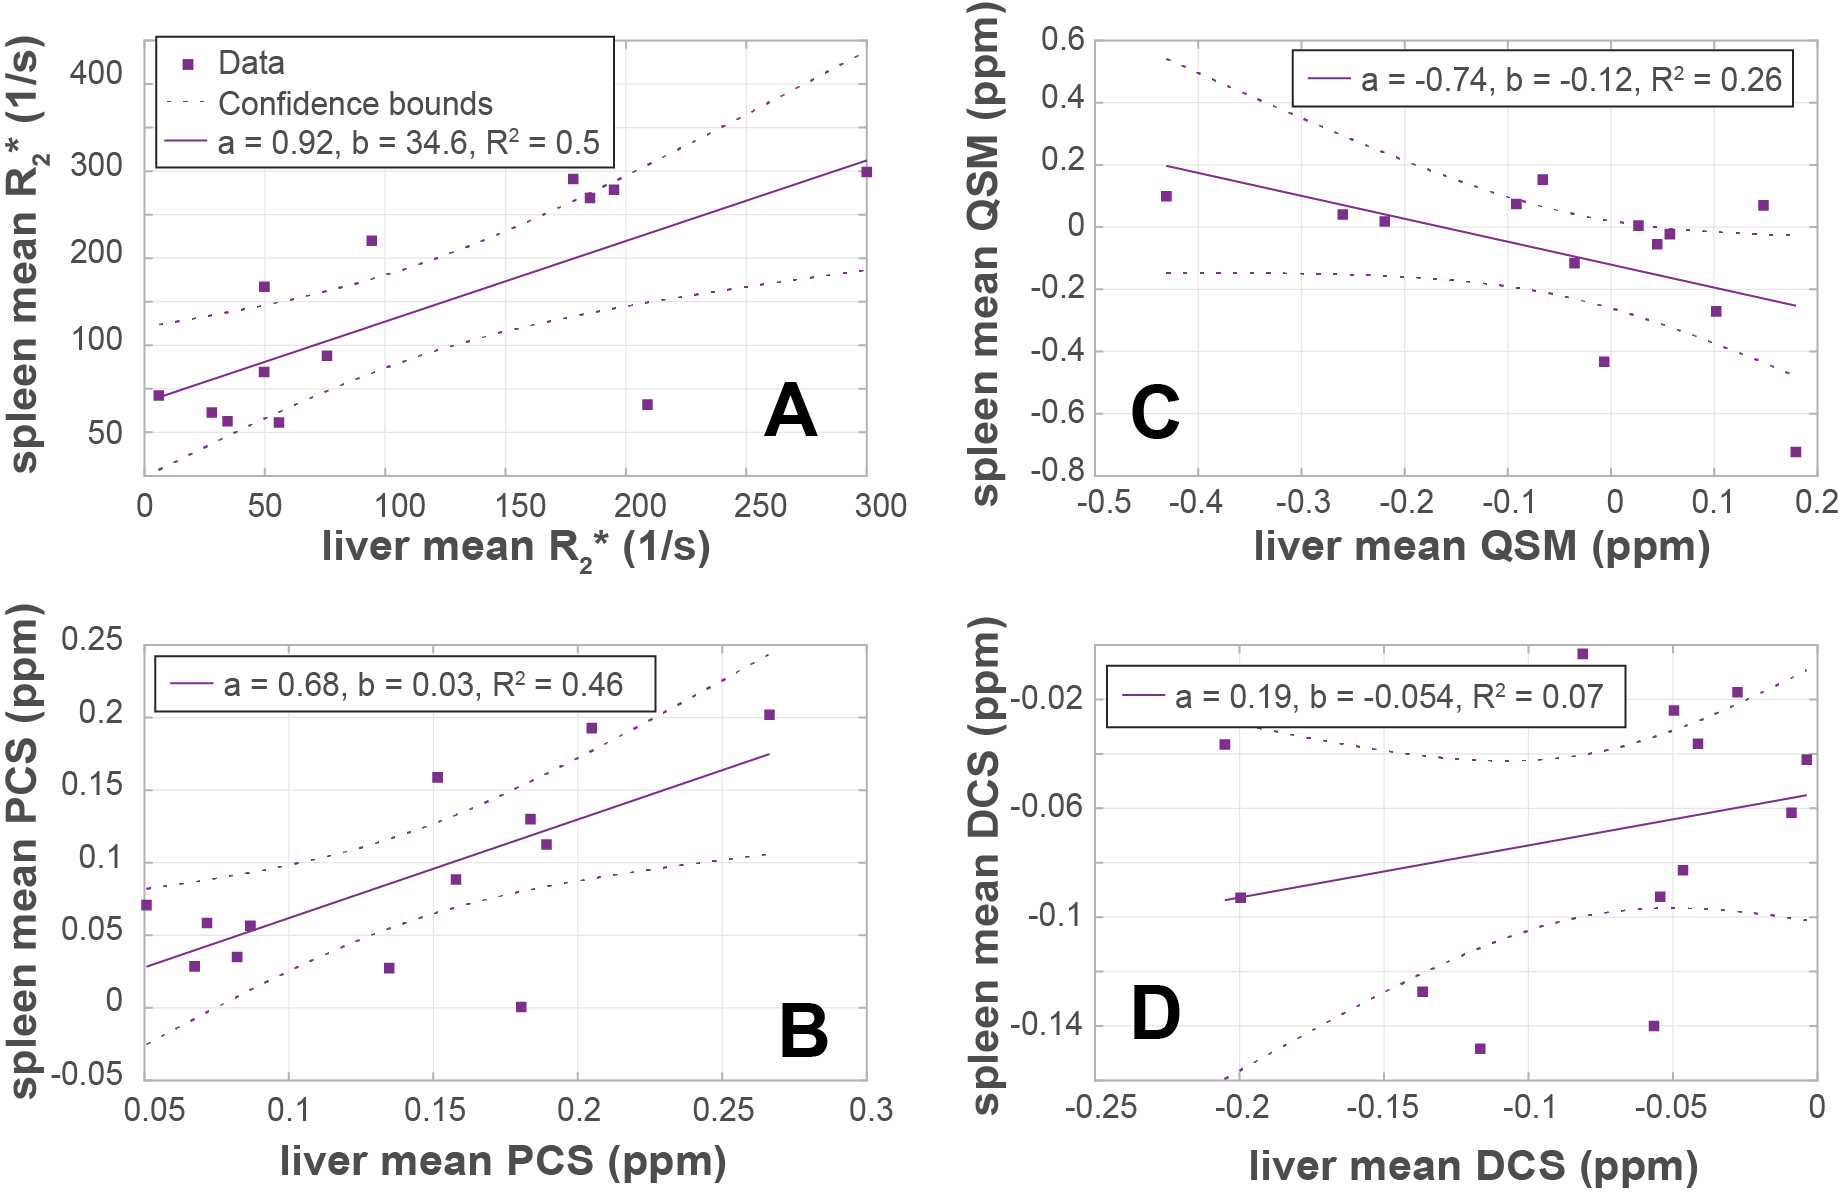
Figure 4 presents the correlation between the liver and spleen ROI of the same subject in terms of mean R2*, PCS, bulk susceptibility, and DCS. Notably, the DCS values for the liver and spleen are not significantly correlated (R2 = 0.07), while the PCS values for the liver and spleen exhibit a stronger correlation (R2 = 0.46).
Discussion and Conclusion
We have demonstrated that the previously proposed DECOMPOSE-QSM algorithm can be utilized to identify sub-voxel paramagnetic and diamagnetic sources for the liver and spleen. Quantitative and qualitative analysis of 13 subjects suggest that PCS and DCS maps offer improved contrast, e.g., for vessels, than bulk susceptibility provided by QSM.The fat-water separation algorithm caused fat-water swaps in 31% of the subjects, indicating a high prevalence. This highlights the necessity for a more robust fat-water separation method. Furthermore, abdominal MRI often features tissue air interfaces, emphasizing the importance of accurate masking and background phase removal.
Acknowledgements
No acknowledgement found.References
- Wei H, Decker K, Nguyen H, Cao S, Tsai TY, Dianne Guy C, Bashir M, Liu C. Imaging diamagnetic susceptibility of collagen in hepatic fibrosis using susceptibility tensor imaging. Magn Reson Med. 2020 Apr;83(4):1322-1330.
- Chen J, Gong NJ, Chaim KT, Otaduy MCG, Liu C. Decompose quantitative susceptibility mapping (QSM) to sub-voxel diamagnetic and paramagnetic components based on gradient-echo MRI data. Neuroimage. 2021 Nov 15;242:118477.
- Hernando D, Kellman P, Haldar JP, Liang ZP. Robust water/fat separation in the presence of large field inhomogeneities using a graph cut algorithm. Magn Reson Med. 2010 Jan;63(1):79-90.
- Li W, Wu B, Liu C. Quantitative susceptibility mapping of human brain reflects spatial variation in tissue composition. Neuroimage. 2011 Apr 15;55(4):1645-56.
- Wu B, Li W, Guidon A, Liu C. Whole brain susceptibility mapping using compressed sensing. Magn Reson Med. 2012 Jan;67(1):137-47.
- Wei H, Dibb R, Zhou Y, Sun Y, Xu J, Wang N, Liu C. Streaking artifact reduction for quantitative susceptibility mapping of sources with large dynamic range. NMR Biomed. 2015 Oct;28(10):1294-303.
- Wang Y, Yu Y, Li D, Bae KT, Brown JJ, Lin W, Haacke EM. Artery and vein separation using susceptibility-dependent phase in contrast-enhanced MRA. J Magn Reson Imaging. 2000 Nov;12(5):661-70.
- Sharma SD, Hernando D, Horng DE, Reeder SB. Quantitative susceptibility mapping in the abdomen as an imaging biomarker of hepatic iron overload. Magn Reson Med. 2015 Sep;74(3):673-83.
Figures