0846
Hepatic inflammation grading in diffuse liver disease using three-dimensional multifrequency MR elastography1Department of Radiation Physics, and Department of Health, Medicine and Caring Sciences, Linköping University, Linköping, Sweden, 2Center for Medical Image Science and Visualization, Linköping University, Linköping, Sweden, 3Department of Biomedical Engineering, Linköping University, Linköping, Sweden, 4Department of Radiology, and Department of and Health, Medicine and Caring Sciences, Linköping University, Linköping, Sweden, 5Department of Clinical Pathology and Clinical Genetics, Department of Biomedical and Clinical Sciences, Linköping University, Linköping, Sweden, 6Department of Gastroenterology and Hepatology, Department of Health, Medicine and Caring Sciences, Linköping University, Linköping, Sweden, 7Division of Imaging Sciences and Biomedical Engineering, King's College London, London, United Kingdom
Synopsis
Keywords: Liver, Inflammation, Diffuse liver disease, multifrequency MRE, 3D MRE
Motivation: Additional viscoelastic parameters measured using 3D multifrequency MRE have been reported to detect inflammation in the liver. However, a clinical cohort with multiple etiologies has not been well-studied.
Goal(s): Our goal was to determine the role of 3D multifrequency MRE for staging hepatic inflammation in diffuse liver disease with various etiologies.
Approach: Viscoelastic parameters were derived from 3D MRE with low, medium and high vibration frequencies, and compared with histological assessment.
Results: The moduli |G*|, G’ and G” and the exponent of power law γ were found to be associated with inflammation.
Impact: Three-dimensional multifrequency MRE, with its ability to provide additional viscoelastic parameters, could be a powerful tool for the non-invasive detection of inflammation activity in patients with diffuse liver disease.
Introduction
Diffuse liver disease is a growing public health problem worldwide1. Its etiology spectrum is wide, including viral hepatitis, alcohol hepatitis, fatty liver, autoimmune and metabolic disorders. Early detection is important since the symptoms of early liver inflammation and fibrosis remain nonspecific.Magnetic resonance elastography (MRE) is a non-invasive tool that has been proven to stage liver fibrosis in clinical settings2, but the origin of tissue stiffness remains unclear3. Inflammation was also found to increase liver stiffness4. Additionally, with three-dimensional (3D) and multifrequency MRE, viscoelastic parameters can be calculated completely, i.e., loss modulus G″, the damping ratio ζ, and the frequency-independent power law exponent γ. These additional parameters have been reported to detect inflammation, but in limited etiologies, such as viral hepatitis5 and nonalcoholic fatty liver disease (NAFLD)6. A clinical cohort with a wide spectrum of etiologies was not well-studied previously. Thus, this study aimed to determine the role of 3D multifrequency MRE for staging inflammation in patients with diffuse liver disease.
Methods
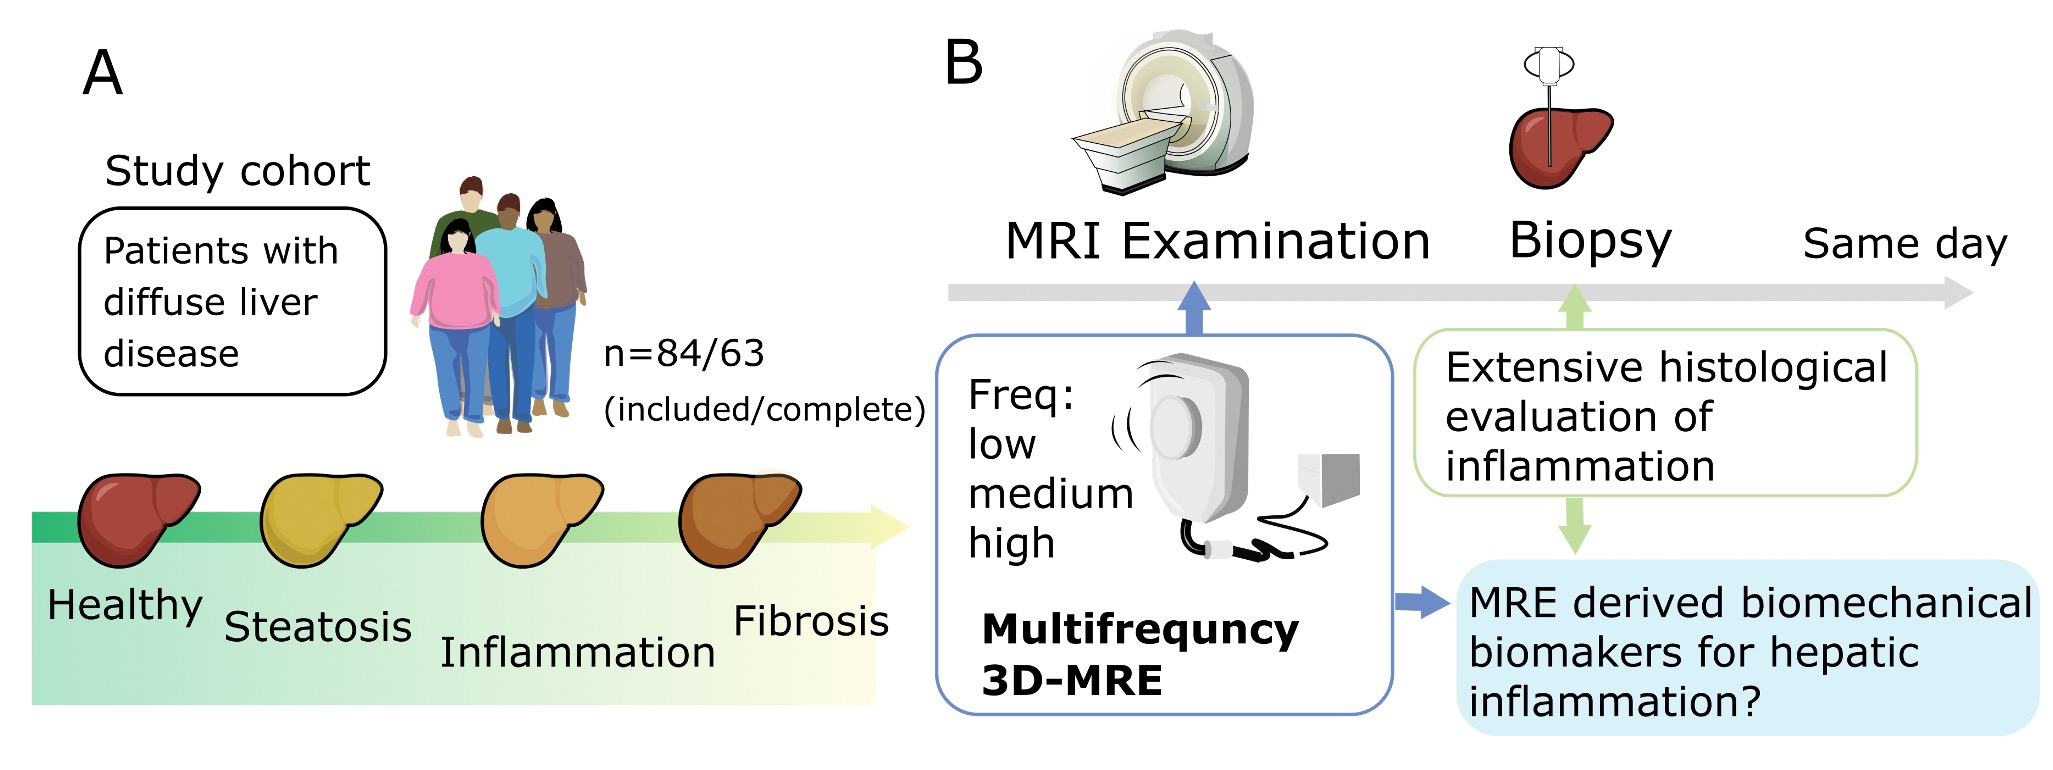
A total of 63 patients with diffuse liver disease underwent both 3D multifrequency MRE and liver biopsy (Figure 1). MRE was performed on a 3 T Ingenia MR-scanner (Philips Healthcare, Best, The Netherlands) with three successive vibrations (16-33-50 Hz or 18-36-54 Hz) generated by an electromagnetic transducer (Philips Healthcare, Hamburg, Germany). Images were acquired using a modified multi-slice gradient echo sequence, eXpresso7. Liver biopsies obtained within one hour were assessed with the Ishak inflammation score (I0-18)8 and Kleiner fibrosis score (F0-4)9.For MRE reconstruction, the shear modulus (|G*|), storage modulus (G′) and loss modulus (G″) were calculated on a pixel-per-pixel basis using a software, KIR (King's College, London, UK)10. The parametric maps of the damping ratio (ζ) were calculated with ζ = G″/2G′. Additionally, the modulus maps of |G*| at low, medium and high excitation frequencies (ω) were fitted on a power law11, |G*|(ω) = Aωγ, and the exponent of the law (γ) was extracted. Regions of interest (ROIs) were placed near the transducer while avoiding large blood vessels and liver edges. Biomechanical properties for each patient were measured as the mean values weighted by the ROI-size within the ROIs from the central 4 slices. The post-processing of MRE-images was performed using MATLAB (R2022a, MathWorks, USA).
The viscoelastic parameters measured at 50 or 54 Hz were chosen for high-frequency analysis. Mann-Whitney and Kruskal-Wallis tests were performed to compare the viscoelastic parameters with the inflammation activities. The associations between them were then assessed using Spearman’s rank correlation. The diagnostic performance for grading inflammation was assessed using receiver operating characteristic (ROC) analysis. The statistical analyses were performed with SPSS (v.29.0, IBM, USA).
Results and Discussion
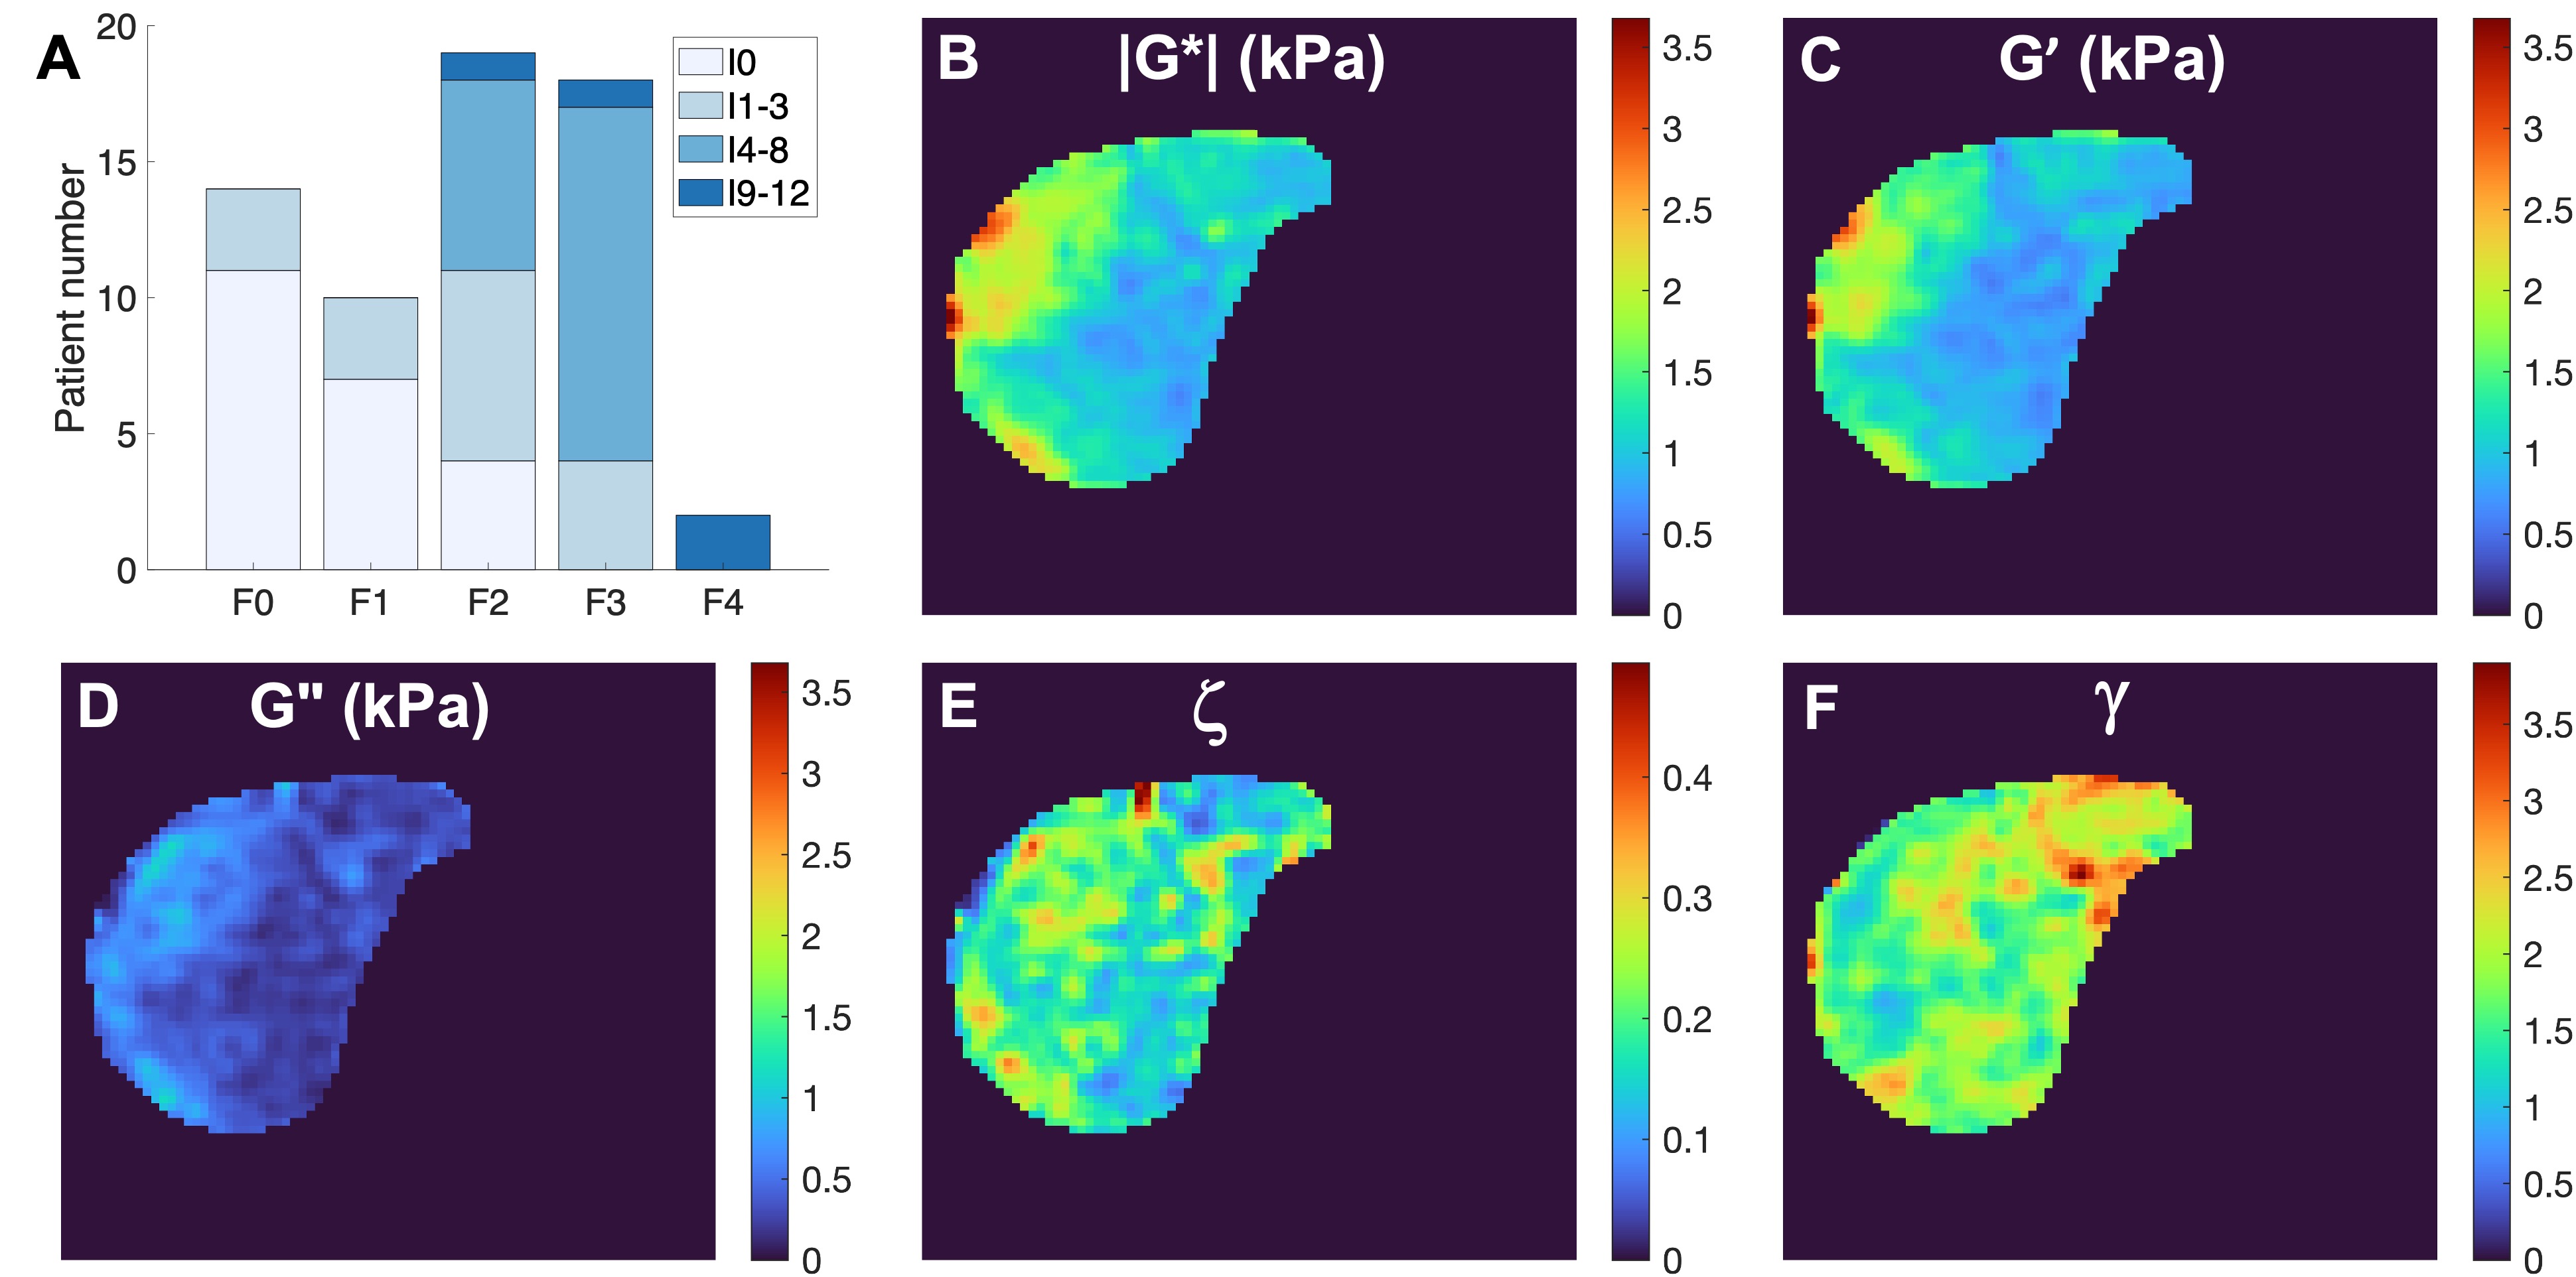
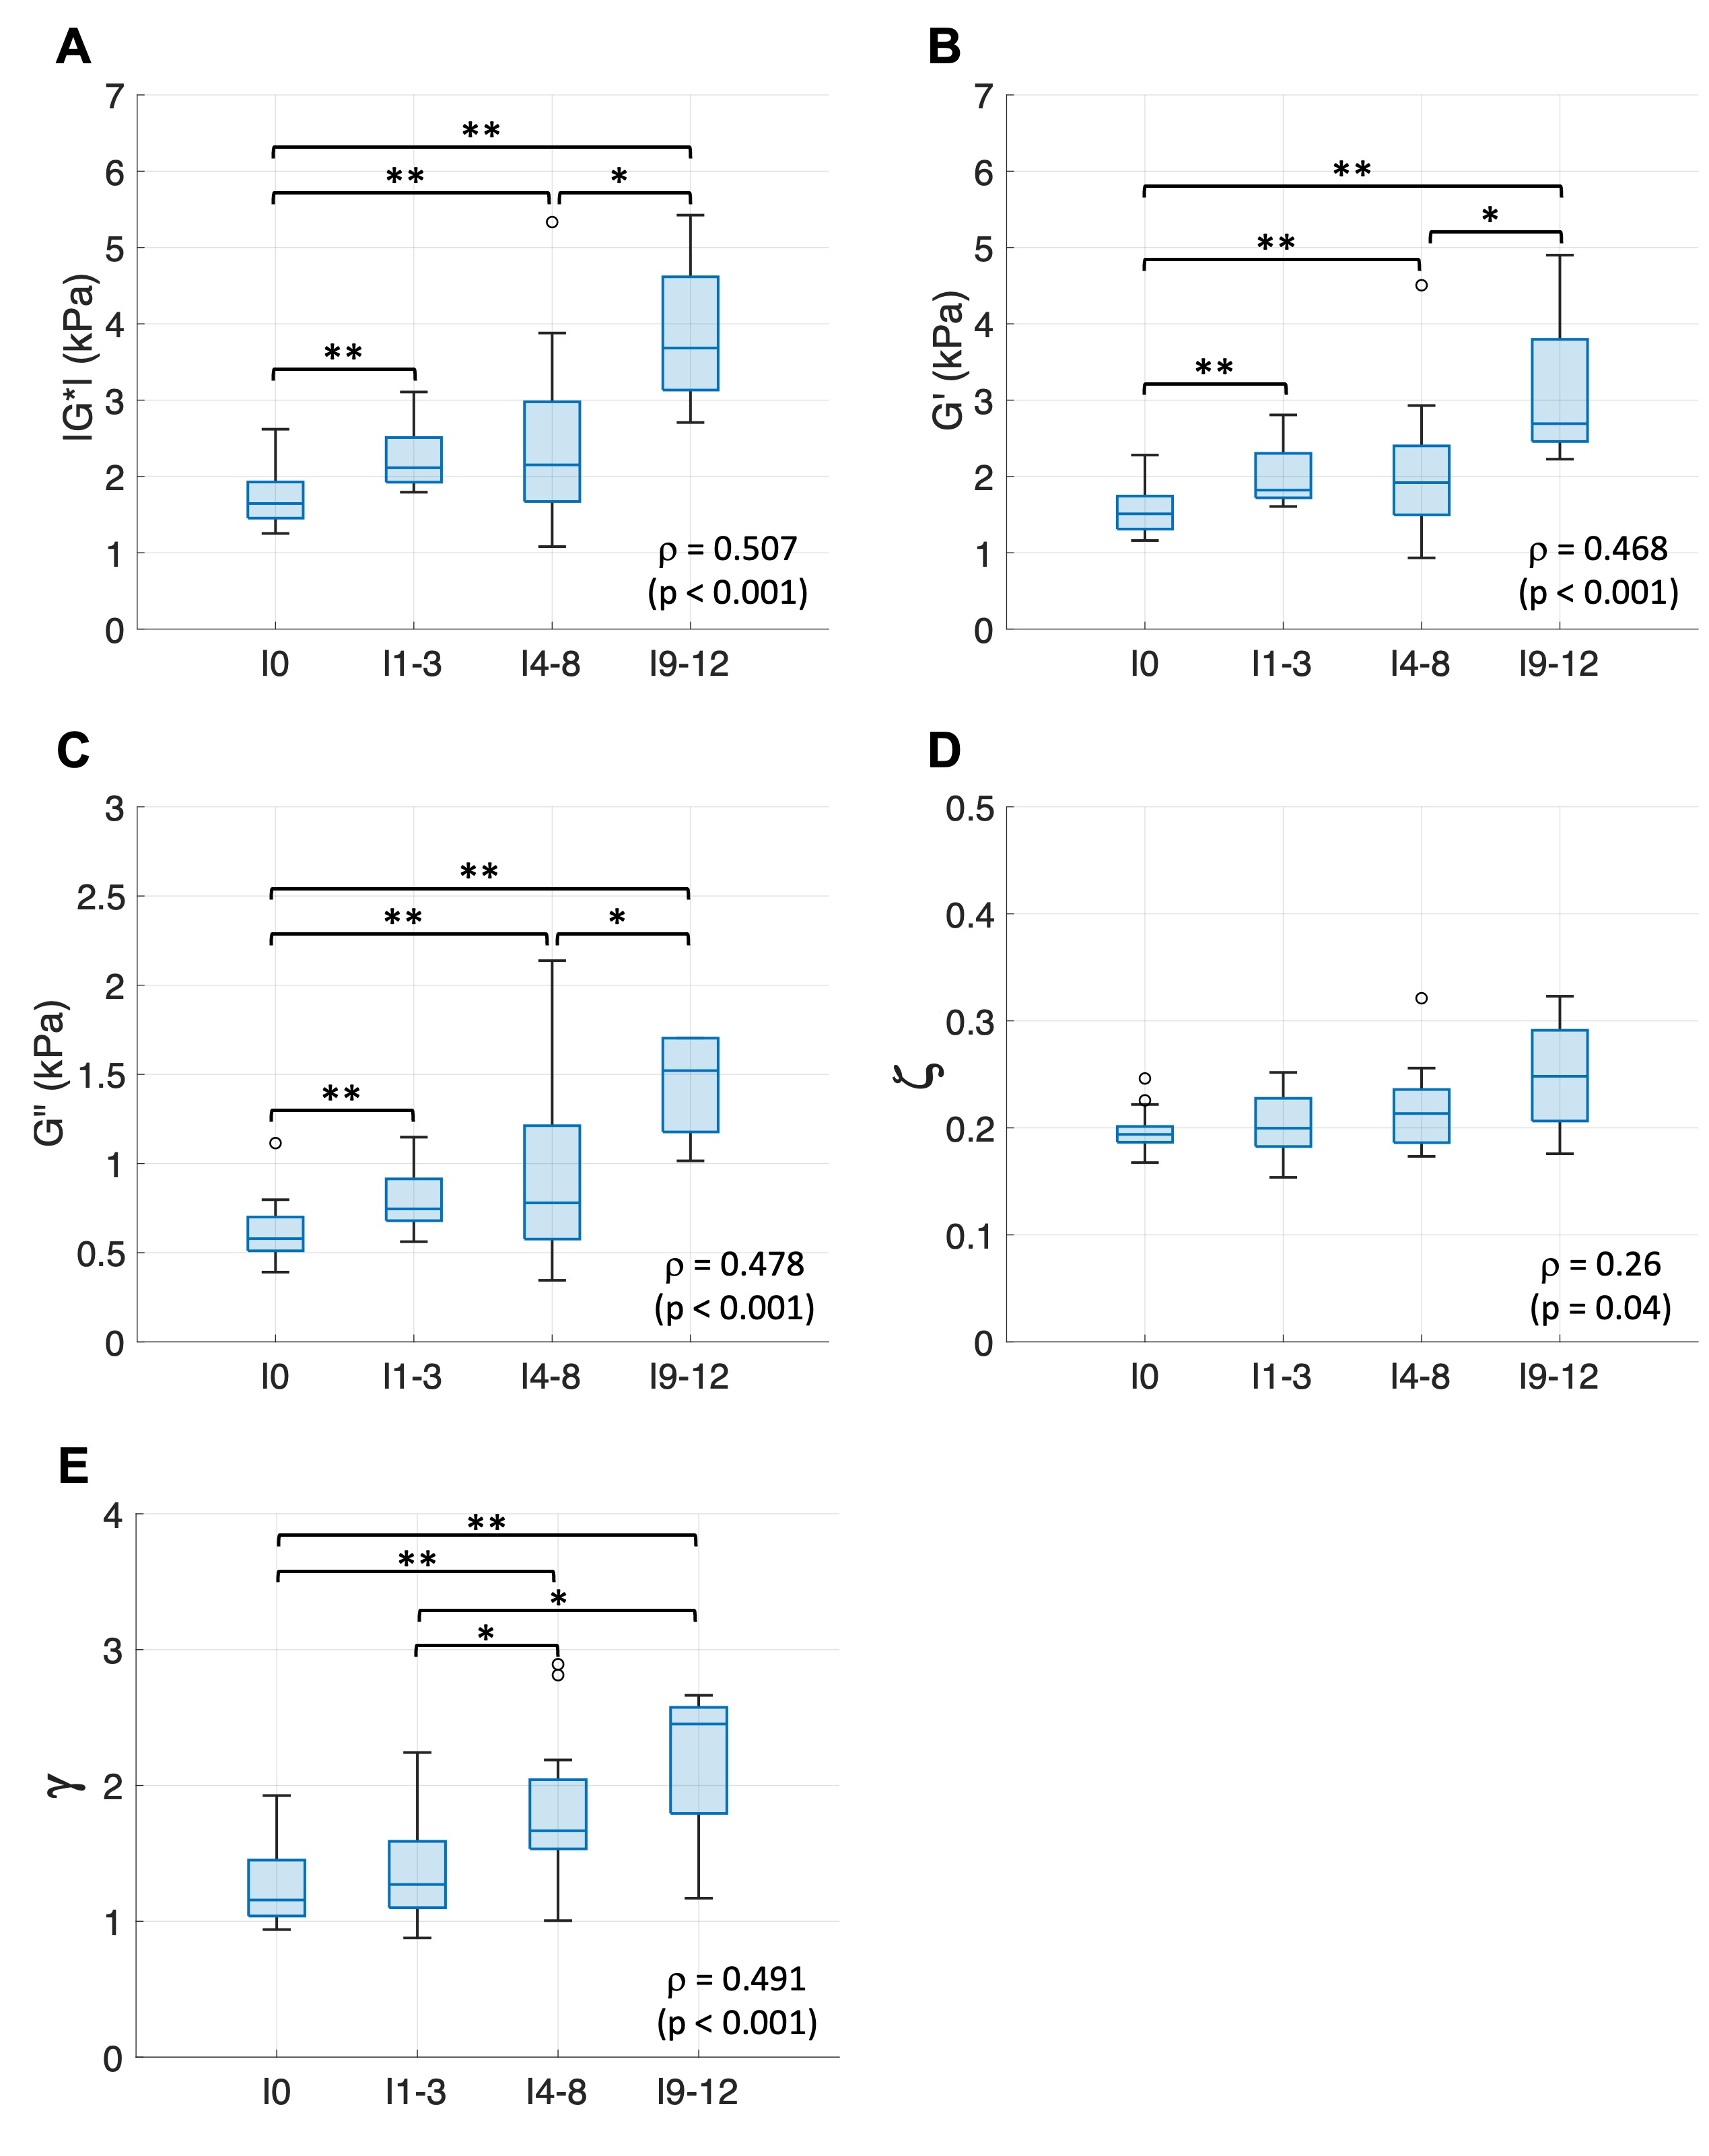
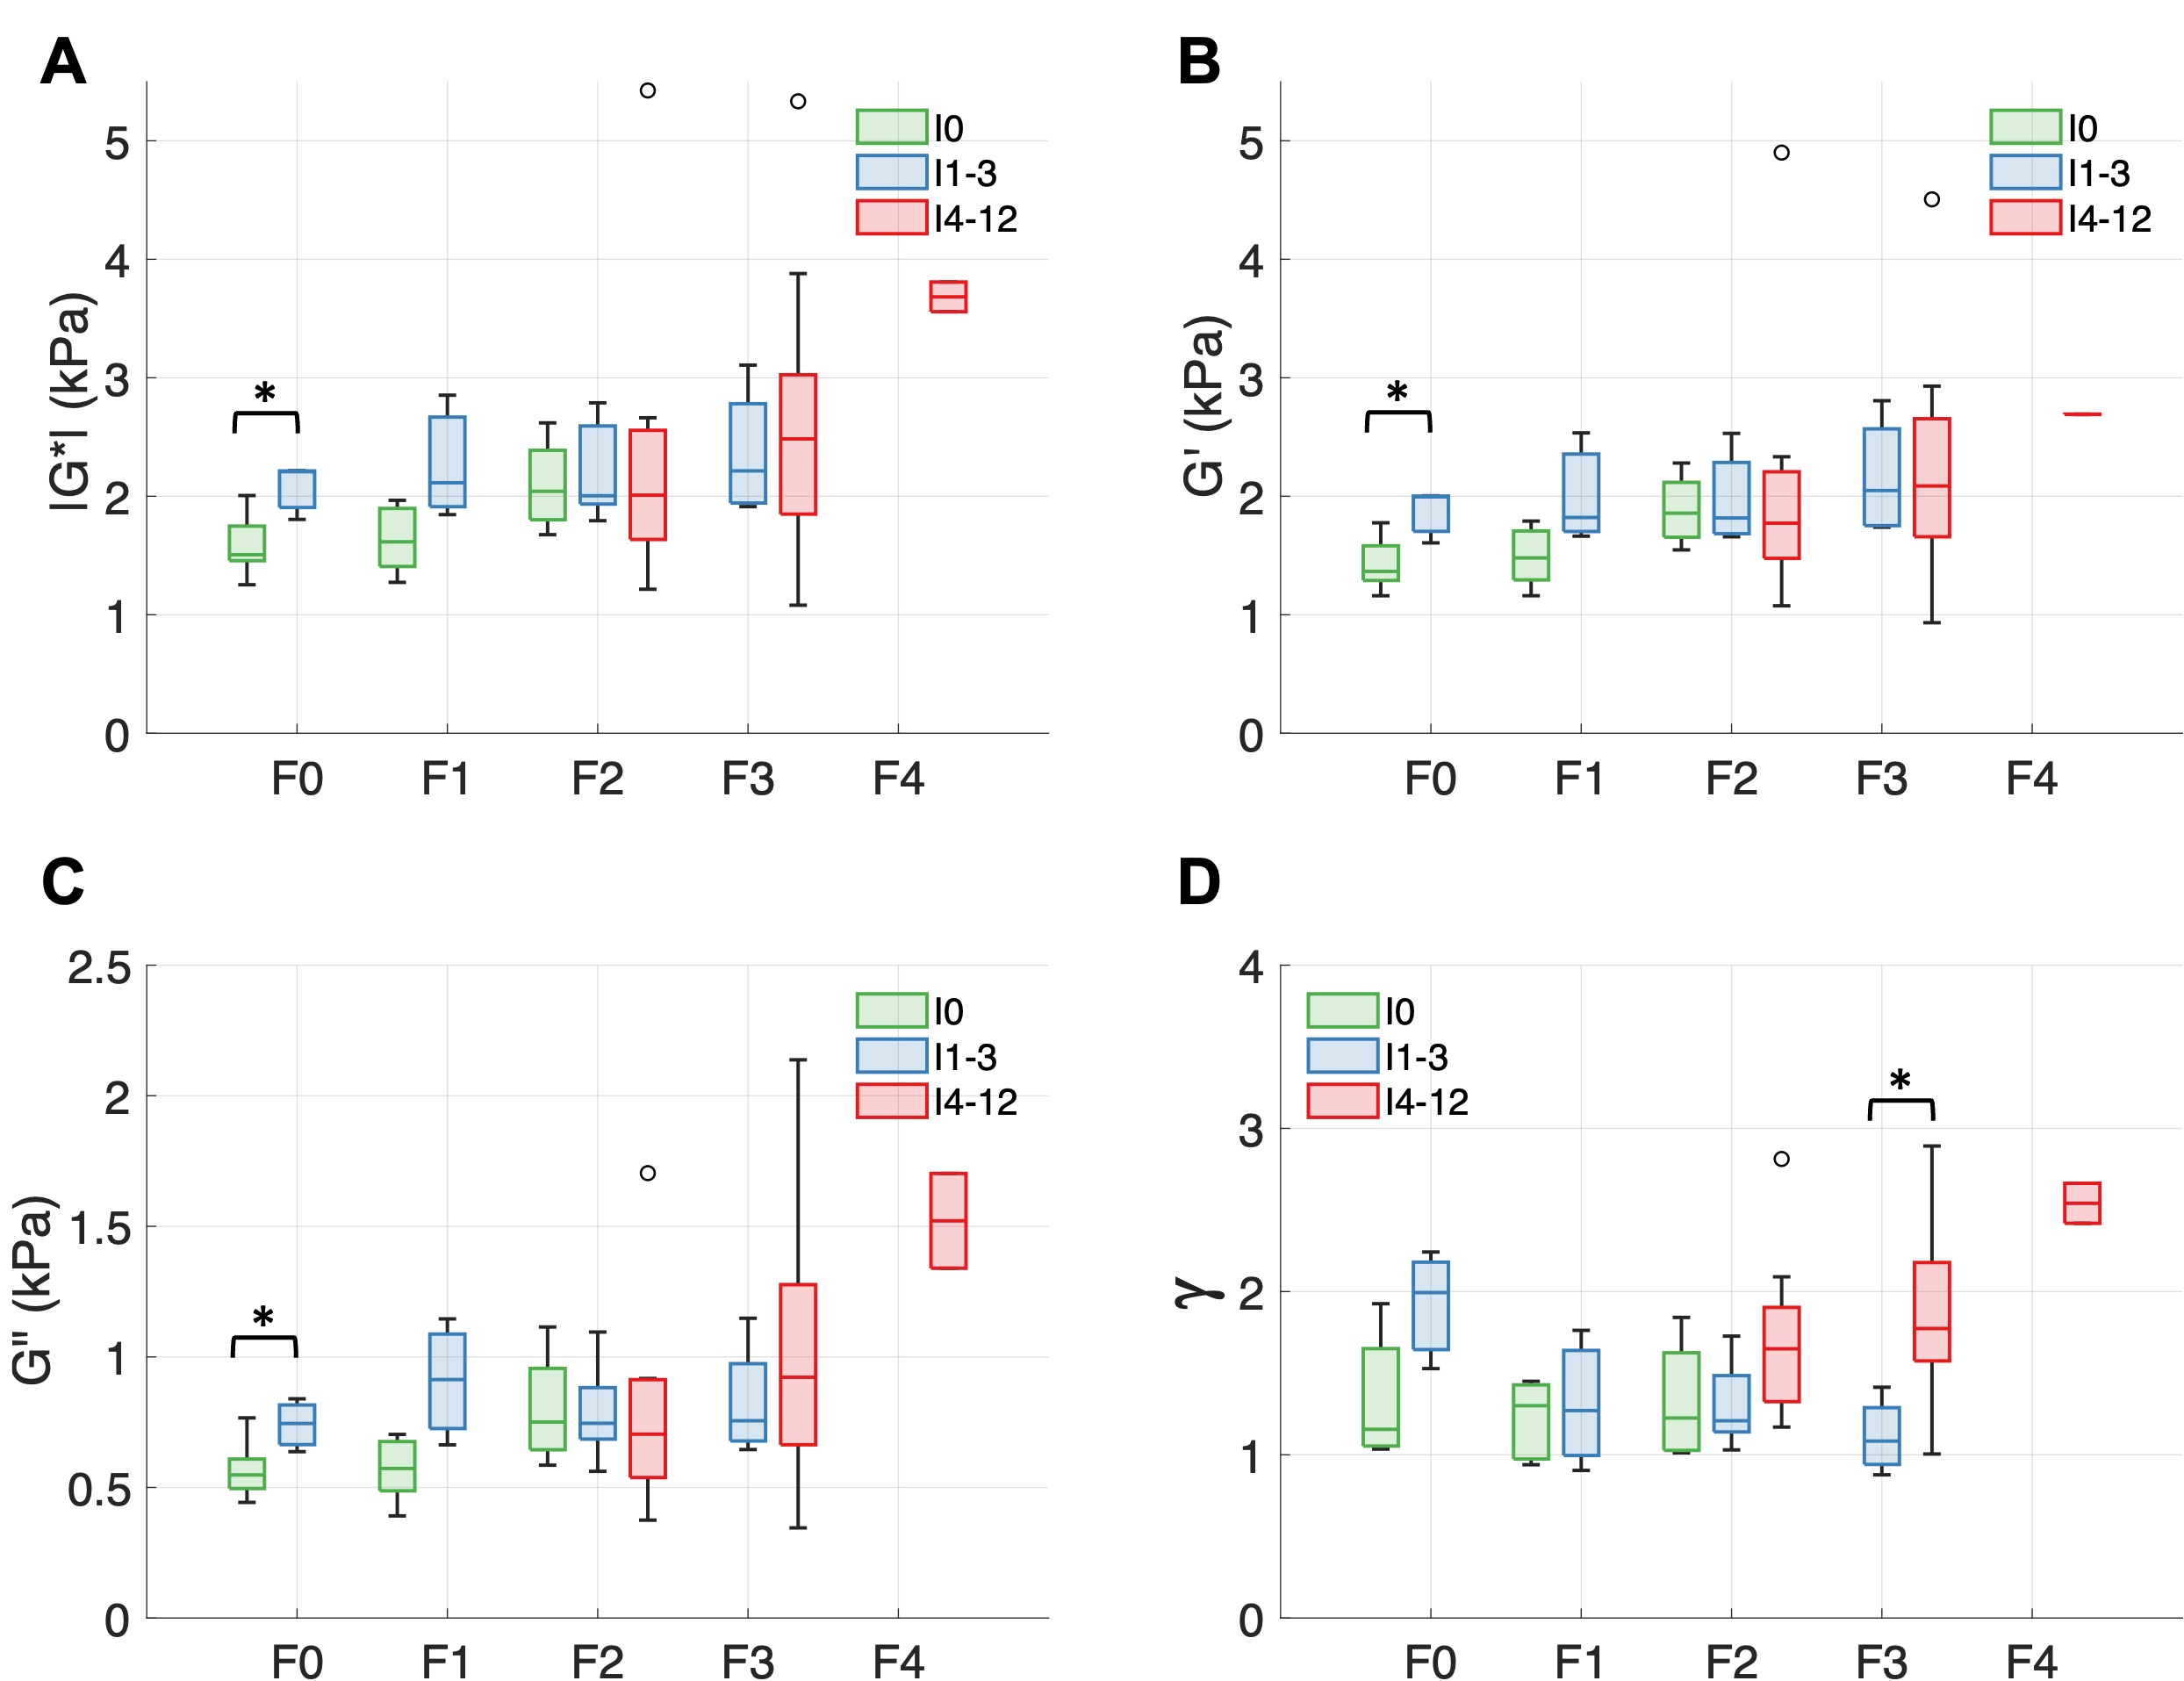
The distribution between inflammation and fibrosis is shown in Figure 2A. The parametric maps of |G*|, G′, G″, ζ and γ for a patient are shown in Figures 2B-F.The relationships between the viscoelastic parameters and inflammation are shown in Figure 3. The moduli |G*|, G′ and G″ increased significantly from no inflammation to I1-3, I4-8, and I9-12 (p < 0.01) and from I4-8 to I9-12 (p < 0.05); γ increased significantly from I0 to I4-8 and I9-12 (p < 0.01) and from I1-3 to I4-8 and I9-12 (p < 0.05); ζ yielded no significant difference with increasing inflammation. Significant correlations were found between all the viscoelastic parameters and inflammation activities, and |G*| (ρ = 0.507, p < 0.001) and ζ (ρ = 0.26, p = 0.04) gave the strongest and weakest correlations, respectively. The associations of |G*|, G′, G″ and γ with inflammation activities were further explored at each fibrosis stage (Figure 4). When no fibrosis was present, the moduli |G*|, G′ and G″ differed significantly between patients without and with mild inflammation (I0 vs. I1-3, p < 0.05). At advanced fibrosis (F3), only γ increased significantly from I1-3 to I4-12 (p < 0.01).
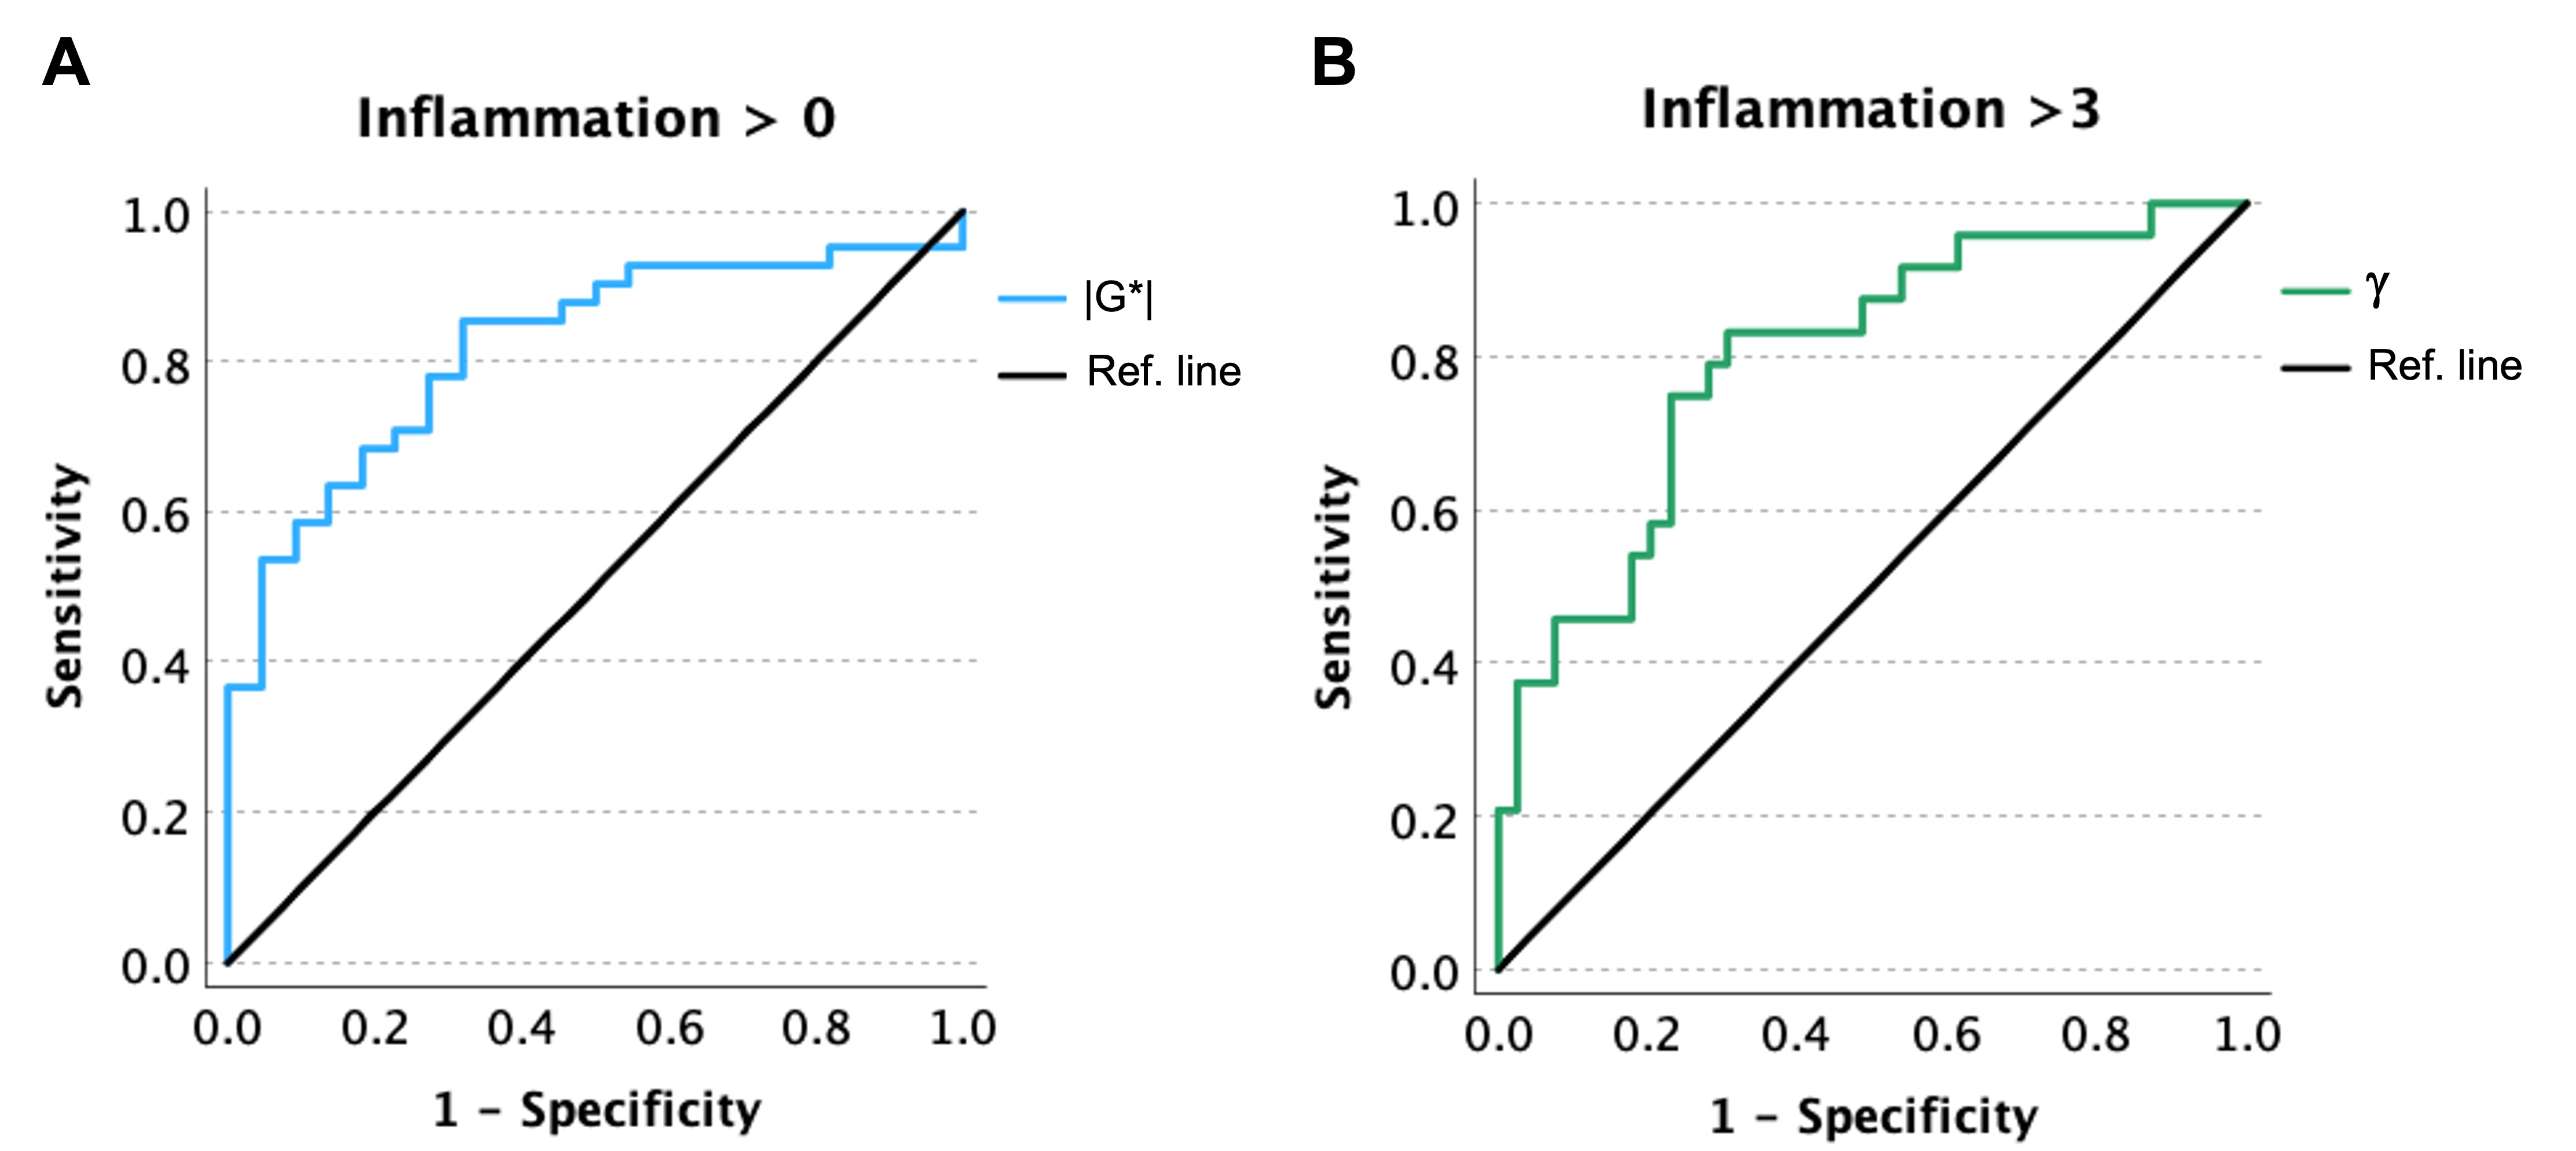
The ROC-analyses were consequently focused on the performance of |G*| for identifying the occurrence of inflammation and γ for the prediction of mild/moderate inflammation (I > 3) (Figure 5). The modulus |G*| yielded a high area under ROC curve (AUC) of 0.82 (0.71 – 0.92), and γ performed well with AUC of 0.80 (0.69-0.91).
Conclusion
The results showed that the moduli |G*|, G′ and G″ and the exponent of power law γ were associated with inflammation. The modulus |G*| performed well in identifying the presence of inflammation, and γ was able to detect early inflammation. In conclusion, with 3D multifrequency MRE, it is possible to assess the hepatic inflammation activity in patients with diffuse liver disease.Acknowledgements
No acknowledgement found.References
1. Zerunian, M., et al., Updates on Quantitative MRI of Diffuse Liver Disease: A Narrative Review. Biomed Res Int, 2022. 2022: p. 1147111.
2. Singh, S., et al., Diagnostic performance of magnetic resonance elastography in staging liver fibrosis: a systematic review and meta-analysis of individual participant data. Clin Gastroenterol Hepatol, 2015. 13(3): p. 440-451 e6.
3. Sinkus, R., et al., Rheological determinants for simultaneous staging of hepatic fibrosis and inflammation in patients with chronic liver disease. NMR Biomed, 2018. 31(10): p. e3956.
4. Shi, Y., et al., MR elastography for the assessment of hepatic fibrosis in patients with chronic hepatitis B infection: does histologic necroinflammation influence the measurement of hepatic stiffness? Radiology, 2014. 273(1): p. 88-98.
5. Garteiser, P., et al., Necro-inflammatory activity grading in chronic viral hepatitis with three-dimensional multifrequency MR elastography. Sci Rep, 2021. 11(1): p. 19386.
6. Qu, Y., et al., Magnetic resonance elastography biomarkers for detection of histologic alterations in nonalcoholic fatty liver disease in the absence of fibrosis. Eur Radiol, 2021. 31(11): p. 8408-8419.
7. Garteiser, P., et al., Rapid acquisition of multifrequency, multislice and multidirectional MR elastography data with a fractionally encoded gradient echo sequence. NMR Biomed, 2013. 26(10): p. 1326-35.
8. Ishak, K., et al., Histological grading and staging of chronic hepatitis. J Hepatol, 1995. 22(6): p. 696-9.
9. Kleiner, D.E., et al., Design and validation of a histological scoring system for nonalcoholic fatty liver disease. Hepatology, 2005. 41(6): p. 1313-21.
10. Sinkus, R., et al., Viscoelastic shear properties of in vivo breast lesions measured by MR elastography. Magn Reson Imaging, 2005. 23(2): p. 159-65.
11. Sinkus, R., et al., MR elastography of breast lesions: understanding the solid/liquid duality can improve the specificity of contrast-enhanced MR mammography. Magn Reson Med, 2007. 58(6): p. 1135-44.
Figures