0845
In-vitro evaluation of the performance of PDFF against classification-based algorithms in calculation of breast density1Nuffield Department of Women's and Reproductive Health, University of Oxford, Oxford, United Kingdom, 2Perspectum Ltd., Oxford, United Kingdom, 3Engineering Science, University of Oxford, Oxford, United Kingdom
Synopsis
Keywords: Breast, Phantoms, Quantitative, fat fraction
Motivation: Operator-independent quantification of breast density with proton density fat fraction (PDFF) may be more accurate than conventional T1-weighted imaging-based methods, which are limited by the partial volume effect (PVE) and require significant user input.
Goal(s): We aimed to assess the accuracy of PDFF against fuzzy clustering (FCM) of T1-weighted images.
Approach: Five phantoms representative of different breast compositions were imaged and the breast density calculated with both methods was compared to the known density.
Results: PDFF demonstrated improved accuracy compared to FCM of T1-weighted images. FCM-derived density was more sensitive to the partial volume effect and dependent on the bias correction algorithm.
Impact: The improved accuracy and comparative robustness of proton density fat fraction (PDFF) suggests it is a more reliable and operator-independent approach to breast density calculation than fuzzy clustering. This is particularly important when assessing longitudinal changes to breast structure.
Introduction
Breast density is a mammographic measure of the relative proportion of fibroglandular to fatty tissue which is a well-established risk factor for breast cancer1. Conventional visual assessment of breast density has high operator variability2 and relies on exposure to ionising radiation. MRI presents a non-ionising and three-dimensional solution for quantification of volumetric breast density.MR-based approaches commonly employ manual delineation or global thresholding of T1-weighted images. Fuzzy c-means (FCM) clustering reduces operator variability3, and the addition of a bias field correction step improves accuracy4. However, significant user input is required and density calculation is limited by the partial volume effect (PVE) as voxels must be classified as each tissue type.
MRI-proton density fat fraction (PDFF) is a quantitative measure of tissue fat concentration which has been proposed for calculation of volumetric breast density5-8. It is not limited by PVE (as it does not require classification of individual voxels), has demonstrated good reproducibility5 and correlates well with clinical categorisations6-8. However, its performance has not yet been compared to traditional classification-based density algorithms.
This study aims to compare the accuracy of PDFF against FCM clustering of T1-weighted images in breast density calculation through the use of specialised phantoms.
Methods
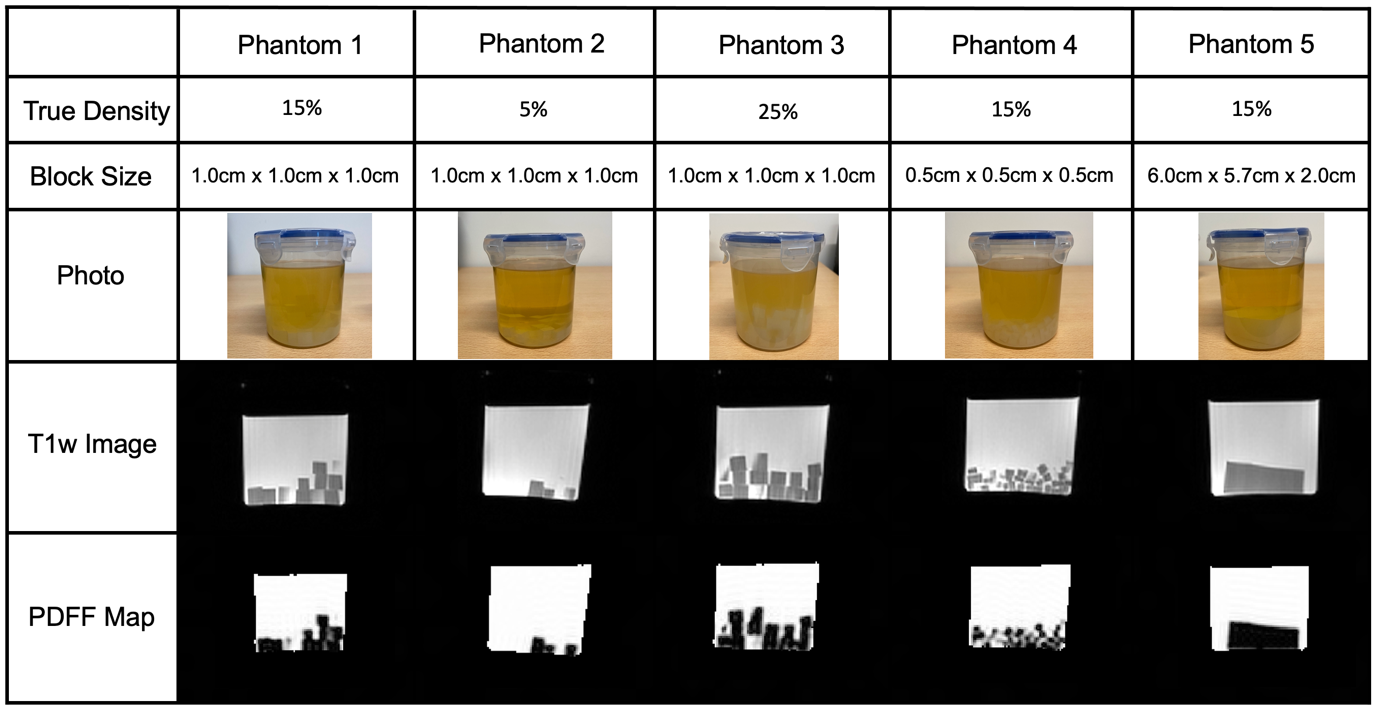
Five phantoms containing different known volumes of agar and peanut oil to simulate a range of breast densities were developed. The agar was cut into different sized blocks to represent different levels of partial voluming5 (Figure 1). Agar was doped with 0.73mM NiCl2 to produce a measured T1 of 1179ms and T2 of 58ms at 1.5T, similar to that of breast fibroglandular tissue (1266ms and 58ms respectively).Phantoms were scanned on a 1.5T GE Signa Voyager scanner with an 8-channel breast coil. A 3D T1w FSPGR Dixon sequence (LAVA Flex) was performed with the following parameters: TE1/ TE2/TR = 2.08ms/4.17ms/6.00ms, flip angle 10°, in-plane resolution 0.78x0.78mm2, slice thickness 1.6mm. Additionally, a 3D 6-echo gradient-echo scan (IDEAL-IQ) was performed with TE1/DTE/TR = 0.92ms/1.36ms/9.84ms, flip angle 6°, in-plane resolution 1.7×1.7mm2 and slice thickness 2.0mm.
Whole phantom masks were generated using an automated morphology-based approach9. Partial voluming was observed around the phantom edge in T1w images, therefore an additional image erosion step was included in generation of T1w phantom masks.
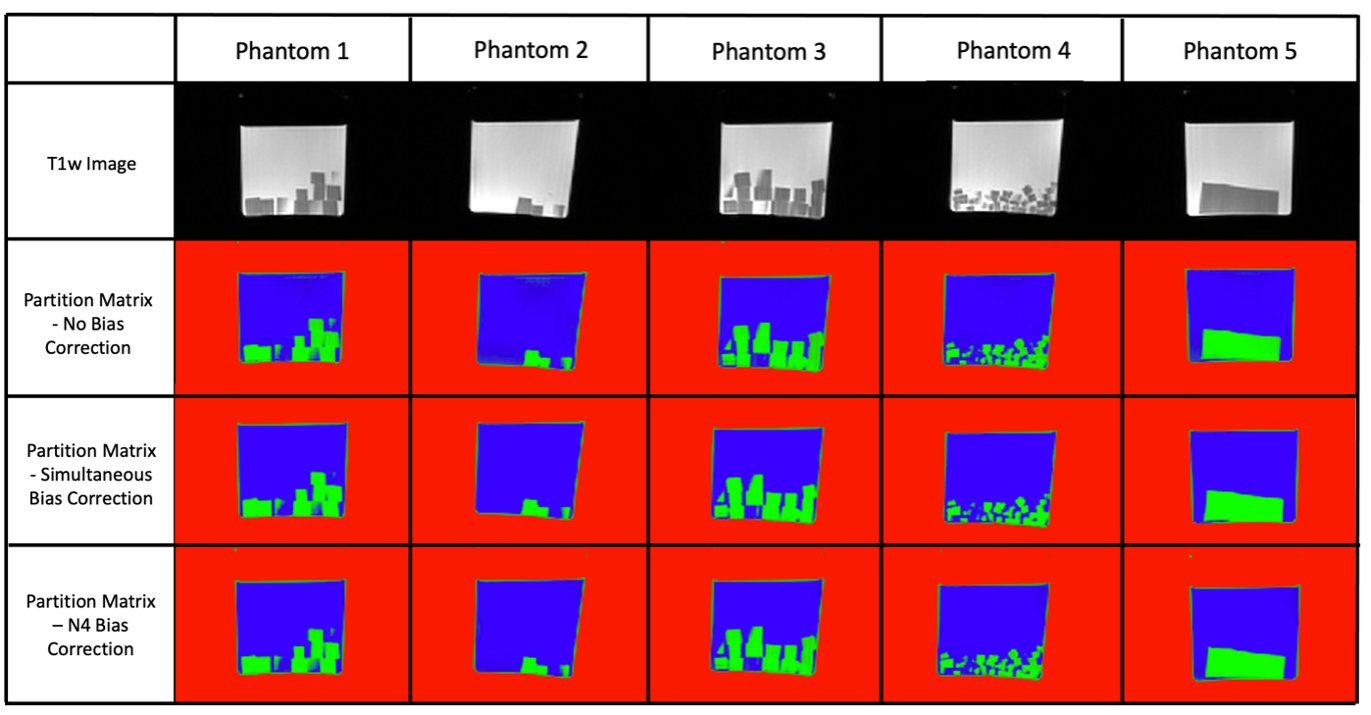
Three FCM algorithms were applied to T1w images (Figure 2). This included FCM without bias field correction (BFC), with simultaneous BFC10,11, and with N4-BFC12. The algorithms were set to identify three clusters in the T1w images (oil, agar, and background) and were initialised using user-placed ROIs. The user classified the component identified by each cluster. Density was calculated as $$$100\%\times\frac{N_{Agar}}{N_{Agar}+N_{Oil}}$$$ where $$$N_{Agar}$$$ and $$$N_{Oil}$$$ are the number of voxels in each cluster within the phantom mask.
PDFF maps were generated using the proprietary algorithm of the vendor (IDEAL-IQ, GE Healthcare), which accounts for T2* decay and a multi-peak fat spectrum. As the PDFFs of agar and oil are 0% and 100% respectively, density was calculated simply as $$$100\%-\frac{\Sigma_{r=1}^{N}PDFF(r)}{N}$$$ where $$$\frac{\Sigma_{r=1}^{N}PDFF(r)}{N}$$$ is the mean PDFF across the phantom mask7.
Results
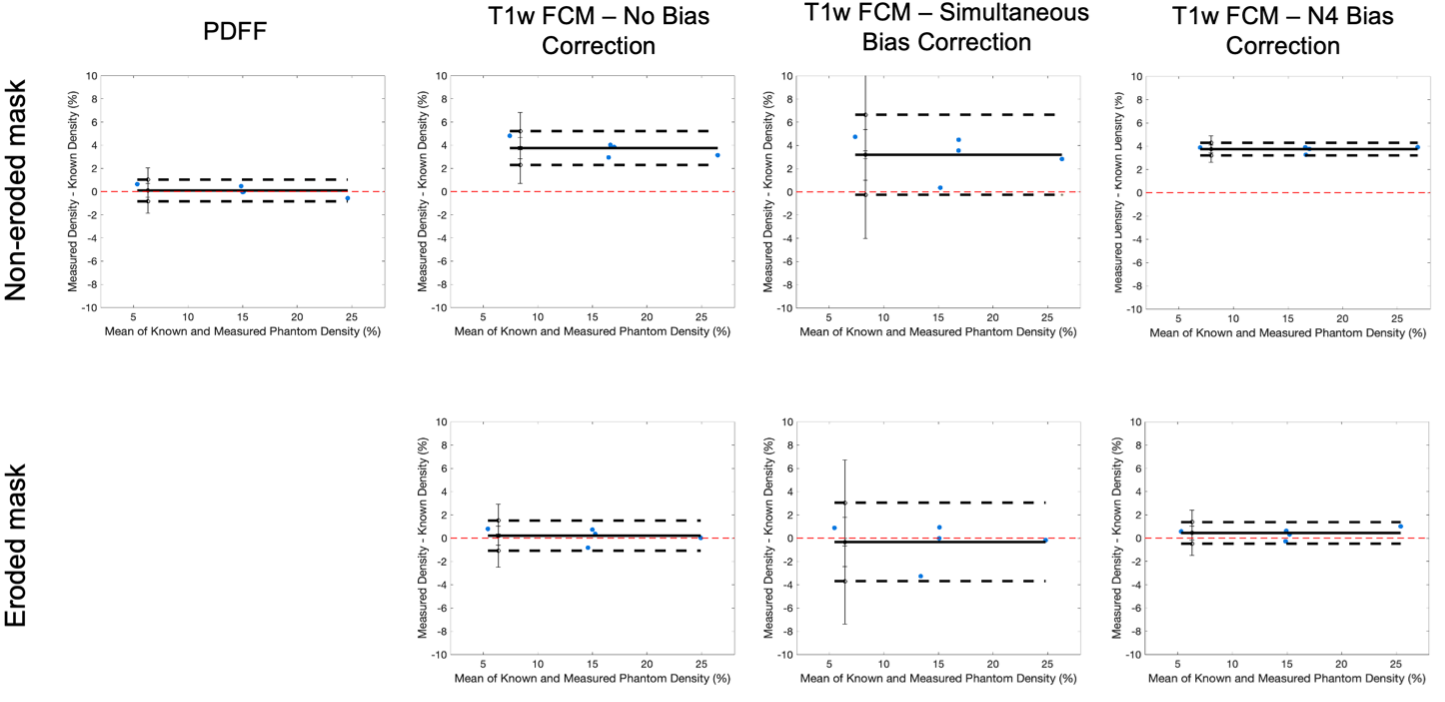
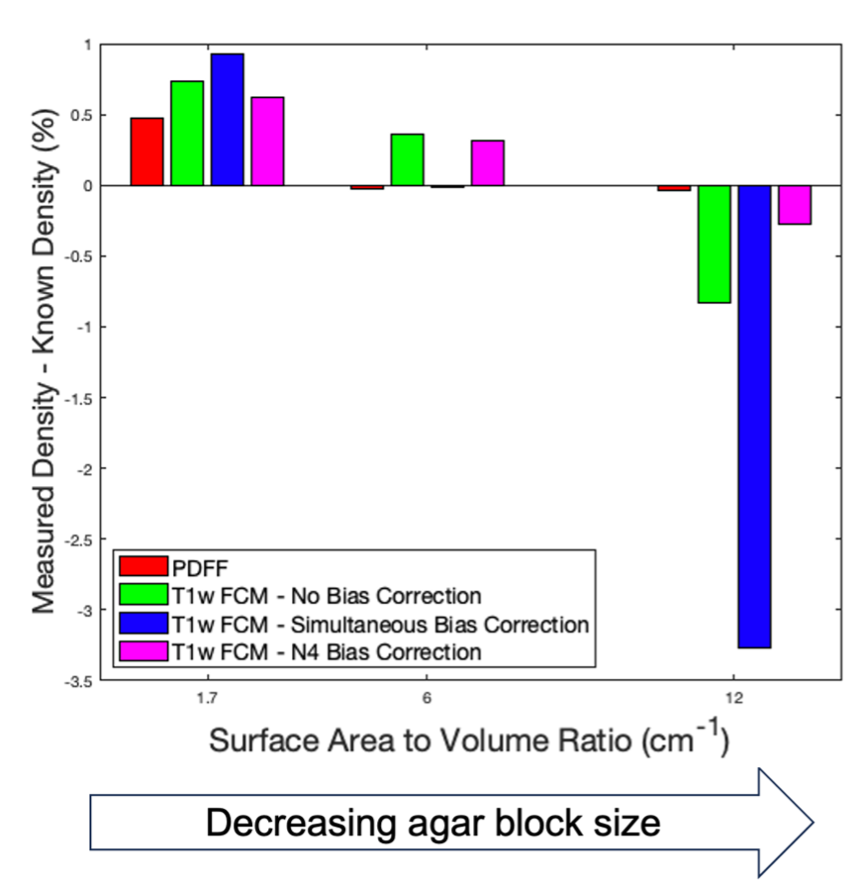
Bland-Altman analysis demonstrated the significant over-estimation of phantom density by T1w FCM algorithms due to partial voluming around the phantom edge (Figure 3). Image erosion of phantom masks to exclude this region improved this bias. PDFF demonstrated excellent accuracy in density measurement (bias = 0.09%, 95% limits of agreement (LoA) = -0.85-1.03%) and showed improved performance compared to FCM without BFC (LoA =-1.08-1.50%) and with simultaneous BFC (LoA = 3.70-3.03%). FCM with N4-BFC showed comparable agreement to PDFF (bias = 0.49%, LoA = -0.48-1.37%).PDFF showed the least dependence of all algorithms upon the surface area to volume ratio of the agar component (Figure 4), which correlates with the level of partial voluming within the phantom.
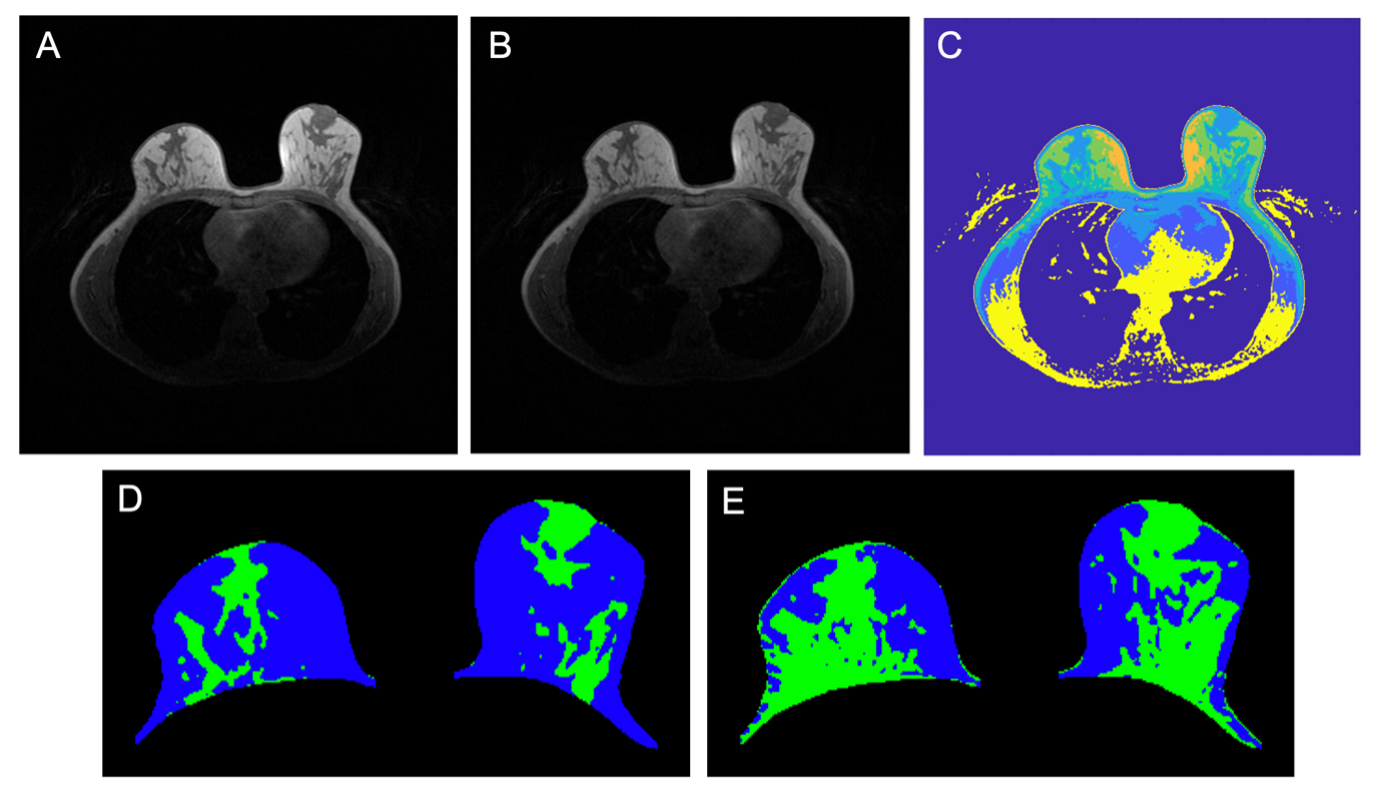
The breast density of one healthy volunteer estimated with FCM using 7 clusters13 varied considerably (13.7%-47.5%) depending on user classification of one voxel cluster (Figure 5). Qualitative assessment suggests that neither segmentation captures the fibroglandular tissue structure completely accurately.
Discussion
Fuzzy c-means clustering of T1-weighted images is highly dependent upon the bias field correction algorithm and relies on users’ judgement for algorithm initialisation and cluster categorisation. In-vitro analysis of specialised breast density phantoms demonstrated the improved accuracy performance of PDFF and its insensitivity to the partial volume effect. The operator-independence of PDFF in calculation of breast density could free radiologists’ time, whilst its insensitivity to structural composition and scan parameters5 suggest it could be a widely-implementable clinical biomarker.Conclusion
PDFF provides a more accurate and robust density calculation than fuzzy clustering of T1-weighted images, with reduced sensitivity to partial volume effects and the bias field.Acknowledgements
The present work was supported by Perspectum Ltd. and the Royal Commission for the Exhibition of 1851. We also gratefully acknowledge the support of Dr. Roberto Salvati for his consultation on MR acquisitions.References
1. McCormack V. A., dos Santos Silva I. Breast density and parenchymal patterns as markers of breast cancer risk: a meta-analysis. Cancer Epidemiol Biomarkers Prev. 2006;15(6):1159–1169.
2. Sprague B. L., Conant E. F., Onega T., et al. Variation in mammographic breast density assessments among radiologists in clinical practice: a multicenter observational study. Annals of internal medicine. 2016;165(7):457–464.
3. Kilfa, C. et al. Quantification of Breast Tissue Index from MR data using Fuzzy Clustering. IEEE Engineering in Medicine and Biology Soc. 2004;1:1667-1670.
4. Ding, H. et al. Breast density quantification using magnetic resonance imaging (MRI) with bias field correction: A postmortem study. Med. Phys. 2013;40(12):122305.
5. Henze Bancroft L. C., Strigel R. M., Macdonald E.B., et al. Proton density water fraction as a reproducible MR-based measurement of breast density. Magn. Reson. Med. 2022;87:1742-1757
6. Borde T., Wu M., Ruscke S., et al. Assessing breast density using the chemical-shift encoding-based proton density fat fraction in 3T MRI. Eur. Radiol. 2023;33:3810-3818
7. Gordon I., Ralli G., Herlihy A., et al. Quantitative calculation of breast density with proton density fat fraction enables distinction between latest subjective BI-RADS categories. Proc. Intl. Soc. Mag. Reson. Med. 2023;31:2732.
8. Gordon I., Ralli G., Herlihy A., et al. Assessment of breast density with hybrid-based proton density fat fraction calculation enables distinction between BI-RADS categories. Postgraduate Brit. Irish. Chap. Intl. Soc. Mag. Reson. Med. 2023
9. Gordon, I., Ralli, G., Fernandes, C. et al. Proton density fat fraction of breast adipose tissue: comparison of the effect of fat spectra and initial evaluation as a biomarker. Medical Image Understanding and Analysis. MIUA 2022. Lecture Notes in Computer Science. 2022;13413:28-45.
10. Ahmed, M. N., Yamany, S.M., Mohamed, N., et al. A modified fuzzy c-means algorithm for bias field estimation and segmentation of MRI data. IEEE Transacs. Med. Im. 2002;21(3):193-199.
11. Kroon, D. J. Bias Field Corrected Fuzzy C-Means(https://www.mathworks.com/matlabcentral/fileexchange/25712-bias-field-corrected-fuzzy-c-means), MATLAB Central File Exchange. Retrieved .
12. Tustison, N., Gee, J. N4ITK: Nick’s N4 ITK Implementation for MRI Bias Field Correction. The Insight Journal. 2009 January-June.
13. Clendenen, T. V., Zeleniuch-Jacquotte, A., Moy, L., et al. Comparison of 3-point Dixon Imaging and Fuzzy C-means Clustering Methods for Breast Density Measurement. Mag. Res. Im. 2013;38:474-481.
Figures