0844
Multiparametric MRI to study changes across the Surgical Journey in Bariatric Patients with Type 2 diabetes or Prediabetes.1Sir Peter Mansfield Imaging Centre,Physics, University of Nottingham, Nottingham, United Kingdom, 2Division of Medical Sciences and Graduate Entry Medicine, University of Nottingham, Nottingham, United Kingdom, 3Bariatric Metabolic Institute, University Hospitals of Derby and Burton NHS foundation Trust, Derby, United Kingdom, 4Intelligent Modelling and Analysis, University of Nottingham, Nottingham, United Kingdom, 5National Institute for Health Research Biomedical Research Centre, Queen's Medical Centre and University of Nottingham, Nottingham, United Kingdom, 6David Green Human Physiology Unit, University of Nottingham, Nottingham, United Kingdom, 7Department of Cardiovascular Sciences, University of Leicester and NIHR Leicester Biomedical Research Centre, Leicester, United Kingdom
Synopsis
Keywords: Liver, Diabetes, Bariatric, Pre-Diabetes, Liver, Pancreas, Spleen
Motivation: Bariatric surgery is evaluated by weight loss and diabetes remission, but the mechanism of the latter is unclear.
Goal(s): Use MRI to quantify changes in liver, pancreas and subcutaneous adipose tissue (SAT).
Approach: Multiparametric MRI of fat fraction (FF), T2*, volume, T1 and T2 at four timepoints before and after bariatric surgery.
Results: Significant reduction in liver FF from baseline to 6-weeks, and between post-VLCD and 6-weeks, and liver volume from baseline to subsequent time points. Compared to baseline a significant increase in liver T2* at 6-weeks, reduction in liver T1 at 6-weeks and 6-months, and decrease in SAT at 6-months
Impact: Multiparametric MRI assessment of changes in liver and pancreas fat, volume and T1, T2* and T2 relaxometry, as well as subcutaneous volume associated with bariatric surgery may serve as markers for longitudinal and cross-sectional assessment of patients.
Introduction
Obesity rates are climbing worldwide, leading to a rise in related diseases such as type-2 diabetes mellitus (T2D). Bariatric surgery has emerged as an effective strategy to induce a more sustained weight loss and diabetes remission versus exercise and dietary measures. Prior to surgery, all bariatric patients undergo a 2-week Very Low-Calorie Diet (VLCD) consuming ~800kcal a day to shrink the liver, which has been independently shown to induce diabetes remission (1,2). In the UK, either Roux-en-Y gastric bypass (RYGB, in which food bypasses the stomach and arrives in a pouch made from the small intestine) or sleeve gastrectomy (SG, where the stomach volume is reduced by 50%) bariatric surgery is performed. Whether diabetes remission occurs due to VLCD per se or due to additional changes in insulin-sensitive tissues after bariatric surgery is unclear. Here, bariatric patients had a multi-parametric 1H MRI protocol collected at four time points: baseline (before treatment), after a VLCD, 6-weeks post-surgery and 6-months post-surgery.Methods
15 participants (BMI≥35kg/m3, diagnosis of T2D or pre-diabetes, no history of liver cirrhosis) registered for bariatric surgery were recruited to have MRI scans at baseline, end of VLCD, 6-weeks post-surgery and 6-months post-surgery. The timeline of study collection points is shown in Figure 1. Of these participants, there was a 50/50 split for RYGB and SG surgeries. To date, 9 participants have had scans following surgery, with 5 having completed all 4 time points.MR acquisition: Participants arrived at 08:30 am fasted (min 8 hours) for a 3-hour mixed meal challenge, followed by a 1-hour multiparametric MRI scan on a Phillips 3T Ingenia. Scans had a large FOV (450 x 450 mm) and included a 6-point abdominal mDIXON to assess fat fraction and T2*, and MOLLI T1 (using a physiological simulator for fixed inversion times) centred on the pancreas and including liver and spleen. In addition, abdominal axial GraSE T2 mapping, fat-suppressed SE-EPI T1 mapping, B0 and B1 maps. Kidney T2* and MOLLI T1 scans were acquired.
Analysis: Masks of the liver, spleen and subcutaneous adipose tissue (SAT), shown in Figure 1, were created from the mDIXON using automatic segmentation performed using nnU-NET (3) trained on 40 adult participant scans. These masks were then used to compute values of liver and spleen volume, T2* and Fat Fraction (FF), and SAT volume. Liver and spleen masks were re-sampled (FSL, fMRIB) and applied to the liver T2 and T1 MOLLI maps. Pancreas ROIs were manually drawn, and FF maps were interrogated.
Results
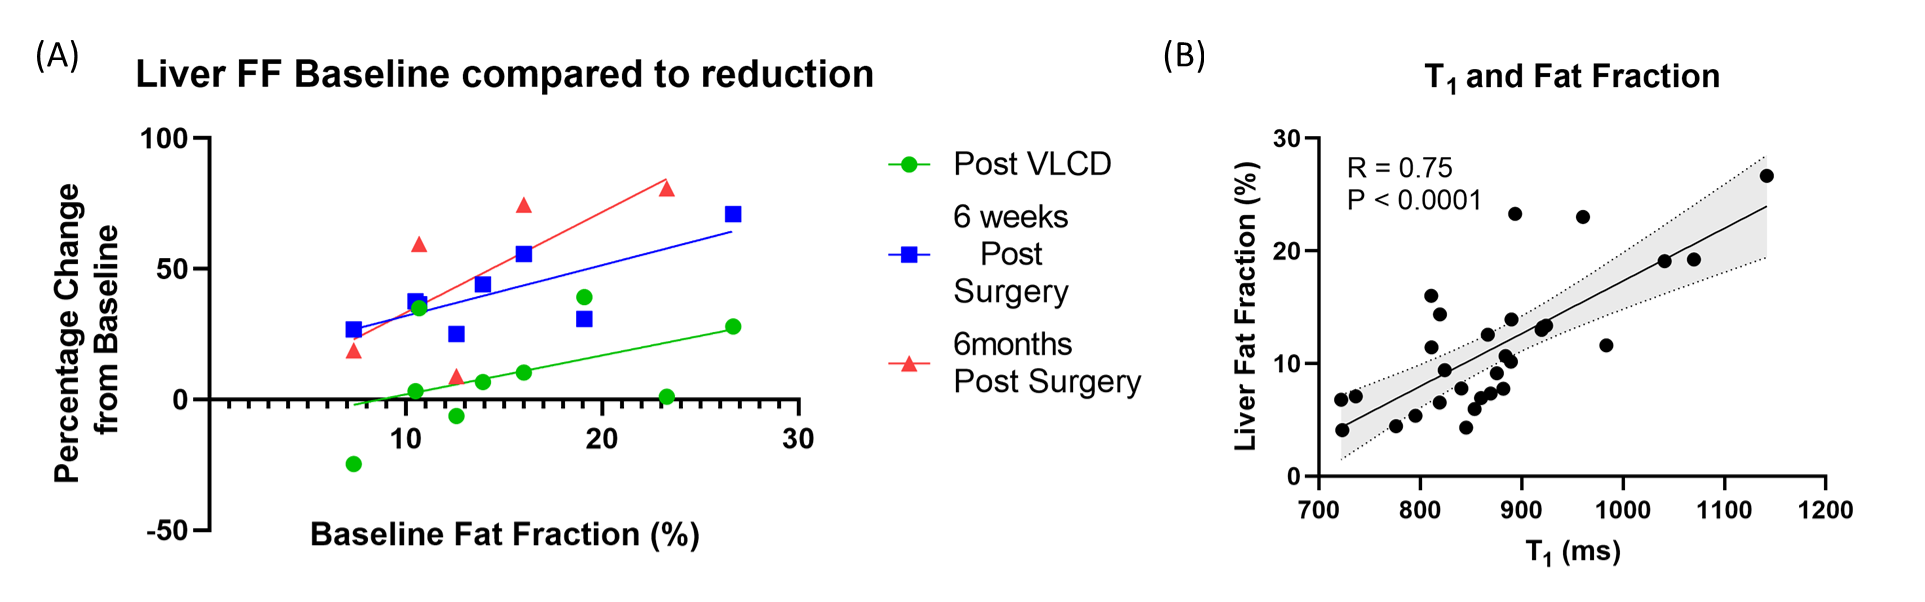
The changes in the patients’ characteristics of BMI are shown in Figure 1. Figure 2 shows the absolute MRI measures for each participant at each of the four timepoints. At baseline, all participants had a fatty liver (> 6.4% FF (4)), and 7 of 9 had a fatty pancreas (> 6.2% FF (5)) (Fig. 3&4). There was a significant reduction of liver FF from baseline to 6-weeks, and from the end of VLCD to 6-weeks. The percentage change in liver FF correlated with the baseline liver FF (Fig. 5). Liver volume was significantly different from baseline at all subsequent time points. Liver T2* significantly increased at 6-weeks compared to baseline, and liver MOLLI T1 reduced at 6-weeks and 6-months compared to baseline (Fig.2). SAT volume significantly reduced at 6-months compared to baseline. No significant reduction was observed in pancreatic FF or any spleen measures (Fig.4).Discussion
This study's preliminary findings show liver changes associated with bariatric surgery. The reduction in liver MOLLI T1 is likely to be an effect of the reduction in FF (6). In future, we will also study the effect of bariatric surgery on pancreas T2*, T2 and T1, as well as kidney T2* and MOLLI T1 kidney measures, and compare differences between the two types of surgery. MRI measures will be related to blood measures of glucose, GLP-1, GIP, Glucagon, C-peptide, Ghrelin, insulin and bile acids.Conclusion
MRI can detect the quantitative decrease of fatty infiltration within the liver after bariatric surgery and could be a valuable tool to monitor NAFLD/ NASH postoperatively.Acknowledgements
The study was supported by funding from the National Institute for Health Research Biomedical Research Centre, with PhD funding to AS from the MRC DTP and to SLB from the EPSRC.
References
1.Juray S, Axen K V, Trasino SE, Martínez-Hervás S, González-Navarro H. Remission of Type 2 Diabetes with Very Low-Calorie Diets—A Narrative Review. Nutrients 2021, Vol 13, Page 2086 [Internet]. 2021 Jun 18 [cited 2023 Nov 7];13(6):2086. Available from: https://www.mdpi.com/2072-6643/13/6/2086/htm
2. Steven S, Hollingsworth KG, Al-Mrabeh A, Avery L, Aribisala B, Caslake M, et al. Very Low-Calorie Diet and 6-months of Weight Stability in Type 2 Diabetes: Pathophysiological Changes in Responders and Nonresponders. Diabetes Care [Internet]. 2016 May 1 [cited 2023 Nov 7];39(5):808–15. Available from: https://dx.doi.org/10.2337/dc15-1942
3. Isensee F, Jaeger PF, Kohl SAA, Petersen J, Maier-Hein KH. nnU-Net: a self-configuring method for deep learning-based biomedical image segmentation. Nature Methods 2020 18:2 [Internet]. 2020 Dec 7 [cited 2023 Oct 26];18(2):203–11. Available from: https://www.nature.com/articles/s41592-020-01008-z
4. Tang A, Tan J, Sun M, Hamilton G, Bydder M, Wolfson T, et al. Nonalcoholic fatty liver disease: MR imaging of liver proton density fat fraction to assess hepatic steatosis. Radiology [Internet]. 2013 May 1 [cited 2023 Nov 7];267(2):422–31. Available from: https://pubs.rsna.org/doi/10.1148/radiol.12120896
5. Singh RG, Yoon HD, Wu LM, Lu J, Plank LD, Petrov MS. Ectopic fat accumulation in the pancreas and its clinical relevance: A systematic review, meta-analysis, and meta-regression. Metabolism. 2017 Apr 1;69:1–13.
6. Mozes FE, Tunnicliffe EM, Pavlides M, Robson MD. Influence of fat on liver T1 measurements using modified Look–Locker inversion recovery (MOLLI) methods at 3T. Journal of Magnetic Resonance Imaging [Internet]. 2016 Jul 1 [cited 2023 Nov 7];44(1):105–11. Available from: https://onlinelibrary.wiley.com/doi/full/10.1002/jmri.25146
Figures
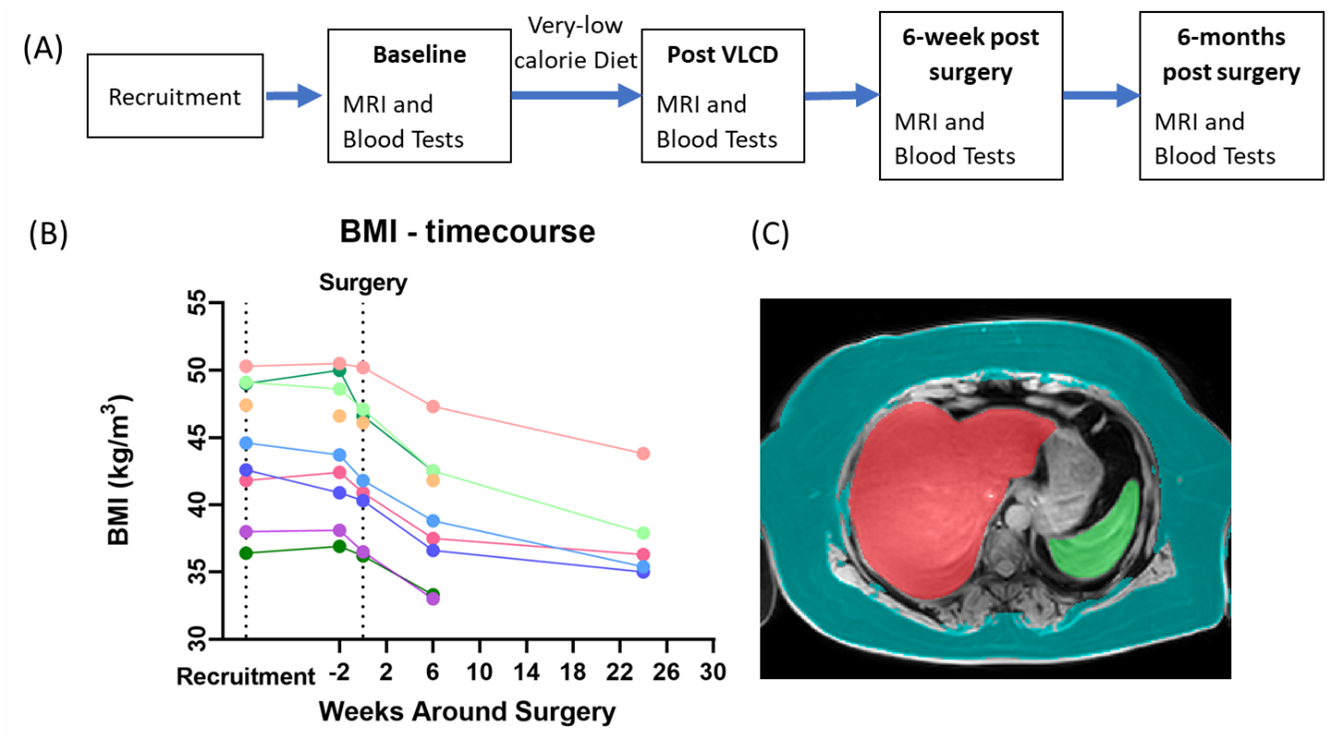
Figure 1: (A) Timeline of study collection points and (B) participant BMI measures. (C) Example image and organ masks generated using the nnU-NET model (SAT mask shown in teal, liver mask in red, and spleen mask in green).
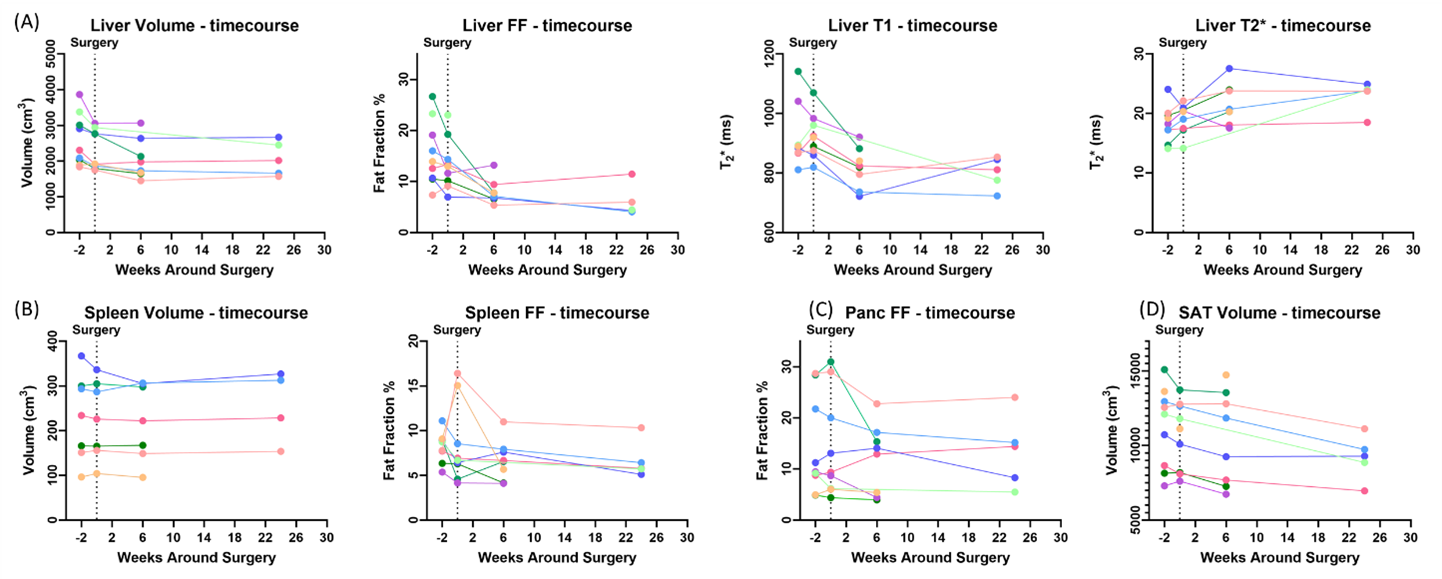
Figure 2: Absolute MRI measures for each participant, showing (A) for the liver measures of volume, fat fraction, MOLLI T1 and T2*, (B) spleen volume and fat fraction, (C) pancreas fat fraction and (D) SAT volume.
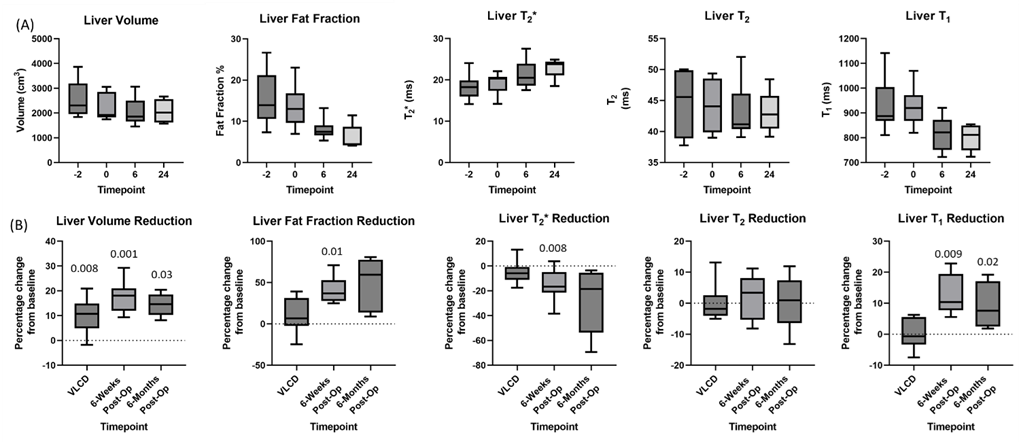
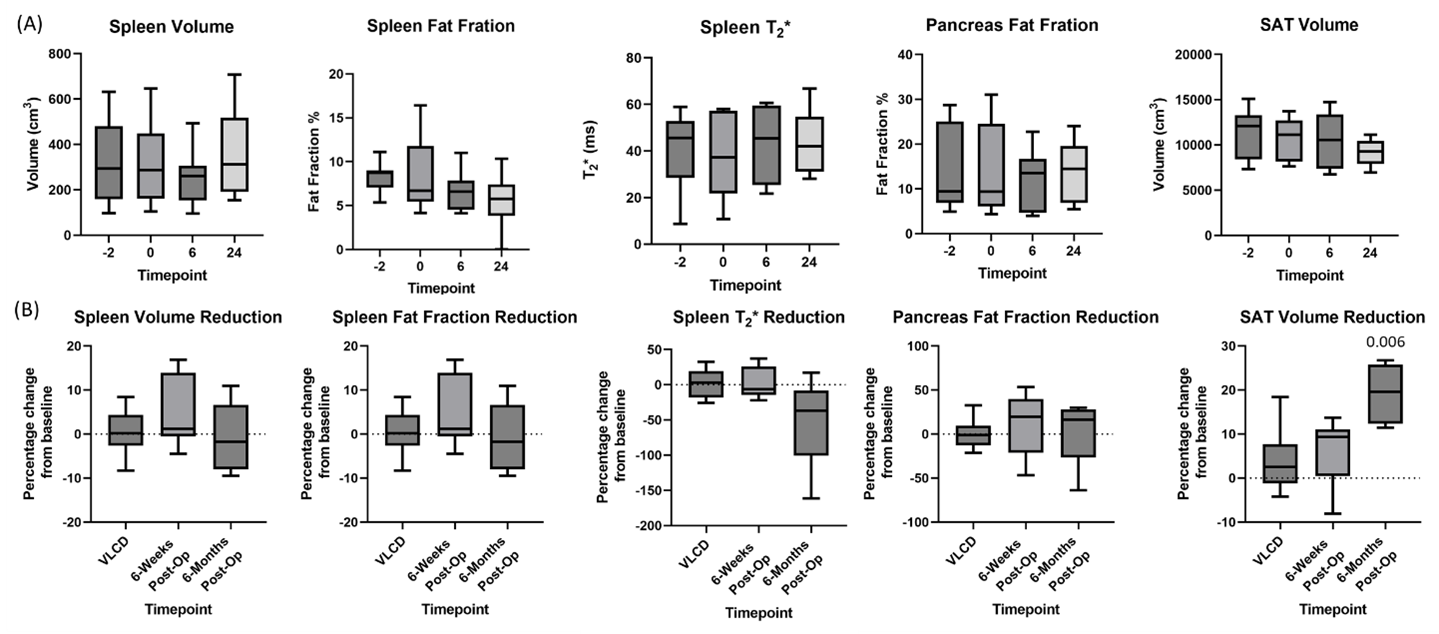
Figure 4: Box plots of (A) the absolute MRI measures of spleen volume, fat fraction and T2*, and pancreas fat fraction and SAT, and (B) the percentage reduction from baseline in these measures. Significant p values can be seen above their respective box plots.