0842
Enhanced Non-invasive Characterisation of Renal Tumour Microstructure with VERDICT-MRI1Centre for Medical Image Computing, University College London, London, United Kingdom, 2Centre for Medical Imaging, University College London, London, United Kingdom, 3Department of Surgical Biotechnology, University College London, London, United Kingdom
Synopsis
Keywords: Kidney, Kidney, Microstructure Imaging
Motivation: Diffusion-weighted (DW)-MRI may characterise renal cell carcinoma (RCC) by reflecting cellularity, but results using the apparent diffusion coefficient (ADC) model are inconclusive.
Goal(s): Use advanced modelling with VERDICT-MRI to characterise renal tissue in two different grades and subtypes of RCC, and compare performance to ADC.
Approach: Fit VERDICT and ADC models to DW-MRI data from two patients and compare performance in terms of accuracy of fitted signal and parameter estimates.
Results: The VERDICT model captures the DW-MRI signal more accurately than ADC. It discriminates between tissue types, and shows high cellularity and low vasculature in the grade 3 tumour, agreeing with independent CT.
Impact: We show that VERDICT-MRI can be used to accurately characterise tumour and benign tissue microstructure in two patients with RCC of different grade and subtype, improving performance over ADC and reflecting histological tissue properties such as cellularity and vasculature.
Introduction
Renal cell carcinoma (RCC) arises from renal epithelium, and accounts for >90% of kidney cancers1. MRI is routinely used for RCC diagnosis2, and diffusion-weighted MRI (DW-MRI) can provide additional sensitivity by probing tissue microstructure3. Most DW-MRI RCC studies use the apparent diffusion coefficient (ADC), which has been shown to be lower in tumour tissue than benign4,5, but cannot differentiate between cancer subtypes, producing contradictory results6-9.The Vascular, Extracellular and Restricted DIffusion for Cytometry in Tumours (VERDICT)-MRI framework, consisting of a specific DW-MRI acquisition and a biophysical model for tumour microstructure10, has been used for prostate11-13, brain14 and rectal15 tumours, showing enhanced tumour characterisation over ADC16,17. We demonstrate the first application of VERDICT-MRI in renal cancer, in two patients with grade 2 and 3 RCC. Results show VERDICT predicts the renal DW-MRI signal more accurately than ADC, showing promise for improved tissue type differentiation by reflecting histological features.
Methods
Patient CohortPatients with renal tumours were identified at the Royal Free Hospital. Patient 1: age 77, grade 2 clear-cell RCC (ccRCC) confirmed post-surgery. Patient 2: age 71, grade 3 RCC of unspecified non-ccRCC subtype confirmed from previous biopsy.
Data Acquisition
VERDICT-MRI was performed on a 3T MRI system (Ingenia; Philips, Best, the Netherlands), using a pulsed-gradient spin-echo sequence with echo-planar imaging readout in the coronal plane. The imaging parameters were: repetition time, 2000–3349ms; echo time (TE), 54–87ms field of view, 220x200mm; voxel size, 1.25x1.25x5mm; no interslice gap; acquisition matrix, 176x176. The VERDICT acquisition protocol for kidney is:
b=[70,90,150,500,1000,1500,2000,2200,2500]s/mm2;
d=[4.8,4.8,4.8,12.0,12.0,26.3,16.8,16.8,21.4]ms;
D=[27.0,27.0,27.0,34.0,34.0,47.0,37.5,37.5,43.5]ms.
We acquired a separate b=0 image for each TE. Acquisition time was ~40 min.
Pre-processing
The pre-processing pipeline12,13 included denoising using MP-PCA18 (MrTrix319 ‘dwidenoise’), and correction for Gibbs ringing20. We applied mutual-information rigid and affine registration13, and divided the DW-MRI volumes by their matched b=0 for normalisation. The regions of interest (ROIs) were drawn by a board-certified study radiologist on corresponding T2-weighted images.
VERDICT Model
The VERDICT model has three compartments that characterise diffusion in the intracellular (IC), vascular (VASC) and extracellular-extravascular space (EES) in tumours10. For renal tissue, the IC compartment is an impermeable sphere of radius R with diffusivity of dIC=2μm2/ms and the EES compartment is Gaussian free diffusion with diffusivity dEES=2μm2/ms. The vascular compartment is randomly-oriented sticks with pseudo-diffusivity dVASC=50μm2/ms to reflect the high vascularity of kidney tissue21. We estimate fIC (IC volume fraction), fEES (EES volume fraction) and cell radius R. The vascular volume fraction is fVASC=1–fIC–fEES.The total DW-MRI signal is:
$$\frac{S(b)}{S_{0}}=f_{VASC}S_{VASC}(d_{VASC},b)+f_{IC}S_{IC}(d_{IC},R,b)+f_{EES}S_{EES}(d_{EES},b)$$
where b is the b-value, S0 is the b=0 signal intensity. The model is fit to the data using supervised deep learning with a multilayer perceptron12,13,22.
Results
Figure 1 shows the normalised signal from each patient (symbols), with the predicted VERDICT and ADC signal in tumour and benign tissue (lines). We observe lower mean-squared error (MSE) for VERDICT than ADC.Figure 2 shows maps of ADC and the estimated VERDICT parameters. For patient 1 (grade 2), we see higher fIC, fVASC and R and lower fEES in the solid tumour region than in benign tissue, and no clear trends for ADC. We also observe higher fEES and lower fIC in the necrotic tumour region. For patient 2 (grade 3), we see lower ADC, fEES and fVASC, and higher fIC and R in the tumour region than in benign tissue.
Figure 3 presents average parameter estimates for each slice of the ROIs in three tissue types, revealing similar trends to the maps (Fig. 2). We plot estimates for both patients in the tumour region, showing lower fIC, higher fVASC and higher ADC for patient 1 (grade 2 RCC) than for patient 2 (grade 3 RCC).
Figure 4 presents CT images of both patients, showing stronger enhancement for patient 1 (90HU) than patient 2 (50HU).
Discussion and Conclusion
This work demonstrates the first use of VERDICT-MRI for renal tissue microstructure in two patients with different grade and subtype RCC. We show that VERDICT captures the DW-MR signal trends and discriminates tumour from benign tissue more effectively than ADC.VERDICT revealed lower fVASC in the tumour region for patient 2 than for patient 1, reflecting the reduced vascularity of the grade 3 tumour over the grade 2 ccRCC. This agrees with Fig. 4, as ccRCC are generally hypervascular, whilst other subtypes are often hypovascular23. Additionally, the grade 3 RCC has higher fIC than the grade 2, demonstrating increased cellularity in the higher-grade tumour24. This suggests VERDICT reflects specific histological properties, showing potential for non-invasive discrimination of RCC subtype.
Future work will recruit more patients for statistical analysis, and identify an economical acquisition protocol.
Acknowledgements
This work was supported by the EPSRC-funded UCL Centre for Doctoral Training in Intelligent, Integrated Imaging in Healthcare (i4health) (EP/S021930/1) and the Department of Health’s NIHR-funded Biomedical Research Centre at University College London Hospitals (BRC928/CN/RH/101330). This work is also funded by the EPSRC (EP/N021967/1).
References
[1] Hsieh JJ, Purdue MP, Signoretti S, Swanton C, Albiges L, Schmidinger M, et al. Renal cell carcinoma. Nat Rev Dis Primers. 2017 Mar 9;3:17009. doi: 10.1038/nrdp.2017.9.
[2] Diaz de Leon A, Pedrosa I. Imaging and Screening of Kidney Cancer. Radiol Clin North Am. 2017 Nov;55(6):1235-1250. doi: 10.1016/j.rcl.2017.06.007.
[3] Caroli A, Schneider M, Friedli I, Ljimani A, De Seigneux S, Boor P, et al. Diffusion-weighted magnetic resonance imaging to assess diffuse renal pathology: a systematic review and statement paper. Nephrol Dial Transplant. 2018 Sep; 1(33):29-40. doi: 10.1093/ndt/gfy163.
[4] Squillaci E, Manenti G, Cova M, Di Roma M, Miano R, Palmieri G, et al. Correlation of diffusion-weighted MR imaging with cellularity of renal tumours. Anticancer Res. 2004 Nov-Dec;24(6):4175-9.
[5] Taouli B, Thakur RK, Mannelli L, Babb JS, Kim S, Hecht EM, et al. Renal lesions: characterization with diffusion-weighted imaging versus contrast-enhanced MR imaging. Radiol. 2009 May;251(2):398-407. doi: 10.1148/radiol.2512080880.
[6] Paudyal B, Paudyal P, Tsushima Y, Oriuchi N, Amanuma M, Miyazaki M, et al. The role of the ADC value in the characterisation of renal carcinoma by diffusion-weighted MRI. Br J Radiol. 2010 Apr;83(988):336-43. doi: 10.1259/bjr/74949757.
[7] Sandrasegaran K, Sundaram CP, Ramaswamy R, Akisik FM, Rydberg MP, Lin C, et al. Usefulness of diffusion-weighted imaging in the evaluation of renal masses. AJR Am J Roentgenol. 2010 Feb;194(2):438-45. doi: 10.2214/AJR.09.3024.
[8] Wang H, Cheng L, Zhang X, Wang D, Guo A, Gao Y, et al. Renal Cell Carcinoma: Diffusion-weighted MR Imaging for Subtype Differentiation at 3.0 T. Radiol, 2010 257:1, 135-143. doi: 10.1148/radiol.10092396
[9] Giannarini G, Petralia P, Thoeny HC. Potential and Limitations of Diffusion-Weighted Magnetic Resonance Imaging in Kidney, Prostate, and Bladder Cancer Including Pelvic Lymph Node Staging: A Critical Analysis of the Literature. Eur Urol,
2012; 61(2): 326-340. doi: 10.1016/j.eururo.2011.09.019.
[10] Panagiotaki E, Walker-Samuel S, Siow B, Johnson SP, Rajkumar V, Pedley RB, et al. Noninvasive quantification of solid tumor microstructure using VERDICT MRI. Cancer Res. 2014 Apr 1;74(7):1902-12. doi: 10.1158/0008-5472.CAN-13-2511.
[11] Panagiotaki E, Chan RW, Dikaios N, Ahmed HU, O'Callaghan J, Freeman A, et al. Microstructural characterization of normal and malignant human prostate tissue with vascular, extracellular, and restricted diffusion for cytometry in tumours magnetic resonance imaging. Invest Radiol. 2015 Apr;50(4):218-27. doi: 10.1097/RLI.0000000000000115.
[12] Sen S, Valindria V, Slator PJ, Pye H, Grey A, Freeman A, et al. Differentiating False Positive Lesions from Clinically Significant Cancer and Normal Prostate Tissue Using VERDICT MRI and Other Diffusion Models. Diagnostics (Basel). 2022 Jul 5;12(7):1631. doi: 10.3390/diagnostics12071631.
[13] Palombo M, Valindria V, Singh S, Chiou E, Giganti F, Pye H, et al. Joint estimation of relaxation and diffusion tissue parameters for prostate cancer with relaxation-VERDICT MRI. Sci Rep 13, 2999 (2023). https://doi.org/10.1038/s41598-023-30182-1
[14] Figini M, Castellano A, Bailo M, Callea M, Cadioli M, Bouyagoub S, et al. Comprehensive Brain Tumour Characterisation with VERDICT-MRI: Evaluation of Cellular and Vascular Measures Validated by Histology. Cancers (Basel). 2023 Apr 27;15(9):2490. doi: 10.3390/cancers15092490.
[15] Tariq, M, Liao, C, Bonet-Carne, E, Plumb, AA, Rodriguez-Justo, M, Alexander, DC, et al. Feasibility of VERDICT-MRI for non-invasive characterisation of rectal cancer microstructure. In: (Proceedings) ISMRM 2018 (International Society for Magnetic Resonance in Medicine).
[16] Johnston EW, Bonet-Carne E, Ferizi U, Yvernault B, Pye H, Patel D, et al. VERDICT MRI for Prostate Cancer: Intracellular Volume Fraction versus Apparent Diffusion Coefficient. Radiol. 2019 May;291(2):391-397. doi: 10.1148/radiol.2019181749.
[17] Singh S, Rogers H, Kanber B, Clemente J, Pye H, Johnston EW, et al. Avoiding Unnecessary Biopsy after Multiparametric Prostate MRI with VERDICT Analysis: The INNOVATE Study. Radiol. 2022 Dec;305(3):623-630. doi: 10.1148/radiol.212536.
[18] Veraart J, Fieremans E, Novikov DS. Diffusion MRI noise mapping using random matrix theory. Magn. Reson. Med. 2016; 76: 1582-1593. doi: 10.1002/mrm.26059
[19] Tournier JD, Smith R, Raffelt D, Tabbara R, Dhollander T, Peitsch M et al. MRtrix3: A fast, flexible and open software framework for medical image processing and visualisation. Neuroimage. 2019; 202: 116137. doi: 10.1016/j.neuroimage.2019.116137
[20] Kellner E, Dhital B, Kiselev VG, Reisert M. Gibbs-ringing artifact removal based on local subvoxel-shifts. Magn. Reson. Med. 2015; 76: 1574-1581. doi: 10.1002/mrm.26054
[21] Sequeira Lopez ML, Gomez RA. Development of the renal arterioles. J Am Soc Nephrol. 2011 Dec;22(12):2156-65. doi: 10.1681/ASN.2011080818.
[22] Valindria V, Chiou E, Palombo M, Singh S, Punwani S, Panagiotaki E. Synthetic q-space learning with deep regression networks for prostate cancer characterisation with verdict. In Proceedings of the IEEE International Symposium on Biomedical Imaging (ISBI), 2021.
[23] Pallwein-Prettner L, Flöry D, Rotter CR, Pogner K, Syré G, Fellner C, et al. Assessment and characterisation of common renal masses with CT and MRI. Insights Imaging. 2011 Oct;2(5):543-556. doi: 10.1007/s13244-011-0116-1.
[24] Al Nazer M, Mourad WA. Successful grading of renal-cell carcinoma in fine-needle aspirates. Diagn Cytopathol. 2000 Apr;22(4):223-6. doi: 10.1002/(sici)1097-0339(200004)22:4<223::aid-dc4>3.0.co;2-b.
Figures
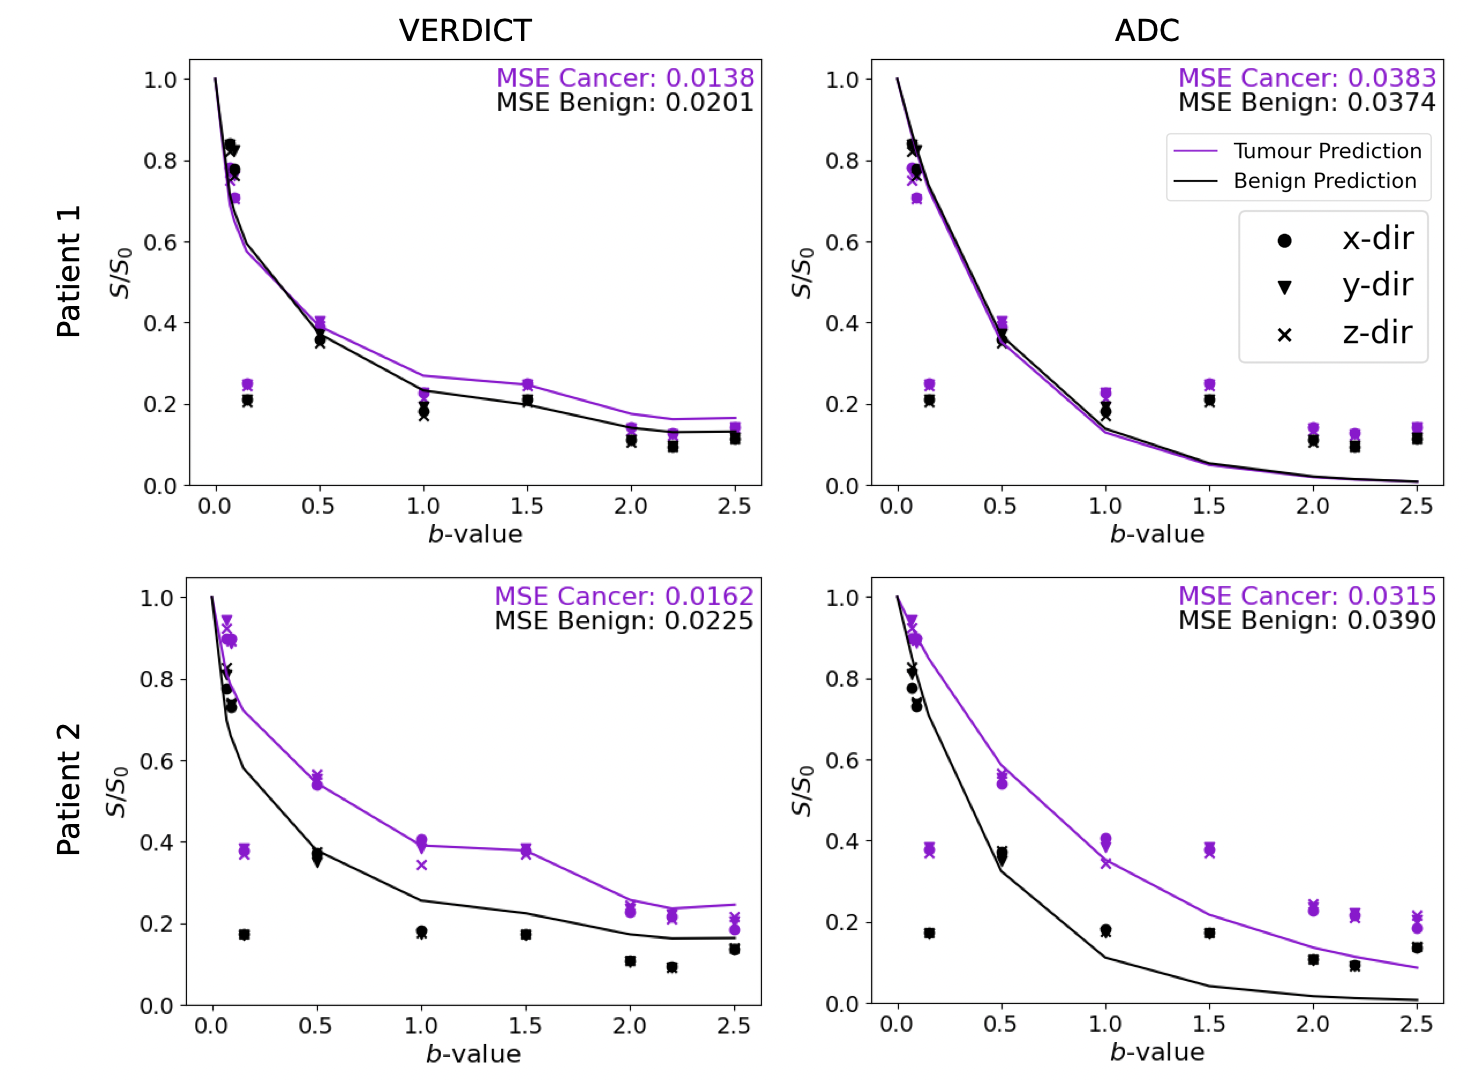
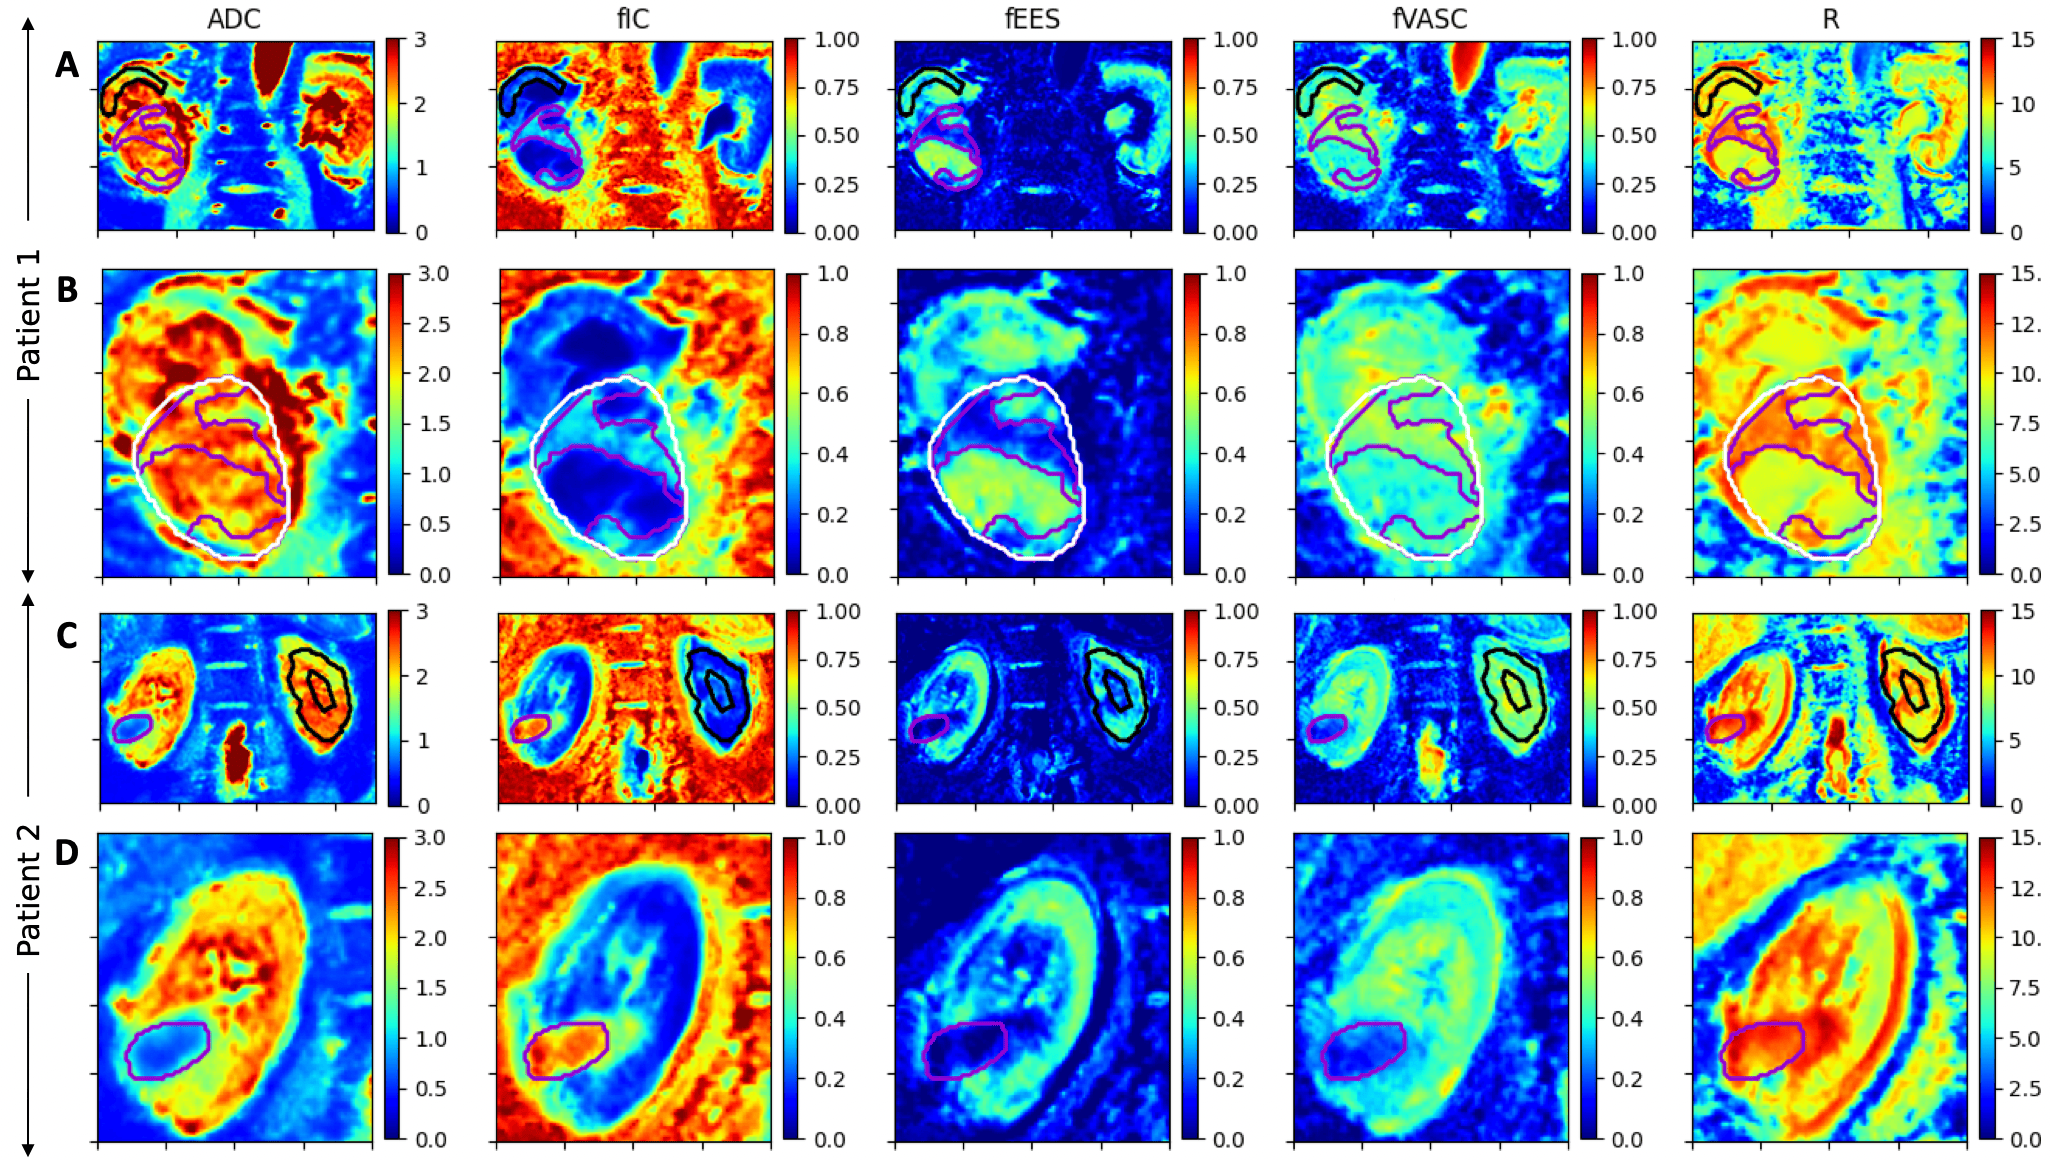
Figure 2: Parameter maps with tumour ROI (purple) and benign ROI (black). A) patient 1 (benign ROI on ipsilateral) shows higher fIC, fVASC and R and lower fEES in the solid tumour region than benign. B) patient 1, whole tumour (white) with necrotic region outside purple solid tumour, shows higher fEES and lower fIC in the necrotic tumour region. C) and D) patient 2 (benign ROI on contralateral) shows lower ADC, fEES and fVASC, and higher fIC and R in the tumour region than benign.
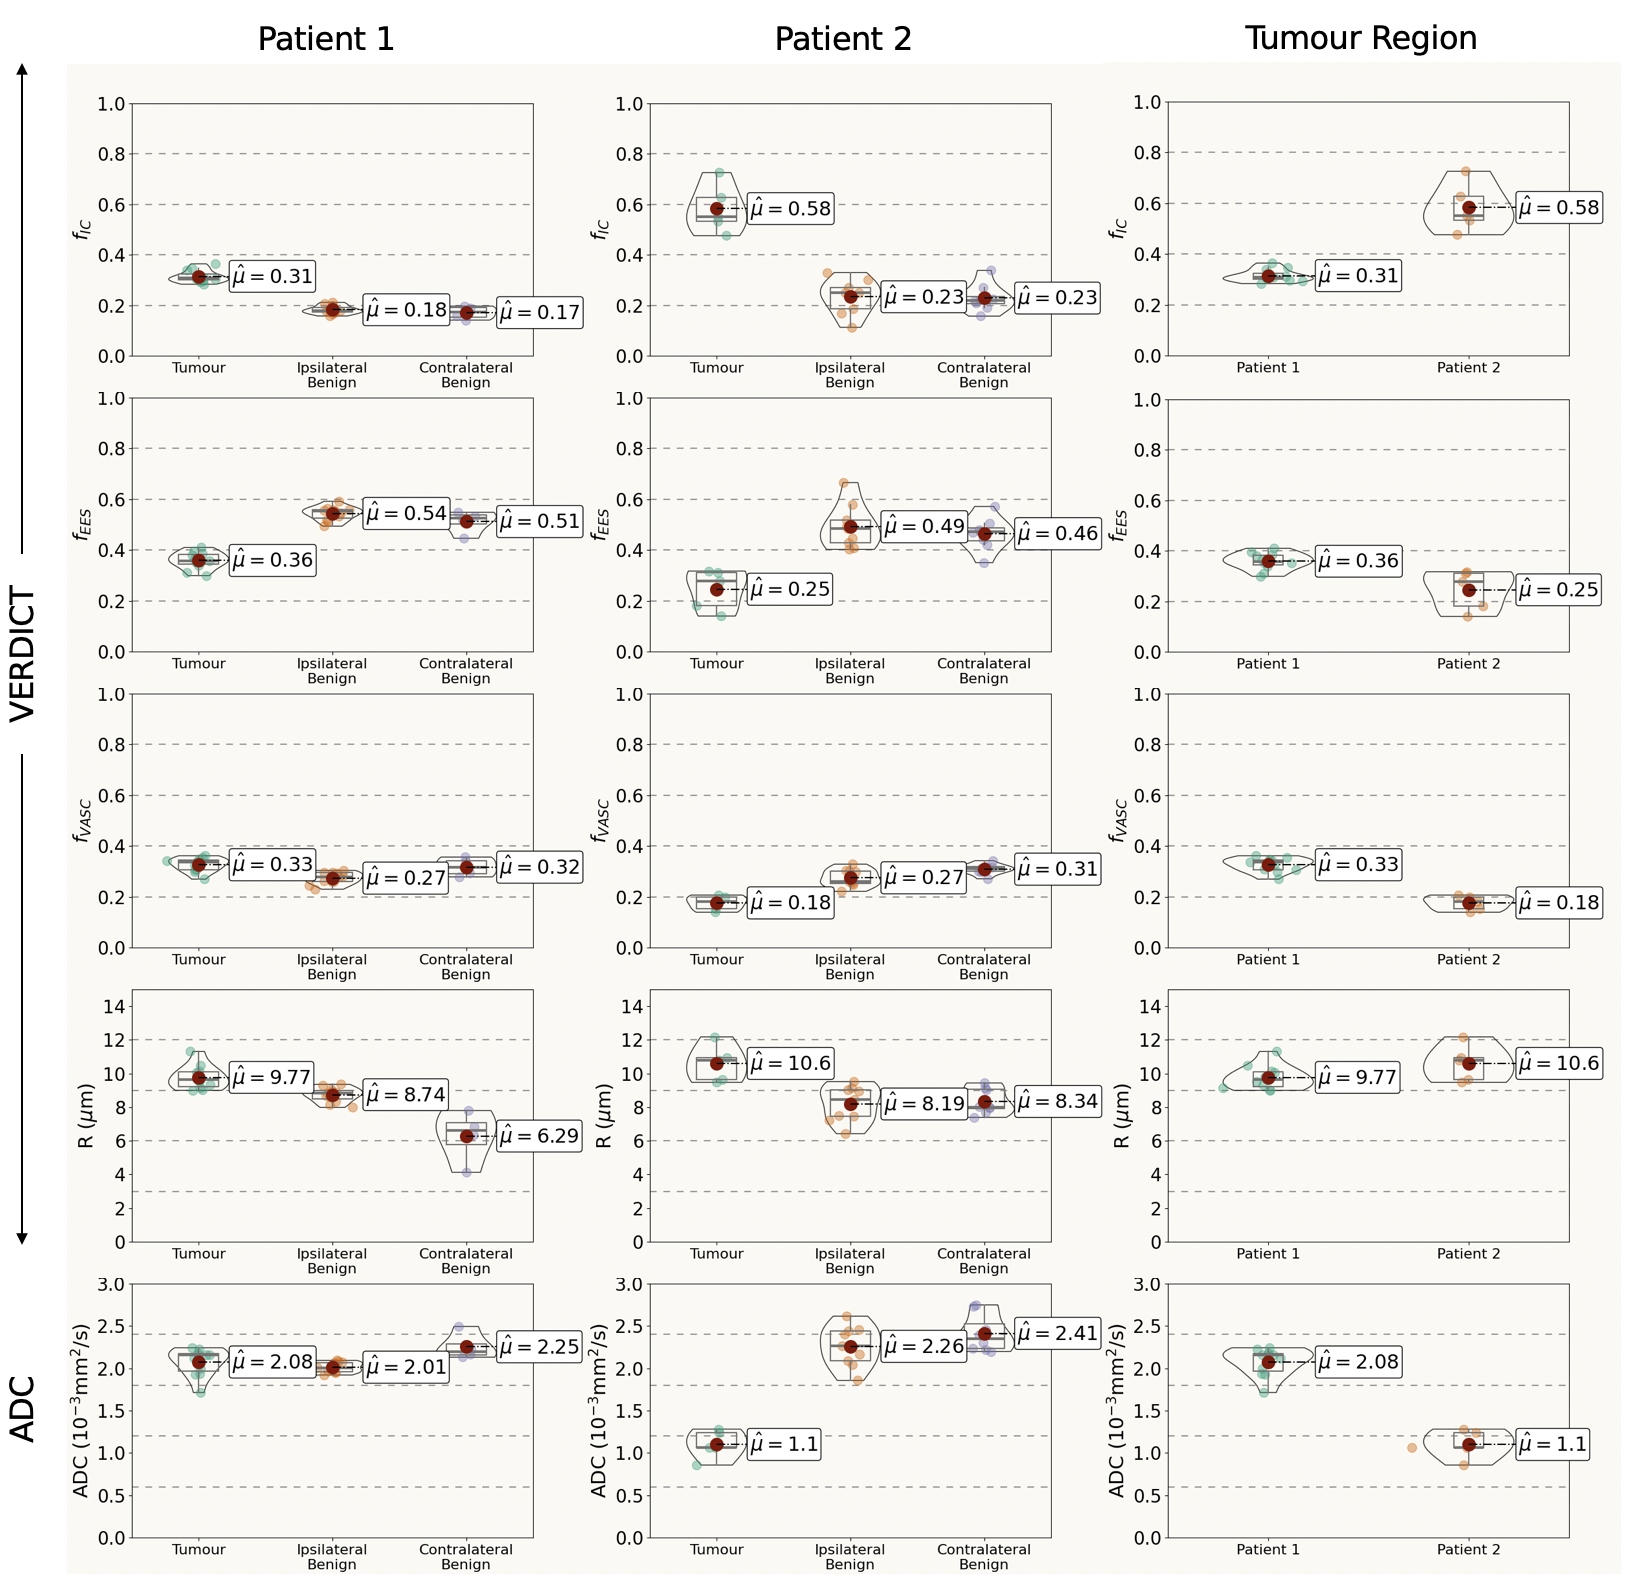
Figure 3: Violin plots showing VERDICT and ADC parameter values in tumour region, ipsilateral and contralateral benign kidney for both patients, and comparisons between patient parameter estimates in the tumour region, where μ is the mean. For both patients, we observe higher fIC and R and lower fEES in the tumour region than benign, and for patient 2 we see lower fVASC and ADC in the tumour. Patient 1 shows lower fIC and higher fVASC and ADC in the tumour region than patient 2.
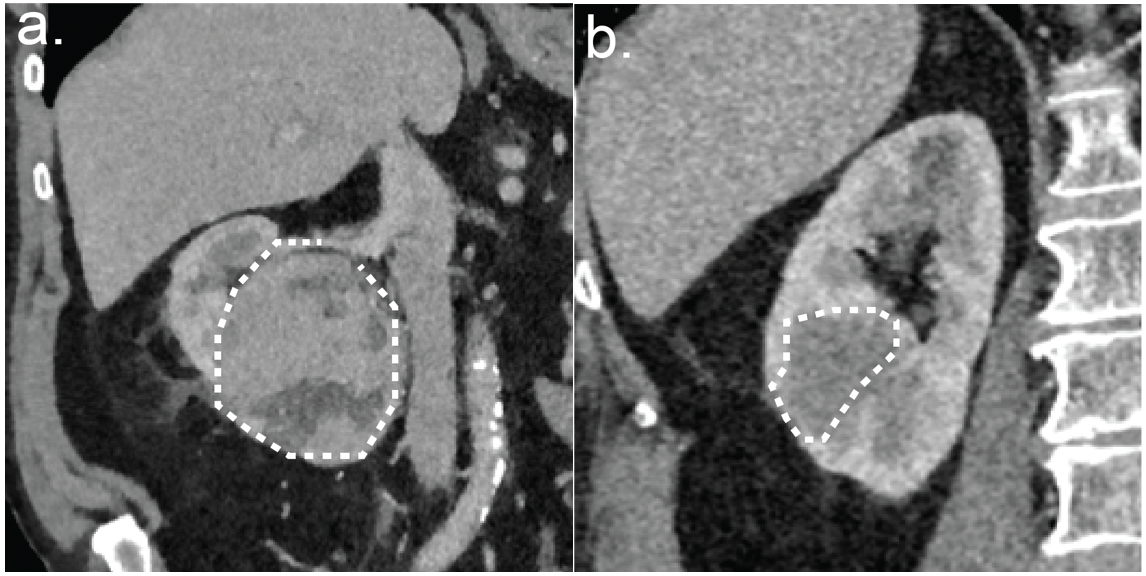
Figure 4: Nephrographic phase coronal computerised tomography (CT) scan slices through the right renal tumours of (a) patient 1, 90 Hounsfield units (HU) and (b) patient 2, 50 HU. The lower enhancement of patient 2 can be attributed to the tumour subtype, which has reduced vascularity in comparison to clear-cell RCC subtype of patient 1.